
Risk and return are most important concepts in finance. In fact, they are the foundation of the modern finance theory. What is risk? How is it measured? What is return? How is it measured? Other related questions are: how are assets valued in capital markets? How do investors make their investment decisions? We attempt to answer these questions in this chapter.
RETURN ON A SINGLE ASSET
India Cements is a large company with several thousand shareholders. Suppose you bought 100 shares of the company, at the beginning of the year, at a market price of `225. The par value of each share is `10. Your total investment is cash that you paid out. That is, Investment: `225 × 100 = `22,500
Rupee Returns
Suppose during the year, India Cements paid a dividend at 25 per cent. As the dividend rate applies to the par value of the share, your dividend per share would be: `10 × 25% = `2.50, and total dividend would be:
Dividend = (Dividend rate × Par value) × Number of shares
Dividend = Dividend per share × Number of shares
Dividend = `2.50 × 100 = `250
Further, suppose the price of the share at the end of the year turns out to be `267.50. Since the ending share price increased, you have made a capital gain: Capital gain/loss = (Selling price – Buying price) × Number of shares
Total return = Dividend + Capital gain
Capital gain/loss = (`267.50 – `225) × 100 = `4,250 Your total return is:
Total return = `250 + `4,250 = `4,500
If you sold your shares at the end of the year, your cash inflows would be the dividend income plus the proceeds from the sale of shares:
Cash flow at the end of the year= Dividends + Value of sold shares
= `250 + (`267.50 × 100) = `27,000
This amount equals to your initial investment of `22,500 plus the total return of `4,500: `22,500 + `4,500 = `27,000.
Percentage Returns
It is more common and convenient to express returns in percentage terms. You earned a total return of `4,500 on an investment of `22,500. You can express your return in percentage term as given below
`4,500
Return in percentage = = 0.20 or 20%
`22,500
Percentage returns are frequently calculated on per share basis. We have seen in the example above that returns from each share have two components: the dividend income and the capital gain. Hence, the rate of return on a share would consist of the dividend yield and the capital gain yield.1 The rate of return of a share held for one year is as follows: Rate of return = Dividend yield + Capital gain yield
R1 = DIVP0 1 P1 P0 P0 DIV1 P(0P1 P0 ) (1)
R1 is the rate of return in year 1, DIV1 is dividend per share received in year 1, P0 is the price of the share in the beginning of the year and P1 is the price of the share at the end of the year. Dividend yield is the percentage of dividend income, and it is given by dividing the dividend per share at the end the year by the share price in the beginning of the year; that is, DIV1/P0. Capital gain is the difference of the share price at the end and the share price in the beginning divided by the share price in the beginning; that is, (P1 – P0)/P0. If the ending price were less than the beginning price, there would be a negative capital gain or capital loss. In the example of India Cements, your rate of return would be as follows:
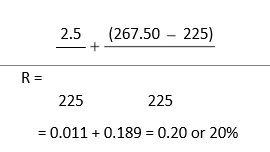
The total return of 20 per cent on your investment is made up of 1.1 per cent dividend yield and 18.9 per cent capital gain. What would be your return if the market price of India Cements’ share were `200 after a year? The expected rate of return would be

You would earn a negative rate of return (–10 per cent) because of the capital loss (negative capital gain). The return of a share significantly depends on the change in its share price. The market price of a share shows wide fluctuations. Hence investment in shares is risky. The risk of a security depends on the volatility of its returns.
If an investor holds a share and does not sell it at the end of a period, the difference between the beginning and ending share prices is the unrealized capital gain (or loss). The investor must consider the unrealized capital gain (or loss) as part of her total return. The fact of the matter is that if the investor so wanted, she could have sold the share and realized the capital gain (or loss).
Unrealized Capital Gain or Loss
Annual Rates of Return: Example of Hindustan Unilever Limited
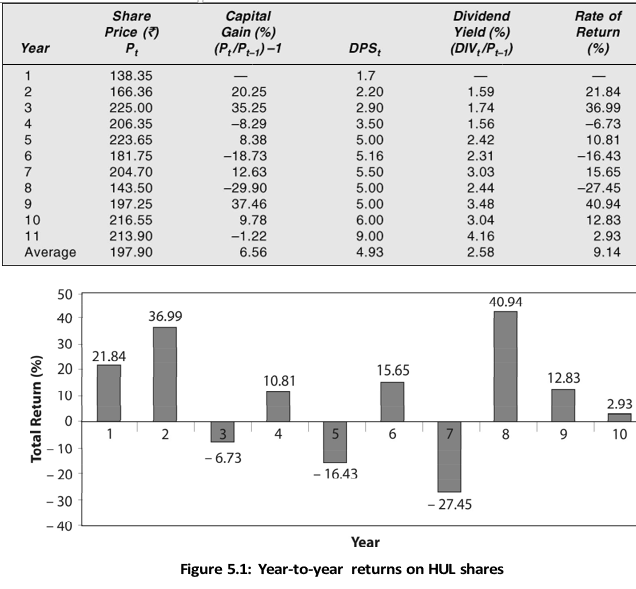
The rate of return of a company’s shares may be calculated for a period longer than one year. Let us consider HUL’s data of the market prices and dividend per share for the 11-year period to calculate the 10-year annual rates of return. Table 5.1 shows calculations.
Figure 5.1 plots the histogram of the year-to-year total returns on HUL share shown in Table 5.1. The heights of the bars on the horizontal axis indicate the size of returns. The yearly returns show wide variations. During the 10-year period, the highest return was 40.94 per cent and lowest return was –27.45 per cent.
Average Rate of Return
Given the yearly returns, we can calculate average or mean return. The average rate of return is the sum of the various one-period rates of return divided by the number of periods. The average rate of return of HUL’s shares for ten years can be calculated as the sum of yearly rates divided by the number of years as shown below:
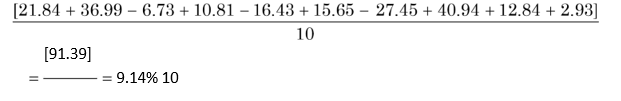
Table 5.1: HUL’s Annual Rates of Return
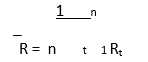
The simple arithmetic average or mean of HUL’s 10 annual returns is about 9.14 per cent. The formula for the average rate of return is as follows:
R is the average rate of return; Rt the observed or realized rates of return in periods 1, 2… t and n the total number of periods.
Rates of Return and Holding Periods
Investors may hold their investment in shares for longer periods than for one year. How do we calculate holding-period returns? Suppose you invest `1 today in a company’s share for five years. The rates of return are 18 per cent, 9 per cent, 0 per cent, –10 per cent and 14 per cent. What is the worth of your shares? You hold the share for five years; hence, you can calculate the worth of your investment assuming that each year dividends from the previous year are reinvested in shares. The worth of your investment after five years is:
Investment worth after five years
= (1 + 0.18) × (1 + 0.09) × (1 + 0.0) × (1 – 0.10) × (1 + 0.14)
= 1.18 × 1.09 × 1.00 × 0.90 × 1.14 = `1.32
Your one rupee investment has grown to `1.32 at the end of five years. Thus your total return is: 1.32 – 1 = 0.32 or 32 per cent. Your total return is a five-year holding-period return. How much is the annual compound rate of return? We can calculate the compound annual rate of return as follows:
Compound annual rate of return
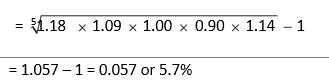
This compound rate of return is the geometric mean return. You can verify that one rupee invested today at 5.7 per cent compound rate would grow to approximately `1.32 after five years: (1.057)5 = `1.32. Let us take another example. Suppose you invest `1 in the beginning in one share of HUL and hold it for two years. From Table 5.1 we see that returns for first two years are 21.84 per cent and 36.99 per cent. The worth of your investment at the end of two years is:
Investment worth after two years
= (1 + 0.2184) × (1 + 0.3699)
= 1.2184 × 1.3699 = `1.6690
Your total return is 67 per cent. This is a two-year holding-period return. If you hold your one rupee investment in HUL’s share at the end of the first year for 10 years until the end of 11 years, it would grow to `1.979. Your 10-year holding return is a whopping 97.9 per cent! You can calculate holding period returns for any number of years.
Calculate the deviation of individual rates of return from the average rate of return and square it, i.e., (R1 – R)2
Calculate the sum of the squares of the deviations as determined in the preceding step and divide it by the number of periods (or observations) less one to obtain sample variance, i.e.,
In the case of sample of observations, we divide the sum of squares of the deviations by n – 1 to account for the degree of freedom. If you were using population data, then the divider will be n.
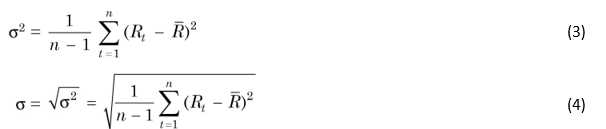
Calculate the square root of the variance to determine the standard deviation, i.e., Standard deviation = Variance
We can summarize the formulae for calculating variance and standard deviation of historical rates of return of a single share as follows:
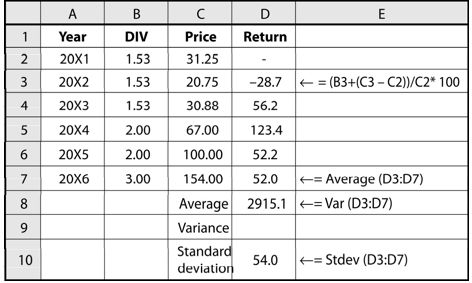
| EXCEL APPLICATION 5.1: Calculation of Variance and Standard Deviation |
Columns B and C respectively give Jenson and Nicholson’s dividend per share and share price for six years. You can enter a formula for calculating annual return in D3 as shown in the worksheet. Excel has built-in formulae to calculate average, variance and standard deviation. Let us enter formula for average in D8: Average (D3:D7). We obtain 52 per cent as the 5-year average of Jenson and Nicholson’s returns. Similarly, we can write formula for calculating variance in column D9: Var(D3:D7) and for standard deviation in column D10: Stdev(D3:D7). We find that the standard deviation of returns is 54 per cent.
In Table 5.1, the ten annual rates of return for HUL’s share are calculated. The average rate of return is 9.14 per cent. For HUL’s rates of return sample of 10 years, you can calculate the variance and the standard deviation using Equations (3) and (4) as follows:
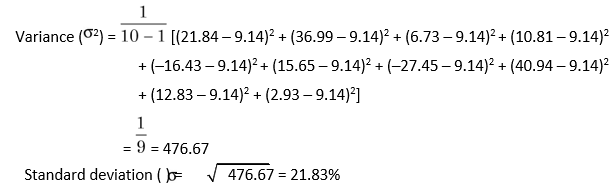
The annual rates of return of HUL’s share show a high degree of variability; they deviate on an average, by about 21.83 per cent from the average rate of return of 9.14 per cent. Can we use HUL’s past returns as a guide for the future returns? It is difficult to say that past returns will help in assessing the future returns since HUL’s returns are quite volatile. The actual rate of return in any given period may significantly vary from the historical average rate of return.
EXPECTED RETURN AND RISK: INCORPORATING PROBABILITIES IN ESTIMATES
Instead of using historical data for calculating return and risk, we may use forecasted data.
Suppose you are considering buying one share of India Cements, which has a market price of `261.25 today. The company pays a dividend of `2.50 per share. You want to hold the share for one year. What is your expected rate of return? This will depend on the dividend per share you would actually receive and the market price at which you could sell the share. You do not know both the outcomes. The outcomes may depend on the economic conditions, the performance of the company and other factors. You will have to think of the outcomes of dividend and the share price under possible economic scenarios to arrive at a judgement about the expected return. You may, for example, assume four (equally likely) possible states of economic conditions and performance: high growth, expansion, stagnation and decline. You also expect the market price of share to be `305.50, `285.50, `261.25 and `243.50 and the dividend per share `4, `3.25, `2.50 and `2, respectively, under four different states of economic conditions. Thus the possible outcomes of return can be calculated as follows in Table 5.2.
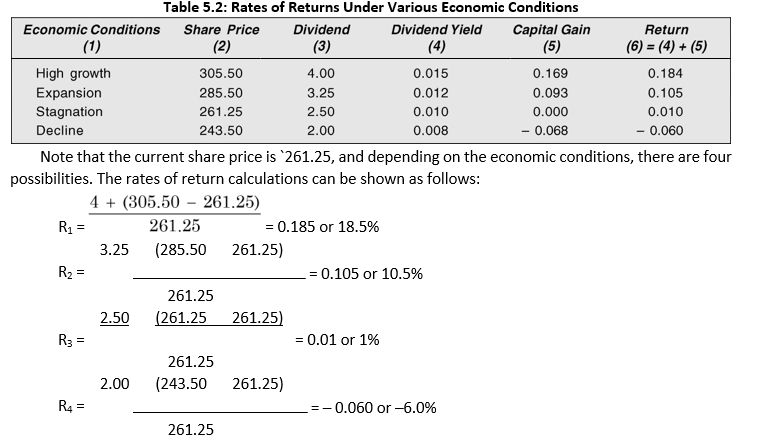
Your total return is anticipated to vary between –6 per cent under the unfavourable condition to +18.5 per cent under the most favourable conditions. What is the chance or likelihood for each outcome anticipated by you to occur? Probability is the percentage of the chance or likelihood of an outcome. On the basis of your judgement, you may, for example, say that each outcome is equally likely to occur, i.e., each outcome has a chance of 0.25 or 25 per cent. This is your subjective assessment. The subjective probability is based on the judgement of the investor rather than on an objective assessment of events to occur. The objective probability is based on the appraisal of the occurrence of an event for a very large number of times. The sum of probabilities of the occurrence of outcomes is always equal to 1.
Expected Rate of Return
Expected rate of return = rate of return under scenario 1 × probability of scenario 1 + rate
Table 5.3 summarizes the range of returns under the possible states of economic conditions along with probabilities. You can put this information together to calculate the expected rate of return. The expected rate of return [E(R)] is the sum of the product of each outcome (return) and its associated probability:
of return under scenario 2 × probability of scenario 2 +… + rate of return under scenario n × probability of scenario n
Thus, the expected rate of return is as given below:
E(R) = (18.5 × 0.25) + (10.5 × 0.25) + (1.00 × 0.25) + (–6.0 × 0.25) = 0.06 or 6%
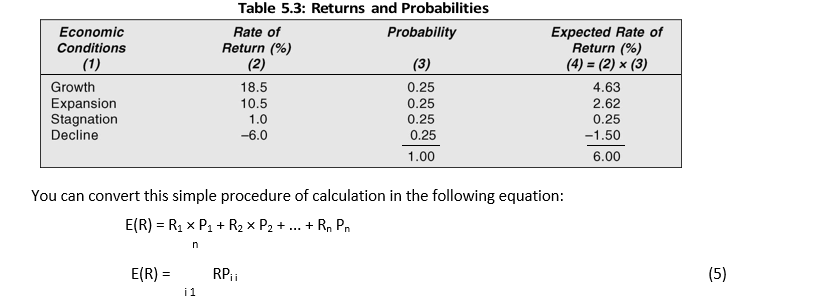
Note that E(R) is the expected rate of return, Ri the outcome i, Pi is the probability of the occurrence of i, and n is the total number of outcomes.
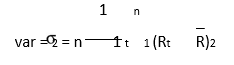
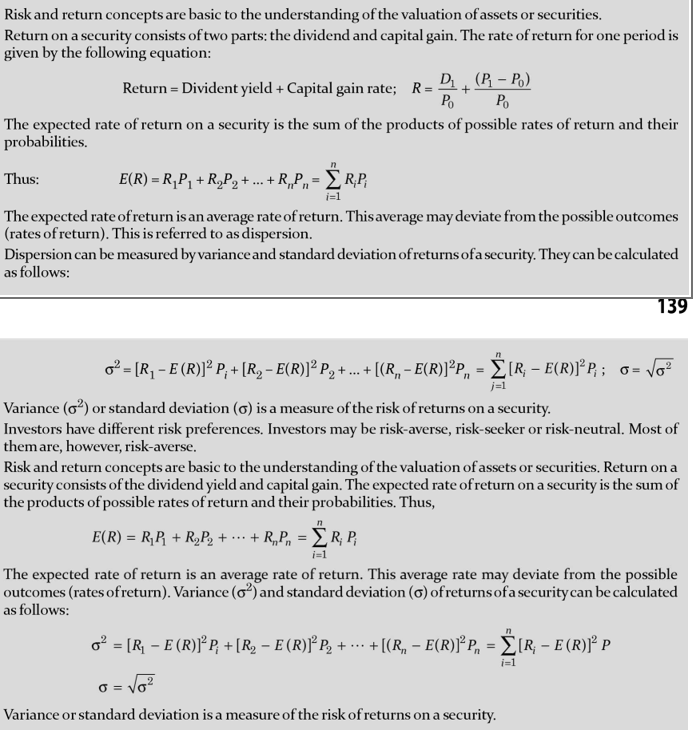
The expected rate of return is the average return. It is 6 per cent in our example. We know that the possible outcomes range between –6 per cent to +18.5 per cent. How much is the average dispersion? As stated earlier, this is explained by the variance or the standard deviation. The steps involved in the calculation of the variance and the standard deviation are the same as already discussed in the preceding section, except that the square of the difference of an outcome (return) from the expected return should be multiplied by its probability. The following formula can be used to calculate the variance of returns: 2 = [R1 – E (R)]2 P1 + [R2 – E(R)]2 P2 + … + [Rn – E(R)]2Pn
n
= [Rn E R( )]2Pn (6)
i 1
In the above example, the variance of returns is:
2 = [(18.5 – 6)2 × 0.25] + [(10.5 – 6)2 × 0.25]
+ [(1 – 6)2 × 0.25)] + [(–6 – 6)2 × 0.25] = 86.375
and the standard deviation is:
![]()
Risk Preference
Should you invest in the share of India Cement? The returns are expected to fluctuate widely. The expected rate of return is low (6 per cent) and the standard deviation is high (9.29 per cent). You may like to search for an investment with higher expected return and lower standard deviation.
The information about the expected return and standard deviation helps an investor to make decision about investments. This depends on the investor’s risk preference. Generally investors would prefer investments with higher rates of return and lower standard deviations. According to the economic principle of diminishing marginal utility, as a person gets more and more wealth his utility for additional wealth increases at a declining rate. For example, a person obtains less utility from gaining additional `1,000 than she forgoes in losing `1,000. Thus the utility function for risk-averse persons is concave, as shown in Figure 5.2.
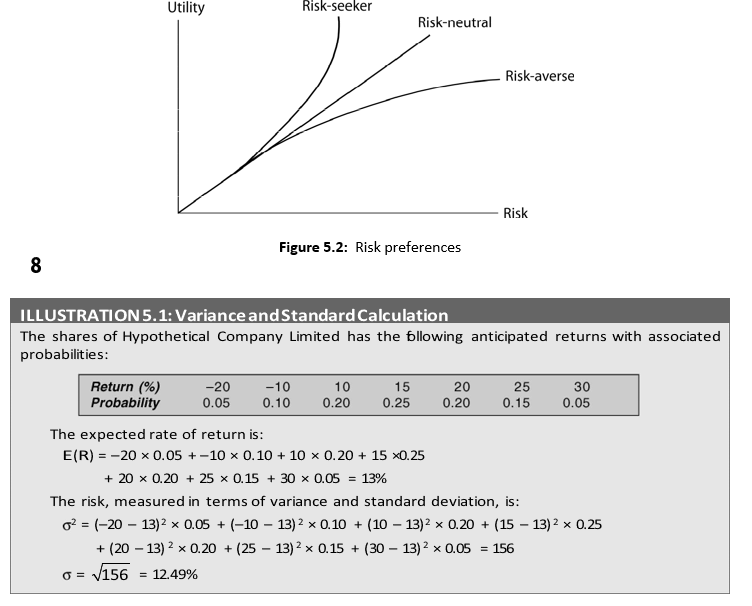
A risk-averse investor will choose from investments with the equal rates of return, the investment with lowest standard deviation. Similarly, if investments have equal risk (standard deviations), the investor would prefer the one with higher return. A risk-neutral investor does not consider risk, and he would always prefer investments with higher returns. A risk-
seeking investor likes investments with higher risk irrespective of the rates of return. In reality, most (if not all) investors are risk-averse. How would risk-averse investors make their choices if investments have higher returns and higher standard deviations or lower returns and lower standard deviations? We shall provide answer to this question in the next chapter.
Review Questions
- What is a return? Explain the components of (total) return? Should unrealized capital gain (orloss) be included in the calculations of returns?
- Illustrate the computation of the expected rate of return of an asset.
- Define holding-period return. How is it calculated?
- What is risk? How can risk of a single security be calculated? Explain your answer with the helpof an example.
- Illustrate the computation of the expected rate of return of an asset.
Quiz Exercises
- A company’s share is currently selling for `120. The expected dividend per share and next year’s share price are, respectively, `5 and `132. Calculate expected return on the company’s share.
- On 1 January 2010, Mr Y P Singh purchased 100 shares of a company at `330 each. During the year, he received total dividends of `500. Mr Singh sold all his shares at `375 each on 31 December 2010. Calculate Mr Singh’s (i) capital gain amount, and (ii) total return in (a) rupee amount and (b) percentage.
A company’s share is currently selling for `80. The expected dividend per share and next year’s share price are, respectively, `5 and `62. Calculate expected return on the company’s share.
- The closing price of share last year was `70. The dividend per share was `7 during the year. The current year closing price is `77. Calculate the percentage return on the share, decomposing it into the dividend yield and the capital gain rate.
- You bought a company’s share for `230 two years ago. You held the stock for two years, and received dividend per share of `25 and `35, respectively, at the end of the first and the second years. You sold the share for `258 after two years. What was your two-year holding period return on Infosys share?
- You expect to earn a return of 22 per cent on a share. If the inflation rate is 7.5 per cent, what isyour real rate of return?
- You have a required rate of return of 5 per cent in real terms. You expect to receive 12 per centfrom your fixed deposit next year. What is the expected inflation rate?
- There is 33 per cent probability that your return next year will be 23 per cent and 67 per centprobability that it will be 7 per cent. What is your expected return?
- You have to choose between two investments. Investment A offers an expected return of 20 percent with standard deviation of ±12 per cent while investment B offers an expected return of 15 per cent with standard deviation of ±5 per cent. Which investment is better and why?