
INTRODUCTION
Given the capital budgeting decision of a firm, it has to decide the way in which the capital projects will be financed. Every time the firm makes an investment decision, it is at the same time making a financing decision also. For example, a decision to build a new plant or to buy a new machine implies specific way of financing that project. Should a firm employ equity or debt or both? What are implications of the debt–equity mix? What is an appropriate mix of debt and equity?
CAPITAL STRUCTURE DEFINED
The assets of a company can be financed either by increasing the owners’ claims or the creditors’ claims. The owners’ claims increase when the firm raises funds by issuing ordinary shares or by retaining the earnings; the creditors’ claims increase by borrowing. The various means of financing represent the financial structure of an enterprise. The left-hand side of the balance sheet (liabilities plus equity) represents the financial structure of a company.* Traditionally, short-term borrowings are excluded from the list of methods of financing the firm’s capital expenditure, and therefore, the long-term claims are said to form the capital structure of the enterprise. The term capital structure is used to represent the proportionate relationship between debt and equity. Equity includes paid-up share capital, share premium and reserves and surplus (retained earnings).
The management of a company should seek answers to the following questions while making the financing decision:
The financing or capital structure decision is a significant managerial decision. As discussed later in this chapter, it influences the shareholder’s return and risk. Consequently, the market value of the share may be affected by the capital structure decision. The company will have to plan its capital structure initially, at the time of its promotion. Subsequently, whenever funds have to be raised to finance investments, a capital structure decision is involved. A demand for raising funds generates a new capital structure since a decision has to be made as to the quantity and forms of financing. This decision will involve an analysis of the existing capital structure and the factors, which will govern the decision at present. The dividend decision, as discussed later on, is, in a way, a financing decision. The company’s policy to retain or distribute earnings affects the owners’ claims. Shareholder equity position is strengthened by retention of earnings. Thus, the dividend decision has a bearing on the capital structure of the company. The new financing decision of the company may affect its debt–equity mix. The debt–equity mix has implications for the shareholders’ earnings and risk, which in turn, will affect the cost of capital and the market value of the firm.
How should the investment project be financed?
Does the way in which the investment projects are financed matter?
How does financing affect the shareholders’ risk, return and value?
Does there exist an optimum financing mix in terms of the maximum value to the firm’s shareholders?
Can the optimum financing mix be determined in practice for a company?
What factors in practice should a company consider in designing its financing policy?
We will provide answers to these questions in this and the upcoming chapters.
MEANING OF FINANCIAL LEVERAGE
As stated earlier, a company can finance its investments by debt and equity. The company may also use preference capital. The rate of interest on debt is fixed irrespective of the
company’s rate of return on assets. The company has a legal binding to pay interest on debt. The rate of preference dividend is also fixed; but preference dividends are paid when the company earns profits. The ordinary shareholders are entitled to the residual income. That is, earnings after interest and taxes (less preference dividends) belong to them. The rate of the equity dividend is not fixed and depends on the dividend policy of a company.
The use of the fixed-charges sources of funds, such as debt and preference capital along with the owners’ equity in the capital structure, is described as financial leverage or gearing or trading on equity. The use of the term trading on equity is derived from the fact that it is the owner’s equity that is used as a basis to raise debt; that is, the equity that is traded upon. The supplier of debt has limited participation in the company’s profits and, therefore, he will insist on protection in earnings and protection in values represented by ownership equity.1
This role of financial leverage suggests a lesson in physics, and there might be some point in considering the rate of interest paid as the fulcrum used in applying forces through leverage. At least it suggests consideration of pertinent variables; the lower the interest rate, greater will be the profit, and lesser the chance of loss; again, the lesser the amount borrowed, lower will be the profit or loss; also, the greater the borrowing, greater will be the risk of unprofitable leverage and the greater the chance of gain.
The financial leverage employed by a company is intended to earn more return on the fixed-charge funds than their costs. The surplus (or deficit) will increase (or decrease) the return on the owners’ equity. The rate of return on the owners’ equity is levered above or below the rate of return on total assets. For example, if a company borrows `100 at 8 per cent interest (that is, `8 per annum) and invests it to earn 12 per cent return (that is, `12 per annum), the balance of 4 per cent (`4 per annum) after payment of interest will belong to the shareholders, and it constitutes the profit from financial leverage. On the other hand, if the company could earn only a return of 6 per cent on `100 (`6 per annum), the loss to the shareholders would be `2 per annum. Thus, financial leverage provides the potentials of increasing the shareholders’ earnings as well as creating the risks of loss to them. It is a double-edged sword. The following statement very well summarizes the concept of financial leverage:2
MEASURES OF FINANCIAL LEVERAGE
The most commonly used measures of financial leverage are:3
- Debt ratio The ratio of debt to total capital, i.e.,
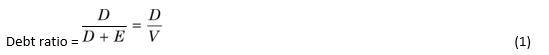
where D is value of debt, E is value of shareholders’ equity and V is value of total capital (i.e., D + E). D and E may be measured in terms of book value. The book value of equity is called net worth. Shareholder’s equity may be measured in terms of market value.
- Debt–equity ratioThe ratio of debt to equity, i.e.,
D
D/E ratio = (2)
E
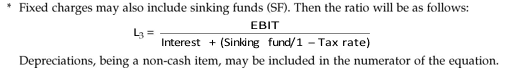
- Interest coverageThe ratio of net operating income (or EBIT) to interest charges, i.e.,*
EBIT
Interest coverage ratio = (3)
Interest
Since depreciation (and amortisation) is a non-cash item, interest coverage ratio may be calculated as:
EBITDA
Interest coverage ratio = (4)
Interest
where EBITDA is earnings before interest, taxes, depreciation and amortisation.
The first two measures of financial leverage can be expressed either in terms of book values or market values. The market value to financial leverage is theoretically more appropriate because market values reflect the current attitude of investors. But it is difficult to get reliable information on market values in practice. The market values of securities fluctuate quite frequently.
There is no difference between the first two measures of financial leverage in operational terms. Both these measures of financial leverage will rank companies in the same order. However, the first measure (i.e., D/V) is more specific as its value will range between zero to one. The value of the second measure (i.e., D/E) may vary from zero to any large number. The debt–equity ratio, as a measure of financial leverage, is more popular in practice. There is usually an accepted industry standard to which the company’s debt–equity ratio is compared. The company will be considered risky if its debt–equity ratio exceeds the industry standard. Financial institutions and banks in India also focus on debt–equity ratio in their lending decisions.
The third measure of financial leverage, commonly known as coverage ratio, indicates the capacity of the company to meet fixed financial charges. The reciprocal of interest coverage, that is, interest divided by EBIT, is a measure of the firm’s income gearing. Again, by comparing the company’s coverage ratio with an accepted industry standard, investors can get an idea of financial risk. However, this measure suffers from certain limitations.4 First, to determine the company’s ability to meet fixed financial obligations, it is the cash flow information, which is relevant, not the reported earnings. During recessionary economic conditions, there can be wide disparity between the earnings and the net cash flows generated from operations. Second, this ratio, when calculated on past earnings, does not provide any guide regarding the future riskiness of the company. Third, it is only a measure of shortterm liquidity rather than of leverage.
The first two measures of financial leverage are also measures of capital gearing. They are static in nature as they show the borrowing position of the company at a point of time. These measures, thus, fail to reflect the level of financial risk, which is inherent in the possible failure of the company to pay interest and repay debt.
FINANCIAL LEVERAGE AND THE SHAREHOLDERS’ RETURN
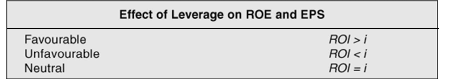
The primary motive of a company in using financial leverage is to magnify the shareholders’ return under favourable economic conditions. The role of financial leverage in magnifying the return of the shareholders is based on the assumptions that the fixed-charges funds (such as the loan from financial institutions and banks or debentures) can be obtained at a cost lower than the firm’s rate of return on net assets (RONA or ROI). Thus, when the difference between the earnings generated by assets financed by the fixed-charges funds and costs of these funds is distributed to the shareholders, the earnings per share (EPS) or return on equity (ROE) increases. However, EPS or ROE will fall if the company obtains the fixed-charges funds at a cost higher than the rate of return on the firm’s assets. It should, therefore, be clear that EPS, ROE and ROI are the important figures for analysing the impact of financial leverage.
EPS and ROE Calculations
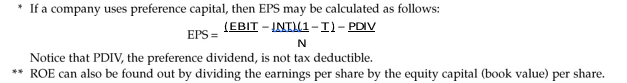
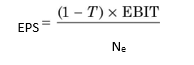
EPS is calculated by dividing profit after taxes, PAT also called net income, NI, by the number of shares outstanding. PAT is found out in two steps. First, the interest on debt, INT, is deducted from the earnings before interest and taxes, EBIT, to obtain the profit before taxes, PBT. Then, taxes are computed on and subtracted from PBT to arrive at the figure of PAT. The formula for calculating EPS is as follows:*
Profit after tax Earnings per share =
Number of shares
![]()
EBIT(1 – T)
where T is the corporate tax rate and N is the number of ordinary shares outstanding. If the firm does not employ any debt, then the formula is:
EPS = (6)
N
ROE is obtained by dividing PAT by equity (E). Thus, the formula for calculating ROE is as follows:**
Profit after tax
Return on equty = Value of equity
(EBIT – INT)(1 – T)
ROE = (7)
E
For calculating ROE either the book value or the market value equity may be used.
How does the financial leverage affect EPS and ROE? We shall describe two situations to illustrate the impact of the financial leverage on EPS and ROE. First, we shall analyse the impact of the alternative financial plans on EPS and ROE assuming that EBIT is constant. Second, we shall assume that EBIT varies and shows the effect of the alternative financial plans on EPS and ROE under the conditions of varying EBIT.
Analysing Alternative Financial Plans: Constant EBIT
Suppose a new firm, Brightways Ltd, is being formed. The management of the firm is expecting a before-tax rate of return of 24 per cent on the estimated total investment of `500,000. This
implies EBIT = `500,000 × 0.24 = `120,000. The firm is considering two alternative financial plans: (i) either to raise the entire funds by issuing 50,000 ordinary shares at `10 per share, or (ii) to raise `250,000 by issuing 25,000 ordinary shares at `10 per share and borrow `250,000 at 15 per cent rate of interest. The tax rate is 50 per cent. What are the effects of the alternative plans for the shareholders’ earnings? Table 12.1 shows calculations.
Table 12.1: Effect of Financial Plan on EPS and ROE: Constant EBIT
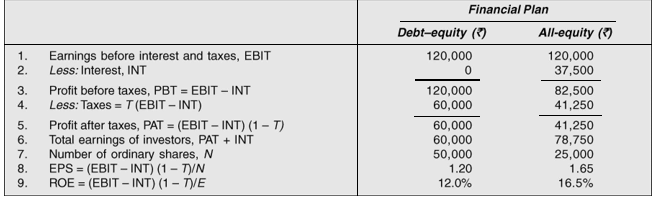
From Table 12.1, we see that the impact of the financial leverage is quite significant when 50 per cent debt (debt of `250,000 to total capital of `500,000) is used to finance the investment. The firm earns `1.65 per share, which is 37.5 per cent more than `1.20 per share earned with no leverage. ROE is also greater by the same percentage.
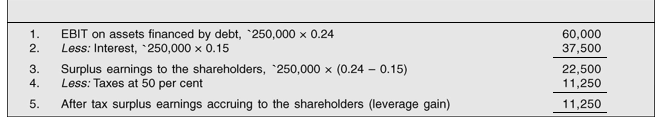
EPS is greater under the debt–equity plan for two reasons. First, under this plan, the firm is able to borrow half of its funds requirements at a cost (15 per cent) lower than its rate of return on total investment (24 per cent). Thus, it pays a 15 per cent (or 7.5 per cent after tax) interest on the debt of `250,000 while earns a return of 24 per cent (or 12 per cent after tax) by investing this amount. The difference of 9 per cent (or 4.5 per cent after tax) accrues to the shareholders as owners of the firm without any corresponding investment. The difference in terms of rupees is `22,500 before taxes and `11,250 after taxes. Thus, the gain from the financial leverage is as shown in Table 12.2.
Second, under the debt–equity plan, the firm has only 25,000 shares as against 50,000 shares under the all-equity plan. Consequently, the after-tax favourable leverage of `11,250 dividend by 25,000 shares increases EPS by `0.45 from `1.20 to `1.65.
Interest Tax Shield
Another important way of explaining the effect of debt is to see the impact of the interest charges on the firm’s tax liability. The interest charges are tax deductible and, therefore, provide tax shield, which increases the earnings of the shareholders. See line 6 in Table 12.1 that compares the total earnings of all investors (shareholders as well debt holders) under two alternative financial plans. The total earnings are more by `18,750 under the debt-equity plan that is exactly the amount of tax saved (i.e. `60,000 – `41,250), on account of the tax deductibility of the interest charges. The interest tax shield under the second financial plan could be directly found out as:
Interest tax shield = Tax rate × Interest
= 0.5 × 37,500 = `18,750 (8)
It is the fact of the tax deductibility of the interest charges, which makes the use of the debt in the capital structure beneficial to a firm.
Instead of following the long procedure discussed in Table 12.1, Equation 5 or 7 can be used to examine the effect of the alternative financial plans on the shareholders’ return. Suppose that the management of the firm in the example is considering a third alternative. They want to use 75 per cent debt and 25 per cent equity to finance the assets. Under this financial plan, for raising equity investment of `125,000, the firm will sell 12,500 shares and pay `56,250 interest on a debt of `375,000 at 15 per cent. EPS and ROE will be as follows:
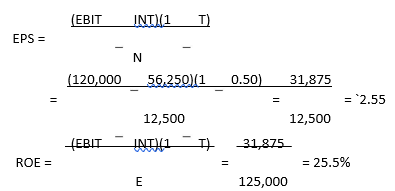
Under the third alternative financial plan of 75 per cent debt, EPS and ROE are more than double as compared with all-equity, no-leverage financial plan.
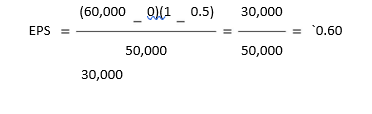
No debt plan
In the example, we assume that the firm earns EBIT of 24 per cent on its investment (or `500,000 × 0.24 = `120,000). Since the firm pays 15 per cent on debt and earns more (24 per cent) on these funds, the effect of leverage is favourable. The more debt the firm uses, the greater is the EPS or ROE. The 24 per cent overall return is an expected figure. Suppose that, for some reason, the firm may not be able to earn 24 per cent before-tax return on its total capital, rather it can earn only 12 per cent return (i.e., EBIT = `60,000). What would be the impact on EPS and ROE? We can use Equations 5 and 7 to calculate EPS and ROE:
![]()
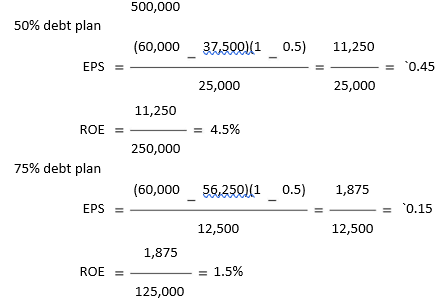
We can see from the calculations above that the effect of financial leverage is unfavourable. EPS and ROE decline as more debt is used. Why is the effect of financial leverage unfavourable? It is unfavourable because the firm’s rate of return on total funds or assets is less than the cost of debt. The firm is paying 15 per cent on debt and earning a return of 12 per cent on funds employed. The shareholders will have to meet the deficit of 3 per cent. As a result, EPS and ROE decline. If the rate of return on assets were just equal to the cost of debt, it can be seen that financial leverage will have no impact on the shareholders’ return. EPS and ROE would be the same under all plans. We are thus led to an important conclusion: The financial leverage will have a favourable impact on EPS and ROE only when the firm’s return on investment (ROI) exceeds the interest cost of debt (i). The impact will be unfavourable if the return on investment is less than the interest cost. It is in this sense that the financial leverage is said to be a double-edged sword.
These conclusions become very clear if we rewrite the formula for ROE. Suppose r is the before-tax return on assets or investment i.e. EBIT divided by V = E + D, and i is the interest rate on debt. Equation 7 can be written as follows:
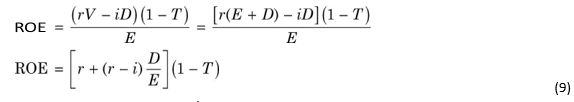
ROE = r(1 – T ) (no leverage) (10)
For an all-equity capital structure firm, D/E will be zero. Therefore, ROE for such firm is simply the after-tax return on assets:
A comparison of Equations (9) and (10) shows that ROE is more by [(r – i) D/E] (1 – T) factor when the firm uses debt. It is also indicated that if the return on assets exceeds the interest rate (r > i), ROE will increase linearly with increase in the financial leverage (viz., D/E). The effect of leverage will depend on both D/E and the spread between the rate of return on assets (r) and interest cost (i). If the return on assets equals the interest rate (r = i), no benefit of the financial leverage will be obtained; that is, (r – i) D/E (1 – T) = 0. The leverage effect will be unfavourable when the return on assets is less than the interest rate (when r < i, then (r – i) D/E (1 – T), would become negative). Equation (8) also shows that for a given level of financial leverage with the interest rate and tax rate being constant, ROE will increase or decline with the increase or decline in the rates of return on assets. The following section illustrates the behaviour of EPS with varying EBIT.
Analysing Alternative Financial Plans: Varying EBIT
In the previous example, we assumed EBIT as constant. In practice, EBIT for any firm is subject to various influences. For example, because of the fluctuations in the economic conditions, sales of a firm change and as a result, EBIT also varies. In a given period, the actual EBIT of the firm may be more or less than anticipated. It is therefore useful to analyze the impact of the financial leverage on EPS (and ROE) for possible fluctuations in EBIT (or r).
EBIT–EPS Analysis
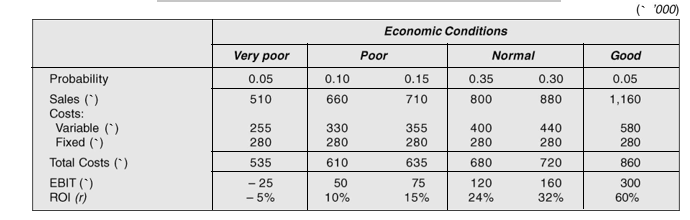
Suppose that Brightways Ltd may face any of the four possible economic conditions: very poor, poor, normal and good. The firm may have a 5 per cent chance of performing very poorly and earning a negative 5 per cent return on its total assets [EBIT = (–0.05) × `500,000 = – `25,000]. If the economic condition is neither very poor nor normal, the firm may be able to manage a return of 10 or 15 per cent. It may have 10 per cent chance of earning 10 per cent return (EBIT = `50,000). Under normal economic conditions, the firm has a 35 per cent chance of earning 24 per cent return (EBIT = `120,000) and a 30 per cent chance of earning 32 per cent return (EBIT = `160,000). If the economic conditions are really favourable, the firm can earn as high as 60 per cent return (EBIT = `300,000). But there is only 5 per cent possibility that the economic conditions will prove to be so good. Brightways’ possible levels of sales and operating expenses with their probability of occurrence are given in Table 12.3.
Table 12.3: Expected Sales, EBIT, ROI with Associated Probabilities
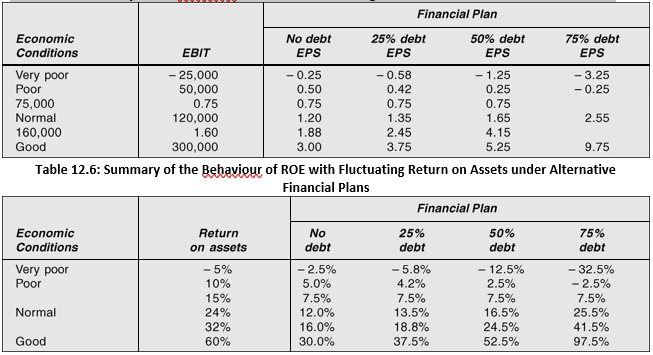
The behaviour of EPS (and ROE) with fluctuating EBIT (or return on assets) under the alternative financial plans is analyzsed in Table 12.4. The summary of the effect of the increasing financial leverage on EPS with changing EBIT (see Tables 12.5
and 12.6) provides interesting insights.
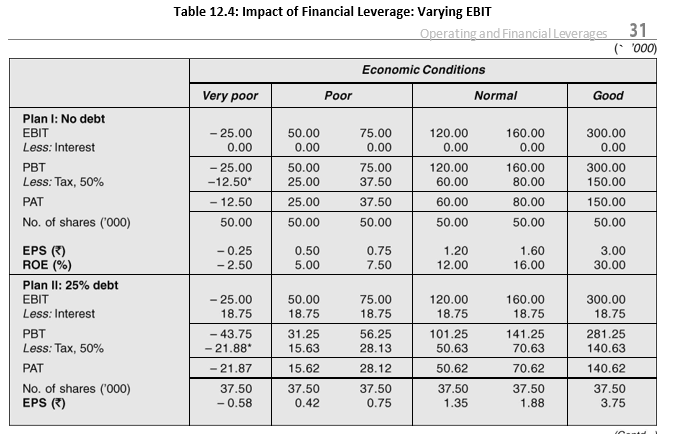
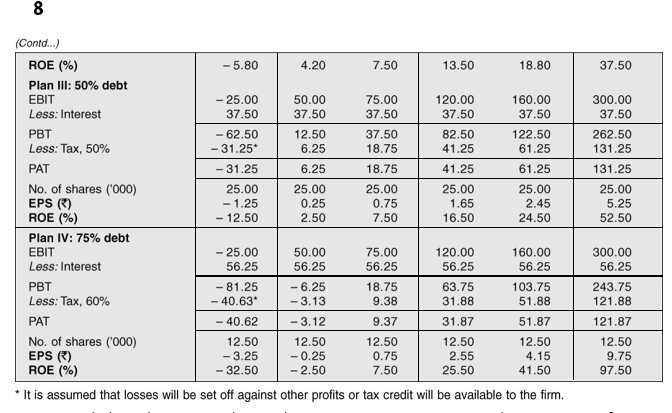
Financial Plan I does not employ any leverage. As EBIT increases, EPS also increases. In fact, EPS increases with improved EBIT under all financial plans (Table 12.5). What is important to note is that as the financial leverage is increased, EPS is further magnified. Take the example of normal and good years. When EBIT increases from `120,000 to `160,000— an increase by 33 per cent, EPS under no financial leverage plan increases proportionately (i.e., by 33 per cent). But EPS increases faster under the high financial leverage plans; it increases by 40 per cent when debt is 25 per cent, by 48 per cent when debt is 50 per cent and by 63 per cent when debt is 75 per cent. Same conclusions can be drawn from Table 12.6 for the behaviour of ROE in relation to return on assets (r). It may be worth repeating that the favourable effect of the increasing financial leverage during normal and good years is on account of the fact that the rates of return on assets
(investment) exceed the cost on debt.
Financial leverage works both ways. It accelerates EPS (and ROE) under favourable economic conditions, but depresses EPS (and ROE) when the procedings are not good for the firm. It can be seen from Tables 12.5 and 12.6 that EPS or ROE is lower with debt in the capital structure in the poor years. With no leverage plan, if the firm’s return on assets is positive, although low, the shareholders do obtain positive EPS or ROE. For example, when the firm’s return (r) is 10 per cent, EPS under no leverage plan is `0.40 (or ROE is 4 per cent). But it becomes lower with more debt used, and even turns negative under very high leverage
Table 12.5: Summary of the Behaviour of EPS with Fluctuating EBIT under Alternative Financial Plans
plan, such as Financial Plan IV. The unfavourable effect on EPS (and ROE) is more severe with more debt in the capital structure when EBIT (or r) is negative.
The reason again lies in the relationship between the return on assets and the cost of debt. If the cost of debt were more than the return on assets, EPS (or ROE) would depress with more leverage. It is indicated from Table 12.5 or Table 12.6 that when the firm earns 15 per cent return on its assets, which is equal to the cost of debt, EPS (or ROE) is the same under all financial plans. Whatever the firm earns on the funds raised through debt is exactly paid to the suppliers of debt as interest charges.
Variability of EPS
EBIT–EPS Chart
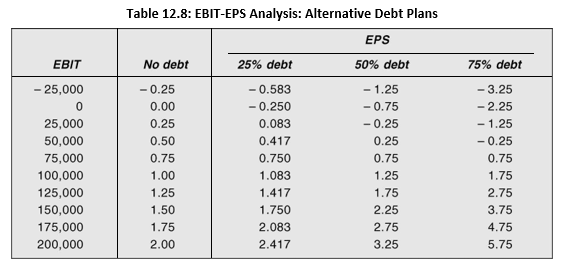
Yet another significant point to be noted from Table 12.5 is that the higher the financial leverage, the wider the range over which EPS varies with fluctuating EBIT. For example, when no debt is used (Financial Plan I), EPS ranges between a negative `0.25 to a positive `3.00—a range of `3.25. Under Financial Plan II, where 25 per cent debt is introduced in the capital structure, EPS ranges from a negative `0.58 to a positive `3.75—a range of `4.33. The range of EPS increases to `6.50 and `13.00 when debt is respectively 50 per cent and 75 per cent. The range for ROE shows the similar behaviour (Table 12.6). Thus, for any given level of variability in EBIT (or r), the increased financial leverage increases the degree of variability in EPS (or ROE). The indiscriminate use of financial leverage without taking into account the uncertainty surrounding EBIT (or r) can lead a firm into financial difficulties. More about the risk of the financial leverage is explained in the next section.
One convenient and useful way of showing the relationship between EBIT and EPS for the alternative financial plans is to prepare the EBIT–EPS chart. The chart is easy to prepare. For each level of EBIT, you calculate EPS under equity and debt equity alternatives. EBIT will be represented on x-axis and EPS on y-axis.
We can use the following information of Financial Plans I and III in our example to draw EBIT–EPS chart in Figure 12.1.
In Figure 12.1, EBIT is shown on a horizontal line and EPS on a vertical line. If we identify any two points of EPS for two given levels of EBIT and join them in a straight line, we obtain EPS-line for a particular financial plan. For example, at EBIT of `50,000 and `75,000, two points of EPS are respectively `0.25 and `0.75 for Financial Plan III. If we join these two points in a straight line, we get EPS-line for Financial Plan III. The EPS-line can be similarly drawn for 100 per cent equity plan. We can see from Figure 12.1 that EPS-lines for all-equity and 50 per cent debt plans intersect at EBIT `75,000. EPS under both plans are
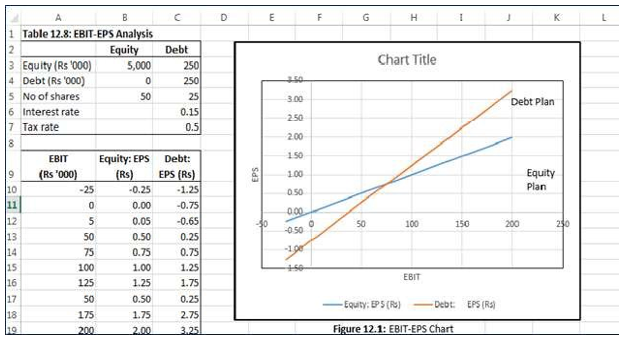
same at this level of EBIT. Figure 12.2, drawn similarly as Figure 12.1, shows four financial plans together.
The line relating EBIT and EPS becomes steeper with more debt in the capital structure, and steeper the line, the more the profit potential to the shareholders with increasing EBIT. If EBIT is declining, the loss to the shareholders will be magnified. The point of intersection of four EBIT–EPS lines in Figure 12.2 indicates the indifference point or the EBIT–EPS break-even point at which EPS is same regardless of the level of the financial leverage. In the example (see Table 12.6), EPS is same for all financial plans when the firm earns a 15 per cent return on assets or EBIT of `75,000.
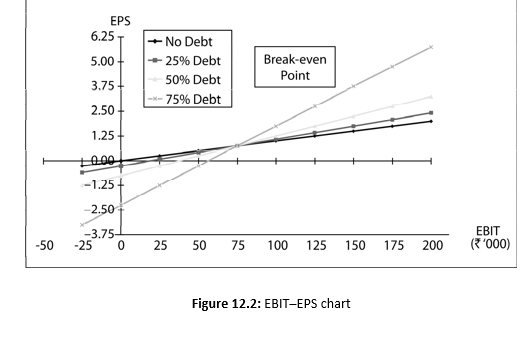
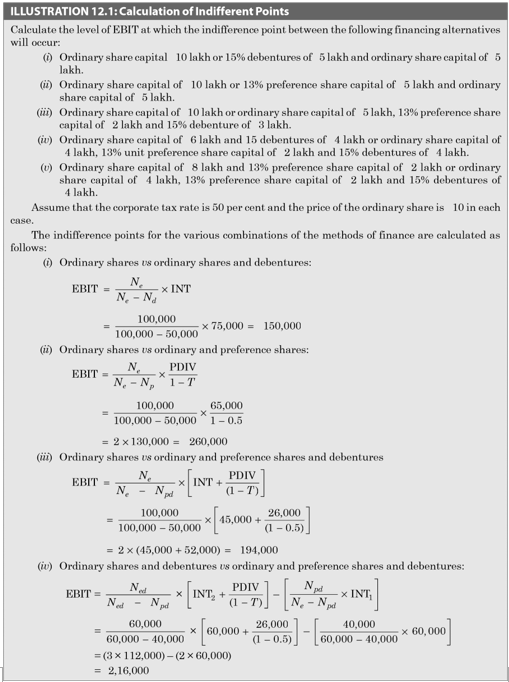
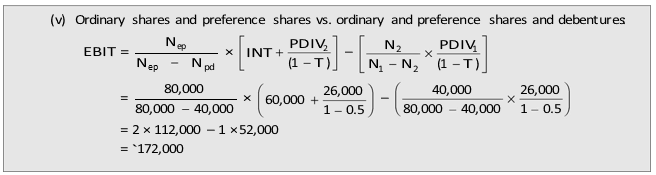
Calculation of Indifference Point
The 15 per cent return on assets is just equal to the cost of debt. It can also be noticed from Figure 12.2 that below the ‘indifference point’ the EBIT–EPS lines shift more towards the right when the level of financial leverage increases, indicating unfavourable effect because of a low rate of return on assets than the interest cost. The EBIT–EPS line shifts more towards the left beyond the ‘indifference point’ when the level of the financial leverage increases. This indicates a favourable effect of leverage because the return on assets exceeds the interest rate. We thus again reach the conclusion that the shareholders will benefit by the use of the financial leverage in terms of the increased EPS if return on assets is higher than the interest cost, and will have reduced EPS if return on assets is lower than the interest cost; the shareholders’ earnings will not be affected by the level of leverage if return on assets is just equal to the interest cost.
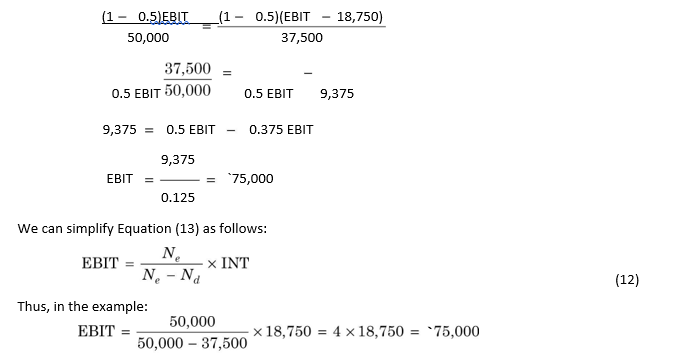
The break-even, or indifference, point between two alternative methods of financing can be determined by a formula. In the earlier example, suppose the firm is considering only two financial plans—an all-equity plan (Financial Plan I) and a 25 per cent debt and 75 per cent equity plan (Financial Plan II). The firm wants to know the level of EBIT at which EPS would be the same under both the plans. To find out the break-even level of EBIT, we may set the EPS formulae of two plans equal. The EPS formula under all-equity plan is
where Ne is number of ordinary shares under the equity plan and since the firm has no debt, no interest charges exist. The EPS formula under debt–equity plan is:
 11
11
Using the values for Financial Plans I and II given in the example, we can determine EBIT as follows:
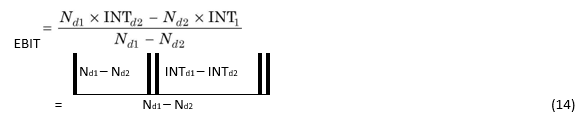
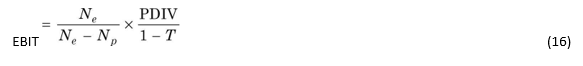
Sometimes a firm may like to make a choice between two levels of debt. Then, the indifference point formula will be:
![]()
where INT1 and INT2 represent the interest charges under the alternative financial plans. After simplifying Equation (13), we obtain:
Equation (17) can be simplified as follows:
COMBINING FINANCIAL AND OPERATING LEVERAGES
Operating leverage affects a firm’s operating profit (EBIT), while financial leverage affects profit after tax or the earnings per share. The combined effect of two leverages can be quite significant for the earnings available to ordinary shareholders.
Degree of Operating Leverage
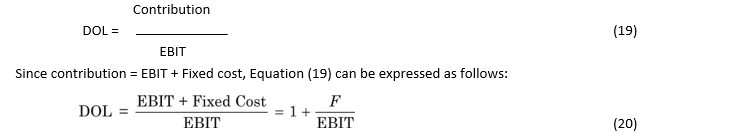
The degree of operating leverage (DOL) is defined as the percentage change in the earnings before interest and taxes relative to a given percentage change in sales. Thus:
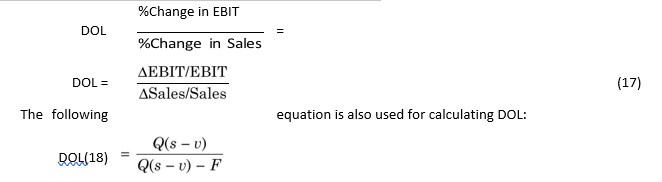
where Q is the units of output, s is the unit selling price, v is the unit variable cost and F is the total fixed costs. Equation (18) can also be written as follows:
Suppose that in the earlier example of Brightways Ltd the management had developed the following income statement based on an expected sales volume of 100,000 units:
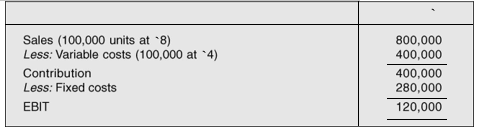
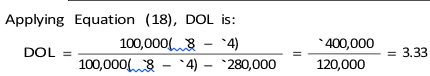
DOL of 3.33 implies that for a given change in Brightways’ sales, EBIT will change by
3.33 times.
Let us suppose in the case of Brightways that a technical expert appointed by the management tells them that they can choose a more automated production processes which will reduce unit variable cost to `2 but will increase fixed costs to `480,000. If the management accepts the expert’s advice, then the income statement will look as follows:
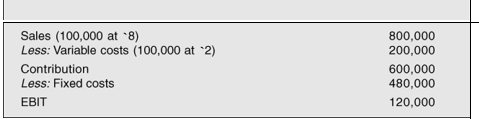
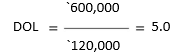
With high fixed costs and low variable costs, DOL for Brightways will be:
Degree of Financial Leverage
If Brightways Ltd chooses the high-automated technology and if its actual sales happen to be more than expected, its EBIT will increase greatly; an increase of 100 per cent in sales will lead to a 500 per cent increase in EBIT.
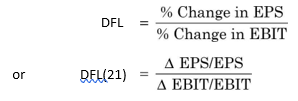
We have seen earlier in this chapter that financial leverage affects the earnings per share. When the economic conditions are good and the firm’s EBIT is increasing, its EPS increases faster with more debt in the capital structure. The degree of financial leverage (DFL) is defined as the percentage change in EPS due to a given percentage change in EBIT:
In the case of Brightways Ltd, when EBIT increases from `120,000 to `160,000, EPS increases from `1.65 to `2.45, when it employs 50 per cent debt and pays interest charges of `37,500 (see Table 12.5). Applying Equation (21), DFL at EBIT of `120,000 is:
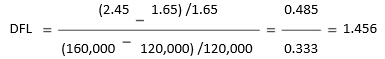
This implies that for a given change in EBIT, EPS will change by 1.456 times. The following equation can also be used to calculate DFL:
![]()
We know that EBIT = Q (p – v) – F (and EBIT – INT = PBT). Thus Equation (22) can also be written as follows:
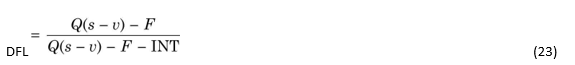
The numerator of Equation (22) or (23) is earnings before interest and taxes and the denominator is profit before taxes.
In the example, Brightways Ltd was considering four alternative debt levels (see Table 12.4). Applying Equation (22), DFL for those alternatives at EBIT of `120,000 is given below:
Table 12.8: Degree of Financial Leverage of Alternative Financial Plans at EBIT of `120,000
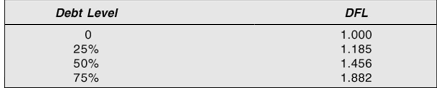
It is indicated from Table 12.8 that if the firm does not employ any debt, EPS will increase at the same rate at which EBIT increases. EPS increases faster for a given increase in EBIT when debt is introduced in the capital structure; more the debt in the capital structure, the greater the increase in EPS. The opposite will happen if EBIT declines—the greater will be the fall in EPS with more debt in the capital structure.
Combined Effect of Operating and Financial Leverages
Operating and financial leverages together cause wide fluctuation in EPS for a given change in sales. If a company employs a high level of operating and financial leverage, even a small change in the level of sales will have dramatic effect on EPS. A company with cyclical sales will have a fluctuating EPS; but the swings in EPS will be more pronounced if the company also uses a high amount of operating and financial leverage.
The degrees of operating and financial leverages can be combined to see the effect of total leverage on EPS associated with a given change in sales. The degree of combined leverage (DCL) is given by the following equation:
![]()
Yet another way of expressing the degree of combined leverage is as follows:

Since Q (s – v) is contribution and Q (s – v) – F – INT is the profit after interest but before taxes, Equation (25) can also be written as follows:
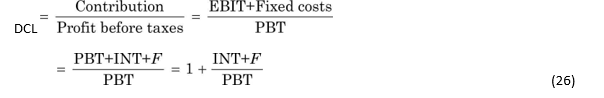
For Brightways Ltd, when it used less automated production processes, the combined leverage effect at a sales of `8 lakh (100,000 units at `8) and 50 per cent debt level is:
In the case of Brightways Ltd, the combined effect of leverage is to increase EPS by 4.85 times for one unit increase in sales when it chooses less automated production process and employs 50 per cent debt. Thus, if the Brightways’ sales increase by 10 per cent from `8 lakh to `8.80 lakh, then EPS will increase by: 10% × 4.85 = 48.5%. EPS at the sales level of `8 lakh is `1.65 then the new EPS will be:
![]()
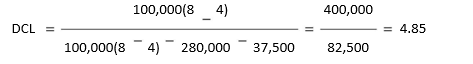
Firms can employ operating and financial leverages in various combinations. Brightways Ltd, for example, can either choose high-automated production processes and high degree of operating leverages or low automated production processes and low degree of operating leverage associated with high or low level of debt. The following are the possible combinations of operating and financial leverages for Brightways Ltd:
The results tally with those worked out in Table 12.4.
Table 12.9: Combinations of Operating and Financial Leverage for Brightways Ltd
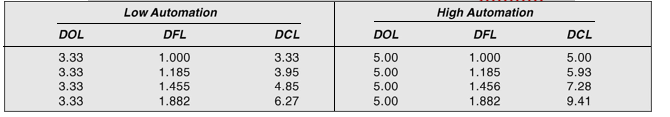
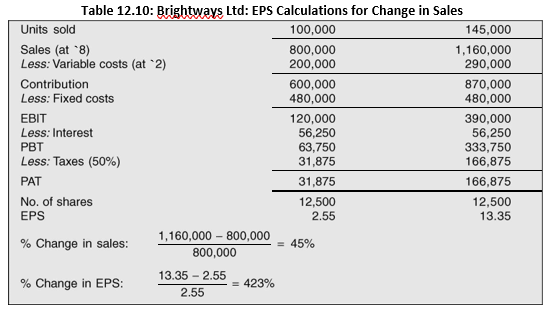
Table 12.9 indicates that the largest effect of leverage (9.41 times) will be obtained when the firm combines higher amount of operating leverage (5.00 times) with the highest level of debt (DFL = 1.882). If the company has this combination, EPS will increase by 9.41 times than the increase in sales. Thus, if Brightways’ sales increase from `8 lakh to `11.60 lakh—an increase of 45 per cent and EPS increases from `2.55 to `13.35—an increase by 423 per cent (i.e., 45 per cent × 9.41). Detailed calculations are given in Table 12.10.
Check Your Concepts
This combination can, however, prove risky for the company. If sales decline, the adverse effect on EPS will be very severe. The right combination of operating and financial leverages will differ among companies. It would generally be governed by the behaviour of sales. Public utilities such as electricity companies can afford to combine high operating leverage with high financial leverage since they generally have stable or rising sales. A company whose sales fluctuate widely and erratically should avoid use of high leverage since it will be exposed to a very high degree of risk.
- Define operating leverage.
- How do you measure the degree of operating, financial and combined leverage?3. What are the implications of operating, financial and combined leverage for risk.
FINANCIAL LEVERAGE AND THE SHAREHOLDERS’ RISK
We have seen that financial leverage magnifies the shareholders’ earnings. We also find that the variability of EBIT causes EPS to fluctuate within wider ranges with debt in the capital structure. That is, with more debt, EPS rises and falls faster than the rise and fall in EBIT. Thus, financial leverage not only magnifies EPS but also increases its variability.
The variability of EBIT and EPS distinguish between two types of risk—operating risk and financial risk. The distinction between operating and financial risk was long ago recognized by Marshall in the following words:6
… Let us suppose that two men are carrying on similar business, the one working with his own, the other chiefly with borrowed, capital. There is one set of risks common to both, which may be described as the trade risk of the particular business in which they are engaged…. But there is another set of risks, the burden of which has to be borne by the man working with borrowed capital, and not by another.
Operating Risk
Operating risk can be defined as the variability of EBIT (or return on assets). The environment—internal and external—in which a firm operates, determines the variability of EBIT. So long as the environment is given to the firm, operating risk is an unavoidable risk. A firm is better placed to face such risk if it can predict it with a fair degree of accuracy.
The variability of EBIT has two components:7 variability of sales variability of expenses
Variability of Sales
Variability of Expenses
The variability of sales revenue is in fact a major determinant of operating risk. Sales of a company may fluctuate because of three reasons. First, the changes in general economic conditions may affect the level of business activity. Business cycle is an economic phenomenon, which affects sales of all companies. Second, certain events affect sales of companies belonging to a particular industry. For example, the general economic conditions may be good but a particular industry may be hit by recession. Other factors may include the availability of raw materials, technological changes, actions of competitors, industrial relations, shifts in consumer preferences and so on. Third, sales may also be affected by the factors, which are internal to the company. The change in management, the product-market decisions of the company and its investment policy, or strike in the company have a great influence on the company’s sales.
Given the variability of sales, the variability of EBIT is further affected by the composition of fixed and variable expenses. Higher the proportion of fixed expenses relative to variable expenses, higher the degree of operating leverage. We have seen in the previous section that operating leverage affects EBIT. High operating leverage leads to faster increase in EBIT when sales are rising. In bad times when sales are falling, high operating leverage becomes a nuisance; EBIT declines at a greater rate than fall in sales. Operating leverage causes wide fluctuations in EBIT with varying sales. Operating expenses may also vary on account of changes in input prices, and may also contribute to the variability of EBIT.
Financial Risk
For a given degree of variability of EBIT, the variability of EPS (and ROE) increases with more financial leverage. The variability of EPS caused by the use of financial leverage is called financial risk. Firms exposed to same degree of operating risk can differ with respect to financial risk when they finance their assets differently. A totally equity financed firm will have no financial risk. But when debt is used, the firm adds financial risk. Financial risk is thus an avoidable risk if the firm decides not to use any debt in its capital structure.
Summary
The debt–equity mix of a firm is called its capital structure. The term financial structure, on the other hand, is used in a broader sense, and it includes equity and all liabilities of the firm.
The capital structure decision is a significant financial decision since it affects the shareholders’ return and risk, and consequently, the market value of shares.
The use of the fixedcharges capital, like debt with equity capital, in the capital structure is described as financial leverage or trading on equity. The main reason for using financial leverage is to increase the shareholders’ return. Consider an example:
Suppose you have an opportunity of earning 20 per cent on an investment of `100 for one year. If you invest your own money, your return will be 20 per cent. On the other hand, you can borrow, say, `50 at 10 per cent rate of interest from your friend and put your own money worth `50. You shall get total earnings of `20, out of which you will have to pay `5 as interest to your friend. You shall be left with `15 on your investment of `50, which gives you a return of 30 per cent. You have earned more at the cost of your friend. A firm determines the advantage of financial leverage by calculating its impact on earnings per share (EPS) or return on equity (ROE). For a 100 per cent equityfinanced company, EPS is calculated as follows:
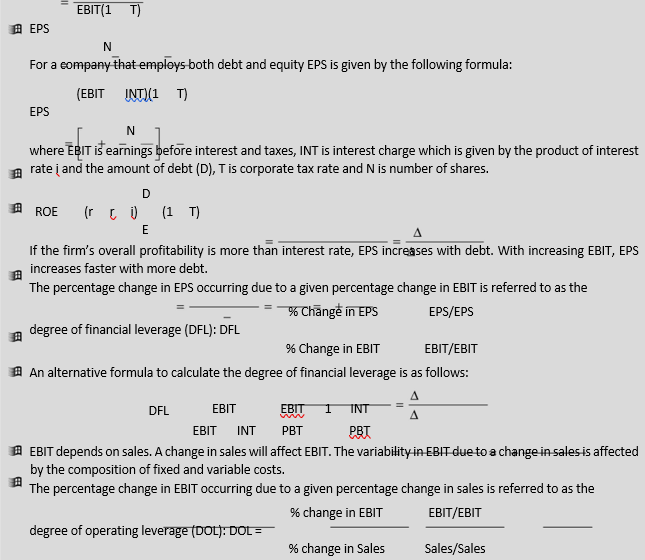
An alternative formula for calculating DOL is as follows: DOL Contribution 1 Fixed Cost
EBIT EBIT
DOL and DFL can be combined to see the effect of total leverage on EPS. The degree of combined leverage (DCL) is given as follows:
DCL = DOL × DFL = % Change in EPS ; DCL = Contribution = Contribution = 1 + INT + F
% Change in sales EBIT – INT PBT PBT
| Financial leverage, on the one hand, increases shareholders’ return and on the other, it also increases their risk. For a given level of EBIT, EPS varies more with more debt. Consider a simple example: Let us assume that a firm’s expected EBIT is `120 with a standard deviation of `63. This implies that earnings could vary between `57 to `183 on an average. Suppose that the firm has some debt on which it pays `40 as interest. Now the shareholders’ expected earnings will be: `120 – `40 = `80 (ignoring taxes) and standard deviation will remain unchanged. Shareholders’ earnings will, on an average, fluctuate within a range of `17 and `143. If EBIT is less than `40, the earnings of shareholders will be negative. In the extreme situation if the firm is unable to pay interest and principal, its solvency is threatened. |
Review Questions
- Explain the concept of financial leverage. Show the impact of financial leverage on the earnings per share.
- Does financial leverage always increase the earnings per share? Illustrate your answer.
- What is financial risk? How does differ from business risk? How does the use of financial leverage result in increased financial risk?
- If the use of financial leverage magnifies the earnings per share under favourable economic conditions, why do companies not employ very large amount of debt in their capital structures?
- What is an EBIT–EPS analysis? Illustrate your answer.
- What is an indifference point in the EBIT–EPS analysis? How would you compute it?
- Explain the merits and demerits of the various measures of financial leverage.
- Define operating and financial leverage. How can you measure the degree of operating and financial leverage? Illustrate with an example.
- What is the degree of combined leverage? What do you think is the appropriate combination of operating and financial leverage?
Quiz Exercises
- A firm has to choose between two capital structures: either ordinary share capital `10 crore (`100 per share) or 15% debentures of `5 crore and ordinary share capital of `5 crore. Assume that the corporate tax rate is 40 per cent. Calculate EBIT at which the plans give same EPS.
- Firm Q wants to choose between two financing plans. Plan I: ordinary share capital `8 crore (`100 per share) and 15% debentures of `2 crore. Plan II: ordinary share capital of `5 crore (`100 per share) and 15% debentures of `2 crore. Assume that the corporate tax rate is 30 per cent. Calculate EBIT at which plans give same EPS.
- Firm X has sales of `360 crore, variable cost of `90 crore and fixed cost of `180 crore. Firm Y has sales of `300 crore, variable cost of `150 crore and fixed cost of `75 crore. Calculate (a) profit to sales ratio, (b) break-even point, and (c) the degree of operating leverage for both firms. Comment
on the positions of the firms. If sales increase by 20 per cent what shall be the impact on the profitability of the two firms?
- Firm Z has EBIT of `1200 lakh, PBT of `480 lakh and fixed costs of `600 lakh. What is the percentage change in EPS if sales increase by 5 per cent?
- A firm has EBIT of `300 lakh, contribution margin of `600 lakh and interest of `100 lakh. Calculate the percentage change in EPS if sales decline by 5 per cent.
- The expected earnings of firms U and L are `120 crore with a standard deviation of `30 crore. Firm U is non-levered. Firm L is levered and has to pay annual interest charges of `30 crore. Which firm is more risky? Why?