
MEANING AND IMPORTANCE OF COMPETITION
‘Competition’ is one of those simple words which are common in everyday speech and which we all assume we understand but which, when we really try and explain, start to present difficult problems. Ask yourself what benefits you think you get from competition as a consumer. Suppose you think in terms of being able to buy from different suppliers, of being able to choose from a variety of different but broadly similar goods – for example choosing shoes of different styles, sizes, quality and price ranges – and perhaps of having some power as a consumer to bargain over price, or knowing that some suppliers will charge lower prices than others. Notice that the word that recurs constantly when most of us think about competition is choice. You and I, as consumers, value the ability to choose between a range of goods, different prices and different standards of quality and service.
Because of the buyers’ ability to choose and apply pressure on prices, we expect competition to oblige producers and distributors to use their resources efficiently and keep production and distribution costs low. Competition is usually thought to be a very powerful force to ensure production efficiency.
Competition is thus widely believed to be a desirable feature of markets. Most of the major modern market economies have legislation and institutions concerned with preserving or increasing competition.
Economists have generally been in favour of competition as a force likely to increase the efficient use of scarce resources, and they have developed a concept of perfect competition which we shall examine in this study unit. More recently, however, they have recognised that traditional views of competition have limitations and that the pressures on business firms are more complex than have sometimes been believed in the past. There is also a recognition that increased competition can sometimes have consequences that are not beneficial to consumers or which are not socially very desirable.
For example, competing firms are likely to seek to attract the largest number of buyers and may do this by providing those goods and services for which there is the greatest demand. Consequently, consider the following possibilities:
- Four or five multiple stores all offering similar styles and sizes of children’s clothes, with little to offer buyers wanting different styles or the less common sizes.
- Rival buses, some nearly empty, jockeying for custom in the streets of populous cities but little or no transport to outlying rural areas.
- Twelve or more insurance offices all offering cut-price insurance but with policies containing conditions that are likely to allow the companies to avoid meeting claims for losses that policy holders thought had been fully covered.
These examples – and you can probably think of others – suggest that competition can lead to less genuine choice for consumers or can lead to a reduction in the quality of services provided. This quality reduction can be very damaging in the financial services sector: competitive banking does not appear to have improved relationships between the major banks and their customers.
We must, therefore, be careful in our assessment of the benefits of competition and be prepared to be critical when examining some of the traditional economic models of competitive markets. These models have been developed in the belief that the degree of competition in a market is likely to influence the behaviour and performance of firms operating in it. In this study unit we look at some of the best known models, and these provide an essential starting point for understanding the often complex markets existing in modern economies.
PERFECT COMPETITION
Definition
Our first theoretical model covers the situation where the economic market operates in its purest or most perfect form. Perfect competition is the state of affairs existing in a market totally free from imperfections in the communication and interaction of the economic forces of supply and demand.
Some writers like to make a distinction between perfect or ideal markets and perfect competition, in addition to the distinction between the market as an area and competition as a condition found in that area. They suggest that the conditions for perfect competition are satisfied when the individual firm is a “price-taker”, i.e. when it can sell all that it can produce at the market price, which by itself it cannot alter, and when buyers are indifferent as to which seller’s product they buy at that price. Such a very limited set of requirements would be satisfied when firms in an industry were subject to a regulated price set by a government or some other regulatory body which had powers to buy goods un-saleable in the market. This would certainly not be a perfect market.
For true perfect competition to exist, it seems more realistic to stipulate that sellers must be free to enter and leave the market, so that total supply can change and bring about the equilibrium position. Just to establish a market price through some form of price regulation would not produce the same result, unless the regulating body is very sensitive to demand shifts, and production plans can be adapted quickly.
It seems, then, that full operation of perfect competition can be achieved only in a perfect economic market, and to put too much emphasis on differences between the two does not really help very much in our analysis of the main market forces.
Conditions for Perfect Competition These can be summarised as follows:
Goods Must Be Homogeneous
This means that, in the perception of the buyer, all units of the goods offered by all suppliers are equally acceptable. The buyer is indifferent as to which unit he receives, as long as it conforms to any description adopted by, and understood in, the market.
Notice that it is the perception of the buyer that is important. Suppose two large retail stores make an arrangement with a manufacturer to be supplied with canned coffee in plain tins. The manufacturer supplies coffee of the same type and quality to each retailer in the plain cans quite impartially. However, each store adds its own label to the cans and sells the coffee under completely different brand names and at slightly different prices. The products are physically the same, but they are not homogeneous, because the public perceives them as different and competing products.
Perfect Transport and Communications
All consumers in the market must have the same information. Suppliers must have access to the same information about production factors and the technical conditions of production. No producer is in a more favoured situation than any other.
Price Established Only by Market Forces
No producer and no buyer is able to influence the price by his own actions, nor by actions agreed with other producers or buyers. There is no degree of monopoly power in the market.
Economic Motives Only
The actions of suppliers and buyers are influenced only by economic motives. If buyers or sellers are influenced by a desire to support a charity or a political party the market will not be purely economic, however worthy the social motives.
Economic rationality in a market economy assumes an underlying self-interest and a desire to maximise benefits that can be gained from available scarce resources. For the consumer this means maximising utility, as defined in Study Unit 2, while for producers it is usually interpreted as wishing to maximise profit – an objective examined later.
No Barriers Limiting Market Entry and Exit
Suppliers and buyers must be free to enter and leave the market as they choose and as they are guided by considerations of profit and utility. This is a very important element in any competitive market and in some modern models of market behaviour, notably that of contestable markets, it is the most important consideration.
Barriers to market entry and exit may be “natural”, i.e. arising out of the nature of the goods or the production process, or “artificial”, i.e. arising out of market regulations.
Natural barriers are highest when production requires large amounts of highly specialised capital, e.g. oil exploration and extraction or motor vehicle assembly. Only firms with access to very large amounts of finance can enter these markets and, once this capital has been acquired, the firms are committed to staying in the market, since exit would usually involve very large financial losses. Natural barriers are low when little specialised capital or skill is needed to commence production.
When natural barriers are low, established producers may seek to protect themselves from new entry by building artificial barriers, such as membership of a trade or professional association, entry to which may require a long period of apprenticeship or education or high membership fees. It is not unknown for established traders to prevent new entry illegally by the use of force.
The lower the barriers, both natural and artificial, the more contestable the market, and the theory of contestable markets suggests that contestability is a powerful force determining the behaviour of suppliers in a market. If producers know that they can easily be challenged by new competitors they will behave as if they were subject to competition because they will not wish to provide incentives for new firms to come into the market. Such incentives would include supernormal profit or the existence of buyers who were dissatisfied with existing goods, standards of service or prices.
Consequently we would expect a perfectly contestable market to exhibit most if not all the characteristics of perfect competition.
Movement towards Equilibrium in Perfectly Competitive Markets
We can now examine the behaviour of firms operating under conditions of perfect competition.
If we assume that the firm is experiencing diminishing marginal returns and can sell all it can produce at the market price, over which it has no control, then it will have average and marginal cost curves and an average revenue curve as shown in Figure 7.1. Since all units of the good are sold at the same price whatever the firm’s sales level, price will equal average revenue and will also be the same as marginal revenue.
Suppose the price resulting from the interaction of supply and demand in the market as a whole is Op; then there is no level of output at which the firm can produce at a profit.
At all levels of output price, average revenue is below the average cost curve. However, the profit-maximising condition of marginal cost = marginal revenue is also the loss-minimising condition, so the best output for the firm to choose is at Oq where marginal cost equals marginal revenue. At this output level, average cost at Oc is higher than average revenue at Op, so the firm suffers a loss equal to the shaded area cdbp.
Given the conditions for perfect competition, if this is the situation faced by one firm, it is the situation of all firms subject to the same market information and technology. Firms cannot continue indefinitely suffering losses. Some will withdraw from the market (remember that unrestricted entry and exit is another condition of this market) because they are less able to withstand losses or they have other markets they can enter.
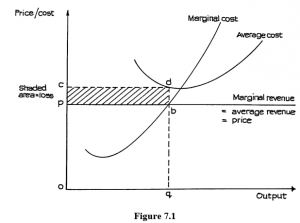
Figure 7.1
As supply declines, the total market supply curve moves to the left, as shown in Figure 7.2.
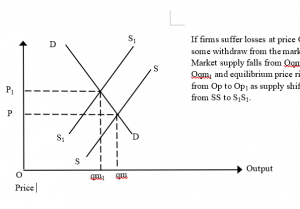
Figure 7.2
The market equilibrium price then rises – assuming that demand remains unchanged. Supposing the equilibrium price moves up from Op to Op1, this produces the situation for the individual
Fig 7.3
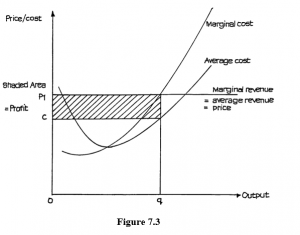
Figure 7.3
Now we see that the average revenue at Op1 is higher than average cost at Oc, and the firm is enjoying profits, represented by the shaded area. Notice that, once again, the most profitable output to aim at is at Oq, where marginal cost is just equal to marginal revenue.
Now, given our earlier assumptions, all firms are making profits. If we have defined cost to include a normal return to all production factors (including some return to enterprise in the form of a minimum profit to keep firms in the market and provide necessary capital investment) then this shaded area profit is an additional or abnormal profit, resulting only from the special market opportunities.
Owing to perfect communication and free entry, new firms will enter the market to take advantage of these profits. Supply will now increase – the supply curve will move to the right and equilibrium price will fall.
Suppose it falls to a position between Op and Op1, say to Ope where price/average revenue is just equal to average cost. Now the individual firm is in the position illustrated in Figure 7.4. Here, there is neither abnormal profit nor loss. We assume that the firm’s costs include an element of normal profit, which can be defined as a fair return to the firm’s enterprise, or sometimes as that amount of profit which is sufficient to keep firms operating in that market. This normal profit is included, therefore, in the average cost curve. There is no incentive for firms to move into or out of the market; there is no reason why supply should shift – and, as long as demand remains unchanged, there is no reason for any movement in this equilibrium balance.
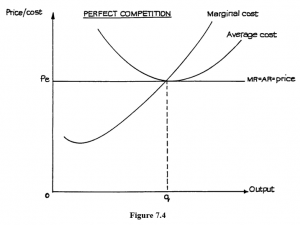
Figure 7.4
It is on the basis of this kind of argument that textbooks and examiners sometimes make much of the distinction between short-run equilibrium in perfect competition where abnormal profits or losses can be experienced, and long-run equilibrium where only “normal” profits (included in the average total cost curve) are possible. However, we should stress that these are really only partial equilibrium positions relating to supply alone. The model says nothing about influences on demand which is often far from stable. A shift in demand will be quickly reflected in a shift in supply to readjust output to the new market price. Consequently, in markets where demand is inherently unstable – as in the Stock and Commodity Exchanges – long-run equilibrium may never be reached as suppliers are constantly adapting to the shifting market environment.
Views on Perfect Competition
Economists often favour perfect competition on the following grounds:
- The elimination of abnormal profit, as shown in Figure 7.4.
- Efficient use of resources. Notice that, in equilibrium, the bringing together of price and marginal cost and the elimination of abnormal profit means that producers will produce when the average cost curve is at its lowest point (where marginal cost equals average cost). There is then a tendency to encourage producers to reduce average costs as much as possible. This is equivalent to making the most efficient use of resources.
- Price is equal to marginal cost. Price is the money value of the utility gained by the last or marginal consumer, i.e. marginal utility. When marginal cost = marginal utility, as in perfect competition, the cost of producing the last unit is just equal to the value of the utility given by that unit to its consumer. If this were true in all cases, then the total cost of production would equal the total value of utility received. This would be the best possible use of all resources, it is suggested.
Not everyone accepts these arguments, and you should read this section in conjunction with the discussion of monopoly, later.
One of the arguments against perfect competition is that it prevents producers from making the profit necessary to provide funds for investment and research, to find better ways of producing goods. Another argument is that competition can be wasteful, as resources are doing the same things. If there were fewer competing firms, total costs could be reduced and some resources freed to produce something else.
Firms dislike perfect competition because, as indicated earlier, prices are unstable. If communications are good, then supply can adapt very quickly to price changes caused by changes in demand. The result is that prices are constantly adapting to new equilibrium positions – as with the Stock Exchange, which is still the common textbook example of a market which is close to perfect competition. In the Stock Exchange, prices change daily, and even hourly.
Manufacturers cannot tolerate swiftly-moving prices like this – they could survive in such a market only if they could keep changing the prices paid for production factors, including the wages paid to workers. Trade unions have sought to achieve stable jobs – and, preferably, rising wages. Producers then want stable – and, preferably, rising – prices. Those economists who argue for perfect competition in the consumer interest, and then for stable wages and secure employment, are being illogical. These two conditions cannot exist together.
Perfect competition may or may not, therefore, be ideal from a purely economic viewpoint. It is certainly far from ideal from a social standpoint.
Profit Maximisation as a Result of Perfect Competition
Notice that the only output enabling the firm to survive in the equilibrium condition illustrated in Figure 7.4 is where marginal cost equals marginal revenue. The removal of abnormal profit ensures that the average cost curve is at a tangent to the average revenue curve, and as this is horizontal, then the average cost curve must be at a tangent at its lowest point, i.e. where average cost equals marginal cost.
This is what is meant by saying profit maximisation is a survival condition resulting from perfect competition. Only by achieving this profit-maximising output can the individual firm avoid losses. Whether it achieves this intentionally or by trial and error does not matter; failure to achieve it means eventual failure to exist in the market.
MONOPOLY
Definition
Monopoly is the opposite extreme to perfect competition. It exists when there is only one supplier for a particular product and there are no close substitutes for that product.
Again, we have to be careful how we define the product. Historically almost all monopolies are subject to destruction by the onward march of technology.
Sources of Monopoly
Monopoly can arise in three ways: by operation of the law, by possession of a unique feature, or by the achievement of market control.
Operation of Law
This is a very old source of monopoly power. Kings used to sell monopolies in Europe to raise money, i.e. they sold people the right to be sole suppliers of a necessary product, such as salt, in a given area. The monopolist could rely on the support of the King’s officers to protect his monopoly and the profits he could make more than covered the fee he had to pay for his position.
Today, some countries may grant a company the right to be sole supplier of a product or service in return for some measure of State inspection and control over profits and prices. Some important public utilities, e.g. Electrogaz, are legally companies in the private sector but are subject to government influence as a shareholder, and regulation by separate bodies. Note Electrogaz has been taken back into Government “owenership” and is EWSA
A more limited monopoly power is granted under patent and copyright laws, which are similar in most countries. The idea of a patent is that the inventor of a new idea shares his knowledge with the State for the public benefit, in return for a monopoly control over the use of his idea for a limited number of years. If rival suppliers are unable to develop a competing product without breaking the patent, this form of monopoly can be very valuable – take, for example, the monopoly enjoyed for some years by the Polaroid instant film-developing process.
Possession of a Unique Feature
Individuals have monopoly control over the supply of their own skills, and this may be a source of considerable profit. The top footballers, tennis players and entertainers are monopolists of this type. When the skill lies in producing something written or recorded, then the monopoly position is protected by copyright laws – which modern technology has made more difficult to enforce, however.
Market Control
It is difficult to achieve total monopoly over supply without the protection of the law, although it is not unknown – especially in the production of some intermediate products. For a number of years, all the valves for pneumatic tyres on motor vehicles were produced by one manufacturer. Such a monopoly rarely lasts very long. When a large rival decides to challenge the monopolist, there is little that can be done to prevent this.
The Monopoly Model
The model has been developed to explain the outcome of a monopoly not subject to any special legal protection or control. It assumes that the firm is pursuing a profit-maximising objective, and that it is able to make abnormal profits.
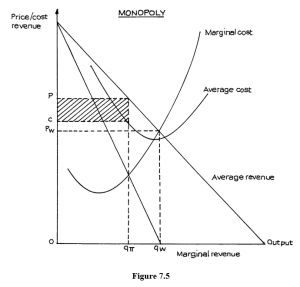
Figure 7.5
A monopolist’s output is the total market supply, and the demand for its product is the total market demand. The firm will thus face a downward-sloping demand curve. If we assume that it is not practising price discrimination, then this curve will be the price/average revenue curve. The graphical model is shown in Figure 7.5.
The profit-maximising monopolist will produce at output Oqπ, where marginal cost equals marginal revenue, and will charge price Op. Abnormal profit is represented by the shaded area. Oc is the average cost, so Op − Oc is the average profit earned on each unit of product sold.
If the firm were to set price to equal marginal cost, which is the position desirable from the consumer viewpoint, it would produce output Oqw and charge the lower price Opw. This is why the profit-maximising monopolist is said to restrict output and increase price in comparison with a firm operating in a competitive market.
Comment
There is much evidence that large firms with considerable market power may not maximise profits but may pursue quite different objectives, such as growth or sales revenue maximisation. The average cost curve was drawn on the basis that abnormal profit was being made. There is nothing in the model itself that says that the average cost curve must be this shape and in this position. We can move it up or down without affecting the other curves, and so alter the profit quite legitimately.
In short, the model proves nothing. It simply illustrates the assumptions made. Notice that, if we drop the profit-maximising requirement, we can allow the firm to increase output and reduce price, and so come closer to the consumer-benefiting output level of Oqw. This would also reduce average cost and allow the firm to make more efficient use of its resources.
In answer to the charge that monopoly is against the public interest because it restricts output and raises price, the following arguments can be put forward:
- The monopolist’ size and ability to produce for the whole market enables it to achieve economies of scale, so that costs are actually lower than they would be under perfect competition.
- The monopolist employs professional managers who make more efficient use of available resources than small owner/managers, who often lack managerial skill.
- The monopolist does not maximise profits but is content with just a satisfactory level of profit.
- Some element of abnormal or monopoly profit (normal profit is considered to be included in the firm’s costs as for perfect competition) is desirable, so that the firm:
- can spend money on research and gather funds for further capital investment;
- has the incentive to take risks and innovate and sometimes suffer losses that would cripple smaller firms.
The position where a monopolist is actually able to charge lower prices than would be possible under perfect competition is illustrated in Figure 7.6. Here, for simplicity, constant average total costs have been assumed and the monopolist’s cost curve is below that of small firms by reason of economies of scale and improved technology. Assuming that the monopolist seeks to maximise profits, the appropriate price will be Pm, still higher than the perfectly competitive price of Pc. However, this could be reduced if the monopolist had some other objective such as maximising growth or revenue. The revenue-maximising price (Pr), i.e. the price applicable to producing at the quantity level where marginal revenue is 0, and therefore total revenue is at its maximum, is lower than the perfectly competitive price of Pc. Notice that, unlike the firm under perfect competition, the monopolist can charge a range of prices, depending upon the firm’s objectives, and still make a profit.
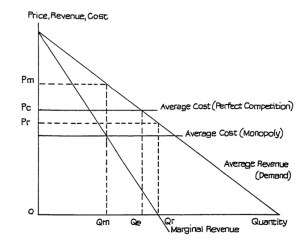
Figure 7.6: Price and Output Under Perfect Competition and Monopoly
The argument really boils down to a question of performance. Does the monopolist behave against the community interest or does it achieve levels of efficiency beyond the capacity of small firms operating in highly competitive markets? There is no clear answer. As the extreme cases of monopoly are fairly rare in practice, examination is usually made of markets which approach monopoly conditions.
If the demand curve faced by the monopolist shifts, this will alter the marginal revenue curve and consequently the profit-maximising output and price. However, we cannot assume that the demand curve will simply move outwards parallel to the old one. It is possible that its slope may change (become steeper or less steep). Consequently, while normally we would expect an increase in demand at all prices to lead to an increase in monopoly price (assuming costs remained unchanged), we cannot be absolutely sure of this. Try experimenting with differently sloped average revenue curves. Remember that the marginal revenue must bisect (cut into two equal halves) the horizontal distance between the average revenue curve and the revenue (vertical) axis. You will find that there are changes that could produce a reduction in the profit-maximising price!
MONOPOLISTIC COMPETITION
Main Features
Monopolistic competition still retains many of the features of perfect competition – unrestricted entry to and exit from the market, good (but not perfect) communication and transport conditions, motivation by economic considerations only, and the perception by buyers that the products of the various firms are good substitutes for each other.
It is in this last point that monopolistic competition differs from perfect competition. Although the products are considered to be good substitutes, they are not homogeneous. Buyers do express preference for one seller’s product as opposed to another’s.
Sellers seek to increase this preference by differentiating their product through branding (giving it distinguishing features) and especially by advertising. The greater the degree of preference they can establish, the stronger the brand loyalty and the greater the freedom gained by the supplier from needing to follow the market price for that class of product. Success brings an increased degree of market power and a reduction in price elasticity of demand.
General Model
In the general model of monopolistic competition, however, we assume that the individual firm is not able to achieve a high degree of price inelasticity, so that the demand curve for the individual product has only a fairly gentle slope, i.e. there is still a high degree of substitutability between competing brands. This prevents the individual firm from making monopoly profits. It is still closely governed by the market price for the class of product. The result is shown in Figure 7.7.
Features of this model are outlined below.
- There is no abnormal or monopoly profit, i.e. average cost equals price/average revenue at Op and, as for perfect competition and monopoly, it includes an element of normal profit.
- At the profit-maximising output of Oq, average cost is still falling to its minimum at Oc, where average cost is equal to marginal cost – the output level where the rising marginal cost curve cuts the bottom of the average cost curve.
- Price (at Op) is above marginal cost (Om) at the profit-maximising output Oq.
Price is thus higher and output lower than would be the case if price were to be equal to marginal cost, as in perfect competition. The lack of monopoly profit is the result of competition and the ability of firms to enter and leave the market.
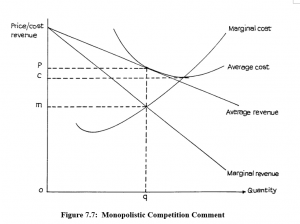
Figure 7.7: Monopolistic Competition Comment
It can be argued that this market structure is not really in the best interests of either consumers or business firms, for the following reasons:
- Price is higher and output lower than would be the case with perfect competition.
- The firm is not making the best use of its resources, since average cost is still falling at output Oq, as we saw a moment ago.
- Profits are confined to the normal minimum required to keep firms in the market – the amount included in our definition of costs for the purposes of these market models. They cannot achieve the profits needed for investment and research or the high output levels necessary for economies of scale.
It is also argued, however, that consumers are prepared to accept these additional prices and costs in return for the benefits they receive through greater choice of product – the ability to choose between competing brands and competing suppliers. This competition may also lead to improvements in product quality and design as well as services to the consumer.
We can expect firms operating in such market conditions to seek to increase their monopoly power and make their product-demand curves less elastic. They will do this by brand advertising, by securing favourable treatment from distribution organisations or through technical improvements in their products. They may be able to keep an advantage by securing patent protection or keeping processes secret from their competitors.
OLIGOPOLY
Oligopoly is the market structure where supply is controlled by a few firms which are large in relation to the market size. Very often the firms are also large by any standards, and are likely to be oligopolists in several markets.
Oligopoly is now commonly found in the advanced industrial countries and a great deal of attention is paid to it. There is, however, no single model which can be held to apply under all circumstances.
Price Competition
One influence that is thought to be important is the extent to which the products are in price competition with each other. If there is little price competition and if consumers are not thought to choose brands on the basis of comparative price (i.e. if cross elasticity of demand is low) then each oligopolist has a high degree of monopoly control over the demand for his own product.
This will, of course, depend chiefly upon whether the products are regarded by consumers as homogeneous or whether they consider each brand to be distinct and different. It is unlikely that consumers will find much to choose between, say, various brands of white loaves of bread. Cross elasticity of demand between the brands is thus likely to be high when the bread is on sale in similar distribution outlets. If there are price differences, customers will choose according to price.
In these circumstances, suppliers may seek to operate in different sections of the market, e.g. through different supermarket chains. They may also seek to differentiate their products through such devices as flavour or by developing novelty shapes or other related products.
A full study of oligopoly is likely to embrace problems of prices and non-price competition, and even the question of how far firms may collude together to limit the extent of competition between established firms and to protect themselves against possible newcomers to the market.
Price Stickiness
Efforts have been made to produce models based on traditional assumptions of profit maximisation. One such model seeks to explain the observed tendency that the prices of some goods in oligopolistic markets remain steady in spite of fluctuations in the prices of basic commodities. This “stickiness” is apparent in more normal, less inflationary times.
This particular feature of an oligopolistic market for a product still regarded as fairly homogeneous (in spite of brand advertising) has given rise to the model known usually as the kinked demand curve.
Kinked Demand Curve
Suppose the current and “sticky” price of a product is RWF1 per unit. This is the price that customers have come to expect. If one oligopolist supplier tries to increase the price, rival producers will be reluctant to follow. They keep their prices the same and gain market share at the expense of the price-raiser. If, however, the oligopolist reduces the price, the other suppliers are obliged to reduce their prices also to prevent his encroaching on their market share.
Thus there is a kink around the price of RWF1 in the demand (unit price or average revenue) curve faced by the individual oligopolist. At higher prices the curve is more elastic, due to the loss of market share, than at lower prices where all market shares stay the same. You can see the general shape of such a kinked curve in Figure 7.8.
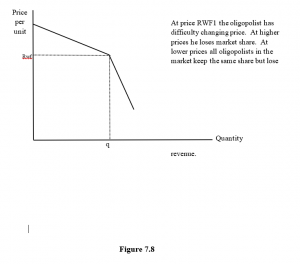
Figure 7.8
Now consider a possible table of revenues resulting from this condition.
The kink in the average revenue curve, shown in Figure 7.9, occurs at the price of RWF1,000 and the quantity level of 40 units. At prices above RWF1,000, demand falls off at the rate of ten units for each RWF100 rise in price. At prices below RWF1,000, however, demand falls by only five units for each RWF100 rise in price, i.e. the unit price has to fall RWF200 to enable the oligopolist to gain a quantity increase of ten units.
The change in the slope of the average revenue (price) curve results in a similar change in the slope of the marginal revenue curve and you can see that there are two possible marginal revenues at the quantity level of 40 units. The higher (RWF600) results from the continuation downwards of the upper part of the curve, whilst the lower (RWF200) results from the upward continuation of the lower part of the curve. This is clearer on the graph but you should be able to work out the same results from the table. Remember the marginal revenue levels in the table belong to the midpoints of the quantity changes. The lower curve is changing at the rate of RWF400 for each ten units; the upper curve is changing at the rate of RWF200 for each ten units.
Limitations of the Kinked Demand Curve Model
The implication of this model is that short-term fluctuations of variable and hence marginal costs will not lead the profit-maximising oligopolist to change his price or output. You can see in Figure 7.9 that the quantity level at which profits are maximised, i.e. where MC1 and MC2 = MR is 45, at which level the market clearing price is RWF100. Marginal cost can fluctuate anywhere between MC1 and MC2 without altering the profit maximising position.
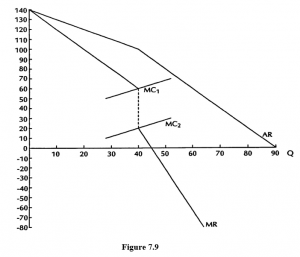
Figure 7.9
Remember, however, that this model depends on an assumption of profit-maximising behaviour for the oligopolist and a high degree of substitution between products. This produces the reactions from competing oligopolists which we have described (i.e. refusal to follow a price increase but matching a price reduction). It is not a general model of oligopoly and does not tell us how the “sticky” price is arrived at in the first place. There are too many behavioural assumptions for the model to be entirely satisfactory.
The model does not hold up during periods of severe price inflation, when we would expect firms to follow their rivals’ price rises but not any price reductions which they will not expect to be maintained because of rising costs.
Price Leadership
Another tendency, which does hold during inflation, is for all oligopolists in a market to follow the price movements of one firm, the price leader. Such leaders can be:
- The least-cost firm, which can oblige competitors with higher costs to follow its prices, even though they cannot maximise their own profits at the levels it sets.
- A firm which is typical of others in the market and which becomes a barometer of market conditions. If this firm feels that a price change is necessary, then it is probable that others will feel the same.
- The largest and the dominant firm in the market. The most common model of this situation assumes that this firm, because of its size and the economies of scale it can achieve, is able to achieve lower costs than the others. The lower its costs compared with the other firms’ costs the greater will be its market share and, consequently, its dominance in the market. This model is illustrated in Figure 7.10.
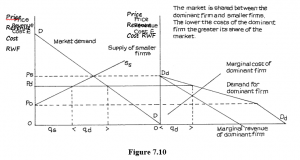
Figure 7.10
The market is shared between the dominant firm and smaller firms. The lower the costs of the dominant firm the greater its share of the market.
The dominant firm model makes the following assumptions:
- The dominant firm is aware of the total market demand curve and the cost conditions and hence the supply curve for the smaller firms in the market.
- The objective of the dominant firm is to maximise profits.
In Figure 7.10 the demand curve DD is the demand curve for the market and SsSs is the supply curve for the smaller firms. At price Po these firms are unwilling to supply to the market; it is their minimum price. At price Ps the smaller firms are able and willing to supply the full market demand at that price.
This knowledge allows the dominant firm to estimate its own demand curve, which is made up of market demand at each price less the amount which the smaller firms are able to supply. Thus the demand for the dominant firm’s product is nil at price Ps but it is the same as market demand at prices Po and below. Between these two prices the dominant firm is able to supply the balance between market demand and supply from the smaller firms.
On the assumption of profit maximisation the dominant firm will wish to supply quantity qd which is the quantity at which its marginal cost is equal to its marginal revenue. At this quantity level the dominant firm’s market clearing and profit maximising price is Pd. If it charges this price the other firms will have to follow, and market demand at this price is shared on the basis of qd to the dominant firm and qs to the smaller firms.
Notice that if you raise the dominant firm’s marginal cost curve you will reduce qd and increase qs. However, if you lower this curve you will increase the market share going to the dominant firm, which is thus able to maintain its dominance as long as it is able to keep its costs lower than those of the smaller firm. We may assume it is able to achieve this through economies of scale, a higher level of technical knowledge and managerial skill, and by its superior power to secure low prices in the factor markets.
PROFIT MAXIMISATION AND ALTERNATIVE OBJECTIVES FOR THE FIRM
In the discussions of perfect competition and monopoly, we noted that whereas under perfect competition long-term survival depended on the firm maximising its profits, whether or not this was its conscious objective, under monopoly the firm could survive without actually maximising profits. As long as it made a satisfactory profit it was able to pursue other objectives. We now develop this point more fully.
Any firm which possesses a substantial degree of market power as a producer and which is large in relation to the total size of the market in which it operates, will have a product demand curve which is downward sloping and, if it is successful, is also likely to be able to make profits above the minimum needed to keep it in the market. Its position may, therefore, be represented by a model similar to that usually used for monopoly as in Figure 7.11.
This model assumes that the firm does not practise price discrimination, so that its product demand curve is also its average revenue curve. Assuming that its market power allows it to make profits above the minimum, there will be a substantial range of output levels and prices between which it can make profits. This, in Figure 7.11, is the range between output level A (price PA) which is the lower break-even point where the falling average cost just equals average revenue, and output level C (price PC) which is the higher break-even point where the rising average cost just equals average revenue.
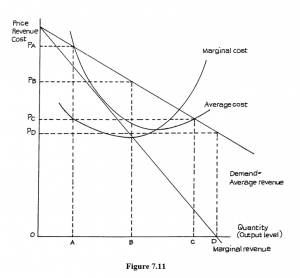
Figure 7.11
The firm in this situation can pursue objectives other than profit maximisation as long as it operates within this profit range, but, as the model suggests, the range can be very wide.
During the past half century there have been many economists who have argued that large firms, especially oligopolies, do not maximise profits. Unfortunately there has been no universal agreement over what objective or objectives they do pursue instead. A number of alternative theories of the firm have been developed and each of these is based on different assumptions about firms’ behaviour. For convenience we can identify two broad groups of theories – those that replace profit maximisation by an assumption that firms seek to maximise something else, and those that abandon any idea of maximisation in the belief that firms seek to pursue several objectives at the same time and cannot, therefore, hope to optimise any one.
Alternative Maximising Theories
An American economist, Baumol, suggested that firms seek to maximise sales revenue, subject to making a minimum profit which was defined as that level of profit needed to retain the support of the firm’s shareholders and the financial markets. In Figure 7.11 the revenue-maximising output level is at D, where marginal revenue is O (at the top of the total revenue curve), but in this model quantity D lies beyond the second break-even point of C, so the firm could not reach D without suffering a loss. If it were to try to maximise revenue subject to achieving minimum profit, it would have to produce at an output level somewhere between B and C and charge a price between PA and PB.
A British economist, Marris, has argued that firms seek to maximise their rate of growth (expansion) subject to preserving their share values at a level where the firm can hope to be reasonably safe from the fear of being taken over. If the firm grows too fast, its profit rate tends to fall and this depresses the share value and brings the risk of take-over. Too slow a rate of growth is also likely to bring the firm to the notice of take-over raiders, so the firm has to balance the desire for growth with the need to maintain profits.
There are similarities in the Baumol and Marris theories. Both agree that the firm’s objectives are really established by its professional managers, who are free to control the firm as long as they keep the shareholders satisfied with their dividends and the financial markets satisfied with their profits. Profit remains important – no one doubts that in a market economy – but it is not maximised to the exclusion of other aims that meet managerial ambitions. Managers like to operate in large firms because size brings prestige, high salaries and a range of other benefits, so these are pursued, to some extent at the expense of the profits belonging to shareholders. In the Baumol theory, revenue was seen largely as a way of measuring growth. The Marris argument is slightly more complex and stresses growth more directly.
Another American economist, Williamson, developed another kind of maximisation but quite cleverly combined this with the idea that the firm pursued several objectives at the same time. Again agreeing with the idea that managers were the real controllers of the firm, Williamson argued that they sought to maximise managerial utility and that this utility was a combination of the pursuit of profit, growth, measured by the number of people employed, and managerial “perks” (all the various expenses, benefits, etc. that movement up the business managerial ladder tends to bring).
Satisficing Theories
The rather ugly word “satisficing” has been coined to express the idea that firms pursue several different objectives at once. Whereas no one objective can be achieved to complete satisfaction, the firm aims to pursue each to a degree of tolerable semisatisfaction, i.e. it “satisfices” without fully satisfying. The idea was first given clear expression by the American economist, Simon, in an influential book, Administrative Behaviour. Simon argued that, in practice, firms could not hope, even if they wished, to maximise anything but rather reacted to problems as they arose and aimed to keep all those involved in the firm reasonably satisfied so that the firm could continue to exist.
Following the reasoning of Simon, this idea was developed into a more formal Behavioural Theory of the Firm by two more American economists, Cyert and March, in a book with that title. In this theory the firm is seen as a coalition between shareholders, managers and customers, all of whose support is needed to hold the coalition together. To do so the firm has to pursue multiple objectives, such as profit, sales growth, market share and products to satisfy customers as well as the needs of production managers, but no one objective can be pursued to the exclusion of the others. The firm has to develop a set of behavioural principles to enable it to hold the coalition together and guide managerial decision-making.
Various other attempts have been made to explain business behaviour but there is no general agreement as to whether the traditional assumption of profit maximisation should be abandoned and, if so, what should replace it. The alternative theories sometimes seem to describe actual business behaviour more realistically, especially in relation to large oligopolists. Firms do pursue growth, often at the expense of profits, take-over battles are commonplace and the salaries and prestige of top business managers appear to bear little relationship to the profitability of the companies they manage.
On the other hand, an economic theory of the firm should be concerned not only with how firms actually do behave but also how they should behave, if the economic goals of technical and allocative efficiency are to be achieved. Unfortunately, the alternative theories appear to suggest that if firms operate as they predict, they are likely to be less efficient in the full economic sense than if they pursue profit maximisation – the desire to make the largest achievable profit consistent with market conditions. One thing that has to be remembered always is that profit maximisation does not mean making very large and anti-social profits, but simply the largest profit possible under prevailing market conditions. Profit maximisation under perfect competition suggests lower profits than satisficing behaviour in an oligopolist market. A market economy appears to operate more efficiently when firms seek to maximise profit. Consequently, most economists continue to work with profit-maximising models, whilst fully recognising that firms do frequently depart from profit-maximising behaviour in practice.