
INTRODUCTION
The opportunity cost of capital (or simply, the cost of capital) for a project is the discount rate for calculating the present value of cash flows. The project’s cost of capital is the minimum required rate of return on funds committed to the project, which depends on the riskiness of its cash flows. Since the investment projects undertaken by a firm may differ in risk, each one of them will have its own unique cost of capital. It should be clear at the outset that the cost of capital for a project is defined by its risk, rather than the characteristics of the firm undertaking the project.
The firm represents the aggregate of investment projects undertaken by it. Therefore, the firm’s cost of capital will be the overall, or average, required rate of return on the aggregate of investment projects. Thus, the firm’s cost of capital is not the same thing as the project’s cost of capital. The firm’s cost of capital can be used for discounting the cash flows of those investment projects, which have risk equivalent to the average risk of the firm. As a first step, however, the firm’s cost of capital can be used as a standard for establishing the required rates of return of the individual investment projects. In the absence of a reliable formal procedure of calculating the cost of capital for projects, the firm’s cost of capital can be adjusted upward or downward to account for risk differentials of investment projects. That is, an investment project’s required rate of return may be equal to the firm’s cost of capital plus or minus a risk adjustment factor, depending on whether the project’s risk is higher or lower than the firm’s risk.
SIGNIFICANCE OF THE COST OF CAPITAL
evaluating investment decisions, designing a firm’s debt policy and
We should recognize that the cost of capital is one of the most difficult and disputed topics in the finance theory. Financial experts express conflicting opinions as to the correct way in which the cost of capital can be measured. Irrespective of the measurement problems, it is a concept of vital importance in the financial decision making. It is useful as a standard for:
appraising the financial performance of top management
Investment Evaluation
The primary purpose of measuring the cost of capital is its use as a financial standard for evaluating the investment projects. In Chapter 3, we have discussed the concepts of discounting, net present value (NPV) and internal rate of return (IRR). In the NPV method, an investment project is accepted if it has a positive NPV. The project’s NPV is calculated by discounting its cash flows by the cost of capital. In this sense, the cost of capital is the discount rate used for evaluating the desirability of an investment project. In the IRR method, the investment project is accepted if it has an internal rate of return greater than the cost of capital. In this context, the cost of capital is the minimum required rate of return on an investment project. It is also known as the cut-off rate or the hurdle rate.
Designing Debt Policy
The debt policy of a firm is significantly influenced by the cost consideration. As we shall learn later on, debt helps to save taxes, as interest on debt is a tax-deductible expense. The interest tax shield reduces the overall cost of capital, though it also increases the financial risk of the firm. In designing the financing policy, that is, the proportion of debt and equity in the capital structure, the firm aims at maximizing the firm value by minimizing the overall cost of capital.
Performance Appraisal
The cost of capital framework can be used to evaluate the financial performance of top management.1 Such an evaluation will involve a comparison of actual profitability of the investment projects undertaken by the firm with the projected overall cost of capital, and the appraisal of the actual costs incurred by management in raising the required funds.
The cost of capital also plays a useful role in dividend decision and investment in current assets. The chapters dealing with these decisions show their linkages with the cost of capital.
THE CONCEPT OF THE OPPORTUNITY COST OF CAPITAL
Decision making is a process of choosing among alternatives. In the investment decisions, an individual or a manager encounters innumerable competing investment opportunities to choose from. For example, you may invest your savings of `1,000 either in 7 per cent, 3year postal certificates or in 6.5 per cent, 3 year fixed deposit in a nationalized bank. In both the cases, the government assures the payment, so the investment opportunities reflect equivalent risk. You decide to deposit your savings in the bank. By this action, you have foregone the opportunity of investing in the postal certificates. You have, thus, incurred an opportunity cost equal to the return on the foregone investment opportunity of equivalent risk. It is 7 per cent in case of your investment. The opportunity cost is the rate of return foregone on the next best alternative investment opportunity of comparable risk. Thus, the required rate of return on an investment project is an opportunity cost.
Shareholders’ Opportunities and Values
Suppose you appoint a manager to manage your business. She has the responsibility for the investment decisions. Whose opportunity cost should the manager use? Since you are the supplier of funds and you own the firm and the manager is acting on your behalf, you will require her to use your required rate of return in making investment decisions. If she is unable to earn returns equal to your required rate of return, you can ask her to return the money to you, which you can invest in securities in the financial markets and earn the required rate of return.
In the case of companies, there is a divorce between management and ownership. In an allequity-financed company, management makes investment decisions, but shareholders supply the capital. Therefore, a question may be raised: whose opportunity cost (or the required rate of return) should be considered in evaluating the investment projects? Since the firm’s objective is to maximize the shareholder’s wealth, the investment projects should be analysed in terms of their values to shareholders. To appreciate this point, suppose you are the ownermanager of a firm. You make the investment decisions and you supply funds to finance the investment projects. You will use your required rate of return to evaluate the investment projects. Your required rate of return will depend on investment opportunities of equivalent risk available to you in the financial markets. Thus, the required rate of return (or the opportunity cost of capital) is market-determined rate.
Assume that you convert your firm into a joint-stock company where you invite other shareholders to contribute the capital and share ownership with them. Now many shareholders own the firm. The manager should consider all owners’ (shareholders’) required rate of return in evaluating the investment decisions. If the manager is unable to earn the rate on the investment projects, which the shareholders could themselves earn on alternative investment opportunities, they will be within their rights to ask for returning their funds. Thus, management acts as an agent of shareholders. It should evaluate investment opportunities using the shareholders’ opportunity cost; that is, the rate the shareholders would use if they were themselves appraising the investment opportunities. Hence, in an all-equity-financed firm, the equity capital of ordinary shareholders is the only source to finance investment projects, the firm’s cost of capital is equal to the opportunity cost of equity capital, which will depend only on the business risk of the firm.
Creditors’ Claims and Opportunities
Risk Differences in Shareholders’ and Creditor Claims
In practice, both shareholders and creditors (debt-holders) supply funds to finance a firm’s investment projects. Investors hold different claims on the firm’s assets and cash flows, and thus, they are exposed to different degrees of risk. Creditors have a priority claim over the firm’s assets and cash flows. The firm is under a legal obligation to pay interest and repay principal. Debt-holders are, however, exposed to the risk of default. Since the firm’s cash flows are uncertain, there is a probability that it may default on its obligation to pay interest and principal. Preference shareholders hold claim prior to ordinary shareholders but after debt holders. Preference dividend is fixed and known, and the firm will pay it after paying interest but before paying any ordinary dividend. Because preference dividend is subordinated to interest, preference capital is more risky than debt. Ordinary shareholders supply capital, either in the form of retained earnings or by purchasing new shares. Unlike creditors, they are owners of the firm and retain its control. They delegate powers to management to make investment decisions on their behalf in such a way that their wealth is maximized. However, ordinary shareholders have claim on the residual assets and cash flows. The payment of ordinary dividend is discretionary. Ordinary shareholders may be paid dividends from cash remaining after interest and preference dividends have been paid. Also, the market price of ordinary share fluctuates more widely than that of the preference share and debt. Thus, ordinary share is more risky than both preference share and debt. Various forms of corporate debt can also be distinguished in terms of their differential riskiness. If we compare corporate bonds and government bonds, the latter are less risky since it is very unlikely that the government will default in its obligation to pay interest and principal.
Investors will require different rates of return on various securities since they have risk differences. Higher the risk of a security, the higher the rate of return demanded by investors. Since ordinary share is most risky, investors will require highest rate of return on their investment in ordinary shares. Preference share is more risky than debt; therefore, its required rate of return will be higher than that of debt. The risk-return relationship for various securities is shown in Figure 8.1. It may be observed in the figure that the required rate of return of any security is composed of two rates—a risk-free rate and a risk-premium. A risk-free will require compensation for time value and its risk-premium will be zero. Government securities, such as the treasury bills and bonds, are examples of the risk-free securities. Investors expect higher rates of return on risky securities. The higher the risk of a security, the higher will be its risk-premium and therefore, a higher required rate of return.
Since the firm sells various securities to investors to raise capital for financing investment projects, it is, therefore, necessary that investment projects to be undertaken by the firm should generate at least sufficient net cash flow to pay investors—shareholders and debt-holders—their required rates of return. In fact, investment projects should yield more cash flows than to just satisfy the investors’ expectations, in order to make a net contribution to the wealth of ordinary shareholders. Viewed from all investors’ point of view, the firm’s cost of capital is the rate of return required by them for supplying capital for financing the firm’s investment projects by purchasing various securities. It may be emphasized that the rate of return required by all investors will be an overall rate of return—a weighted rate of return. Thus, the firm’s cost of capital is the ‘average’ of the opportunity costs (or required rates of return) of various securities, which have claims on the
firm’s assets. This rate reflects both the business (operating) risk and the financial risk resulting from debt capital. Recall that the cost of capital of an all-equity financed firm is simply equal to the ordinary shareholders’ required rate of return, which reflects only the business risk.
General Formula for the Opportunity Cost of Capital
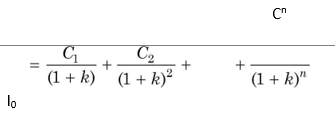
How does a firm know about the required rates of return of investors? The required rates of return are market-determined. They are established in the capital markets by the actions of competing investors. The influence of market is direct in the case of new issue of ordinary and preference shares and debt. The market price of securities is a function of the return expected by investors. The demand and supply forces work in such a way that equilibrium rates are established for various securities. Thus, the opportunity cost of capital is given by the following formula:
In terms of Equation (1), the cost of capital is the internal rate of return, which equates the present values of inflows and outflows of a financial opportunity.2 The outflows in Equation (1) represent the returns that investors could earn on the alternative investment opportunities of equivalent risk in the financial markets.
where I0 is the capital supplied by investors in period 0 (it represents a net cash inflow to the firm), Cn are returns expected by investors (they represent cash outflows to the firm) and k is the required rate of return or the cost of capital.
In the case of retained earnings, firms are not required to pay any dividends; no cash outflow takes place. Therefore, retained earnings have no explicit cost of capital. But they have a definite opportunity cost. The opportunity cost of retained earnings is the rate of return, which the ordinary shareholders would have earned on these funds if they had been distributed as dividends to them. The firm must earn a rate of return on retained funds which is at least equal to the rate that shareholders could earn on these funds to justify their retention.
Weighted Average Cost of Capital vs Specific Costs of Capital
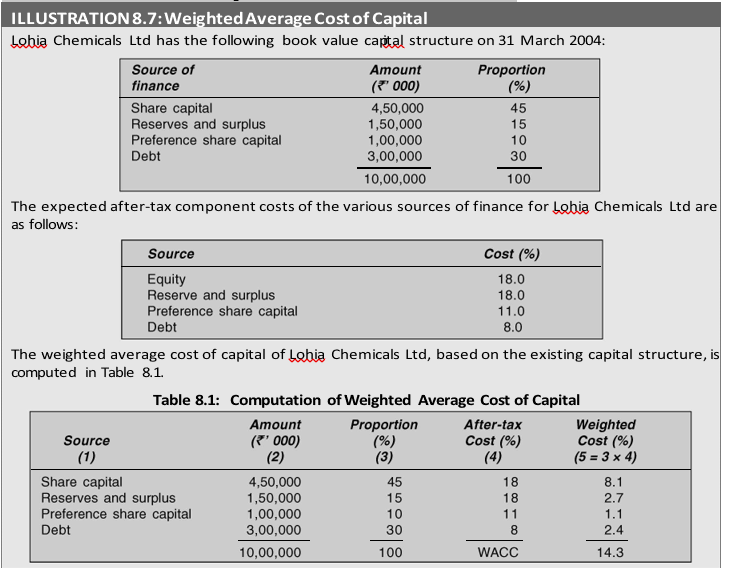
A firm obtains capital from various sources. As explained earlier, because of the risk differences and the contractual agreements between the firm and investors, the cost of capital of each source of capital differs. The cost of capital of each source of capital is known as component, or specific, cost of capital. The combined cost of all sources of capital is called overall, or average cost of capital. The component costs are combined according to the weight of each component capital to obtain the average costs of capital. Thus, the overall cost is also called the weighted average cost of capital (WACC).
The overall cost of capital is the weighted average cost of the various sources of capital. For example, if the long-run proportions of debt and equity in the above-mentioned example, respectively, are 60 per cent and 40 per cent, then the combined cost of capital is: 0.06 × 0.60 + 0.11 × 0.40 = 0.8 or 8 per cent. Thus, both Projects A and B should be accepted since each of them is expected to yield a rate of return higher than the overall cost of capital. Accepting both Projects A and B will maximize the shareholders’ wealth.
Suppose a firm has the cost of equity of 11 per cent and cost of debt of 6 per cent. In the beginning of the year, the firm considers Project A, which has an expected rate of return of 10 per cent. The firm decides to finance this project by debt. If the component cost of capital is used to evaluate Project A, the firm will accept it since its IRR (10 per cent) is greater than the component cost (6 per cent.). After some time, the company considers Project B, which has same risk as Project A and also has an expected rate of return of 10 per cent. The firm finds that Project A has exhausted its borrowings capacity, and hence, it will have to raise equity funds to finance Project B. Using the component cost of capital as the cut-off rate, the firm will reject Project B since its expected rate of return (10 per cent) is less than the component cost (11 per cent). Thus, out of two projects that are economically identical, the firm accepts one and rejects another simply because it associates the method of financing with the investment projects. What is wrong with this policy? It fails to consider the relationships between component costs. The various sources of capital are related to each other. The firm’s decision to use debt in a given period reduces its future debt capacity as well as increases risk of shareholders. The shareholders will require a higher rate of return to compensate for the increased risk. Similarly, the firm’s decision to use equity capital would enlarge its potential for borrowings in the future. Over the long run, the firm is expected to maintain a balance between debt and equity. The mix of debt and equity is called the firm’s capital structure. Because of the connection between the sources of capital and the firm’s desire to have a target capital structure in the long run, it is generally agreed that the cost of capital should be used in the composite, overall sense.3 That is, in terms of the weighted average cost of capital.
In practice, firms do not use the same debt–equity mix to finance their capital expenditures every year. They raise funds in ‘lumps’. They may issue bonds at one time and at another time, they may either issue ordinary shares or may use retained earnings. The target capital structure is a policy decision. Firms may not hold the target capital structure in a particular year. But they maintain it in the long run. Therefore, in spite of ‘lumpy’ financing by firms at different points in time, the overall cost of capital, rather than the component cost of capital, should be used in evaluating investment projects. It is not correct to associate a particular source of financing with a particular investment project.
Like the firm’s WACC, we can also calculate the project’s WACC. The debt capacity of the project may be different from the firm’s overall debt capacity. Therefore, the capital structure of the project should be considered in calculating its WACC. In practice, financial managers, for convenience, may use the firm’s capital structure to estimate the project’s WACC. This is a wrong practice.
You must remember that the relevant cost in the investment decisions is the future cost or the marginal cost. Marginal cost is the new or the incremental cost that the firm incurs if it were to raise capital now, or in the near future. The historical cost that was incurred in the past in raising capital is not relevant in financial decision-making. Historical costs may be significant to the extent that they help in predicting the future costs and in providing an evaluation of the past performance when compared with standard, or predetermined, costs. Check Your Concepts
- Define the concept of the opportunity cost of capital.
- What opportunities are available to shareholders with regard to investment and return?
- What opportunities are available to creditors with regard to investment and return?
- What is the nature of shareholders’ and creditors’ claims and risks?
- What is weighted average cost of capital? What is its logic?
DETERMINING COMPONENT COSTS OF CAPITAL
Generally, the component cost of a specific source of capital is equal to the investors’ required rate of return, and it can be determined by using Equation (1). But the investors’ required rate of return should be adjusted for taxes in practice for calculating the cost of a specific source of capital to the firm. In the investment analysis, net cash flows are computed on an after-tax basis, therefore, the component costs, used to determine the discount rate, should also be expressed on an after-tax basis.
COST OF DEBT
Debt Issued at Par
A company may raise debt in a variety of ways. It may borrow funds from financial institutions or public either in the form of public deposits or debentures (bonds) for a specified period of time at a certain rate of interest. A debenture or bond may be issued at par or at a discount or premium as compared to its face value. The contractual rate of interest or the coupon rate forms the basis for calculating the cost of debt.
The before-tax cost of debt is the rate of return required by lenders. It is easy to compute before-tax cost of debt issued and to be redeemed at par; it is simply equal to the contractual (or coupon) rate of interest. For example, a company decides to sell a new issue of 7 year 15 per cent bonds of `100 each at par. If the company realizes the full face value of `100 bond and will pay `100 principal to bondholders at maturity, the before-tax cost of debt will simply be equal to the rate of interest of 15 per cent. Thus:
![]()
where kd is the before-tax cost of debt, i is the coupon rate of interest, B0 is the issue price of the bond (debt) and in Equation (2) it is assumed to be equal to the face value (F), and INT is the amount of interest. The amount of interest payable to the lender is always equal to: Interest = Face value of debt × Interest rate
The before-tax cost of bond in the example is:
We could arrive at same results as above by using Equation (1): cash outflow are `15 interest per year for 7 years and `100 at the end of seventh year in exchange for `100 now. Thus:
15 15 15 15 15 15 15 100
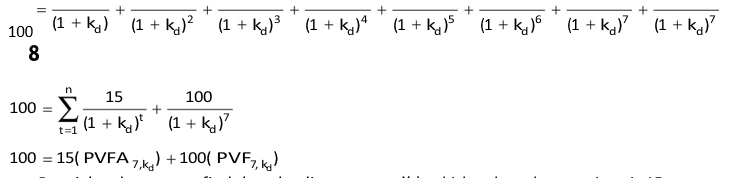

Clearly, the before-tax cost of bond is the rate, which the investment should yield to meet the outflows to bondholders.
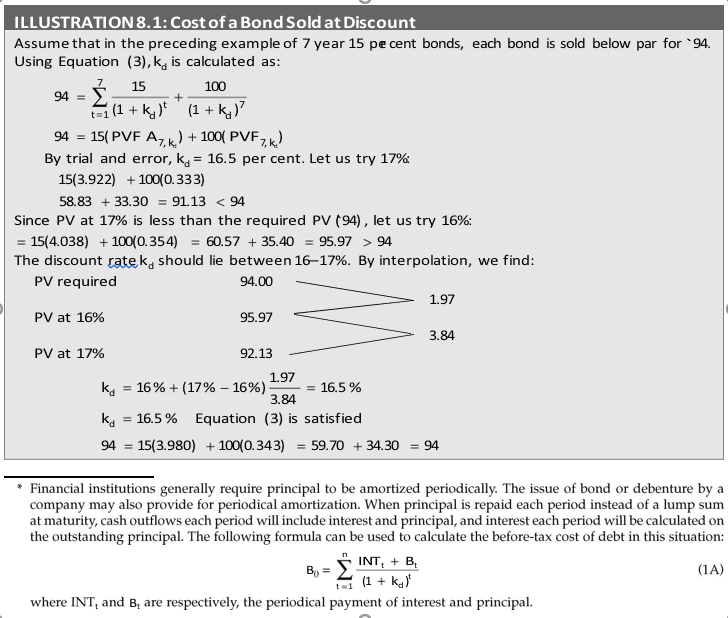
Debt Issued at Discount or Premium
Equations (1) and (2) will give identical results only when debt is issued at par and redeemed at par. Equation (1) can be rewritten as follows to compute the before-tax cost of debt:
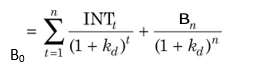
where Bn is the repayment of debt on maturity and other variables as defined earlier.* Equation (3) can be used to find out the cost of debt whether debt is issued at par or discount or premium, i.e., B0 = F or B0 > F or B0 < F. Let us consider an example.
If the discount or premium is adjusted for computing taxes, the following short-cut method can also be used to calculate the before-tax cost of debt:
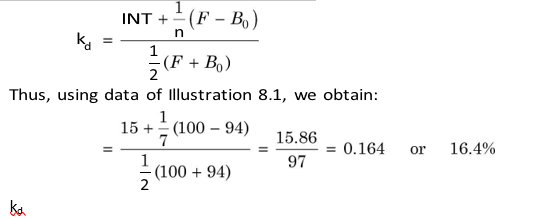
Note that the short-cut method gives approximately the same result as Equation (3). The principal drawback of the method is that it does not consider the sinking fund payments or the annual compounding.4
It should be clear from the preceding discussion that the before-tax cost of bond to the firm is affected by the issue price. The lower the issue price, the higher will be the before-tax cost of debt. The highly successful companies may sell bond or debenture at a premium (B0 > F); this will pull down the before-tax cost of debt.
Tax Adjustment
After-tax cost of debt = kd (1 – T ) (5)
The interest paid on debt is tax deductible. The higher the interest charges, the lower will be the amount of tax payable by the firm. This implies that the government indirectly pays a part of the lender’s required rate of return. As a result of the interest tax shield, the after-tax cost of debt to the firm will be substantially less than the investors’ required rate of return. The before-tax cost of debt, kd, should, therefore, be adjusted for the tax effect as follows:
where T is the corporate tax rate. If the before-tax cost of bond in our example is 16.5 per cent, and the corporate tax rate is 35 assumed per cent,* the after-tax cost of bond will be:
![]()
It should be noted that the tax benefit of interest deductibility would be available only when the firm is profitable and is paying taxes. An unprofitable firm is not required to pay any taxes. It would not gain any tax benefit associated with the payment of interest, and its true cost of debt is the before-tax cost.
It is important to remember that in the calculation of the average cost of capital, the after-tax cost of debt must be used, not the before-tax cost of debt.
ILLUSTRATION 8.2: Cost of a Bond Sold at Discount and Redeemable at Premium
A 7 year, `100 debenture of a firm can be sold for a net price of `97.75. The rate of interest is 15 per cent per year, and bond will be redeemed at 5 per cent premium on maturity. The firm’s tax rate is 35 per cent. Compute the after-tax cost of debenture.
The annual interest will be: F × i = `100 × 0.15 = `15, and maturity price will be: `100 (1.05) = `105. We can use Equation (3) to compute the after-tax cost of debenture: n 15 105
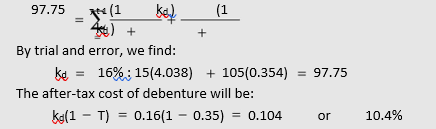
![]()
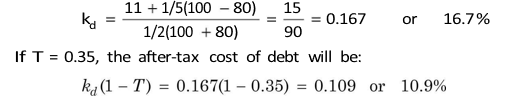
Cost of the Existing Debt
Sometimes a firm may like to compute the ‘current’ cost of its existing debt. In such a case, the cost of debt should be approximated by the current market yield of the debt. Suppose that a firm has 11 per cent debentures of `100,000 (`100 face value), outstanding at 31 December 2009, to be matured on 31 December 2014. If a new issue of debentures could be sold at a net realizable price of `80 in the beginning of 2010, the cost of the existing debt, using short-cut method (Equation 4), will be:
COST OF PREFERENCE CAPITAL
The cost of preference capital is a function of the dividend expected by investors. Preference capital is never issued with an intention not to pay dividends. Although it is not legally binding upon the firm to pay dividends on preference capital, yet it is generally paid when the firm makes sufficient profits. The failure to pay dividends, although does not cause bankruptcy, yet it can be a serious matter from the ordinary shareholders’ point of view. The non-payment of dividends on preference capital may result in voting rights and control to the preference shareholders. More than this, the firm’s credit standing may be damaged. The accumulation of preference dividend arrears may adversely affect the prospects of ordinary shareholders for receiving any dividends, because dividends on preference capital represent a prior claim on profits. As a consequence, the firm may find difficulty in raising funds by issuing preference or equity shares. Also, the market value of the equity shares can be adversely affected if dividends are not paid to the preference shareholders and, therefore, to the equity shareholders. For these reasons, dividends on preference capital should be paid regularly except when the firm does not make profits or it is in a very tight cash position.
The measurement of the cost of preference capital poses some conceptual difficulty. In the case of debt, there is a binding legal obligation on the firm to pay interest, and the interest constitutes the basis to calculate the cost of debt. However, in the case of preference capital, payment of dividends is not legally binding on the firm and even if the dividends are paid, it is not a charge on earnings; rather it is a distribution or appropriation of earnings to preference shareholders. One may, therefore, be tempted to conclude that the dividends on preference capital do not constitute cost. This is not true.
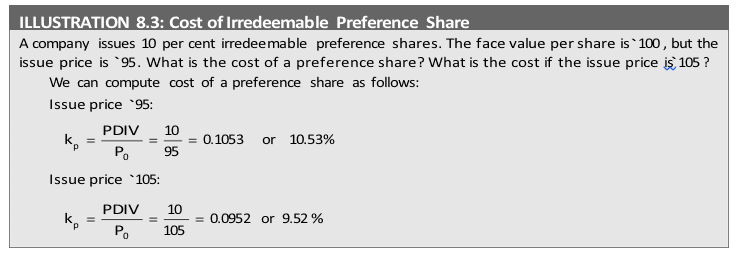
Irredeemable Preference Share
In India, irredeemable preference shares cannot be issued. The preference share may be treated as a perpetual security if it is irredeemable; its cost is given by the following equation:

where kp is the cost of preference share, PDIV is the expected preference dividend, and P0 is the issue price of preference share.
Redeemable Preference Share
Redeemable preference shares (that is, preference shares with finite maturity) are also issued in practice. A formula similar to Equation (3) can be used to compute the cost of redeemable preference share:
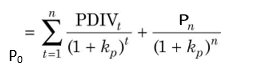
The cost of preference share is not adjusted for taxes because preference dividend is paid after the corporate taxes have been paid. Preference dividends do not save any taxes.* Thus, the cost of preference share is automatically computed on an after-tax basis. Since interest is tax deductible and preference dividend is not, the after-tax cost of preference share is substantially higher than the after-tax cost of debt.
Check Your Concepts
- What is redeemable preference share? How is its cost calculated?
- What is irredeemable preference share? How is its cost calculated?
COST OF EQUITY CAPITAL
Firms may raise equity capital internally by retaining earnings. Alternatively, they could distribute the entire earnings to equity shareholders and raise equity capital externally by issuing new shares. In both cases, shareholders are providing funds to the firms to finance their capital expenditures. Therefore, the equity shareholders’ required rate of return would be the same whether they supply funds by purchasing new shares or by foregoing dividends, which could have been distributed to them. There is, however, a difference between retained earnings (internal equity) and issue of equity shares (external equity) from the firm’s point of view. The firm may have to issue new shares at a price lower than the current market price. Also, it may have to incur flotation costs. Thus, external equity will cost more to the firm than the internal equity.

Is Equity Capital Free of Cost?
It is sometimes argued that the equity capital is free of cost. The reason for such argument is that it is not legally binding for firms to pay dividends to ordinary shareholders. Further, unlike the interest rate or preference dividend rate, the equity dividend rate is not fixed. It is fallacious to assume equity capital to be free of cost. As we have discussed earlier, equity capital involves an opportunity cost; ordinary shareholders supply funds to the firm in the expectation of dividends and capital gains commensurate with their risk of investment. The market value of the shares, determined by the demand and supply forces in a well functioning capital market, reflects the return required by ordinary shareholders. Thus, the shareholders’ required rate of return, which equates the present value of the expected dividends with the market value of the share, is the cost of equity. The cost of external equity would, however, be more than the shareholders’ required rate of return if the issue price were different from the market price of the share.
In practice, it is a formidable task to measure the cost of equity. The difficulty derives from two factors: First, it is very difficult to estimate the expected dividends. Second, the future earnings and dividends are expected to grow over time. Growth in dividends should be estimated and incorporated in the computation of the cost of equity. The estimation of growth is not an easy task. Keeping these difficulties in mind, the methods of computing the cost of internal and external equity are discussed below.
Cost of Internal Equity: The Dividend-growth Model
Normal Growth
A firm’s internal equity consists of its retained earnings. The opportunity cost of the retained earnings is the rate of return foregone by equity shareholders. The shareholders generally expect dividend and capital gain from their investment. The required rate of return of shareholders can be determined from the dividend valuation model.*
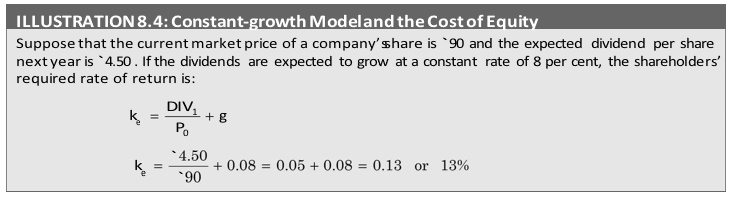
As explained earlier, the dividend-valuation model for a firm whose dividends are expected to grow at a constant rate of g is as follows:

where DIV1 = DIV0 (1 + g). P0 is the market price of the share which is assumed to be a fair price.
Equation (8) can be solved for calculating the cost of equity ke as follows:

The cost of equity is, thus, equal to the expected dividend yield (DIV1/P0) plus capital gain rate as reflected by expected growth in dividends (g). It may be noted that Equation (9) is based on the following assumptions:5
The dividend, DIV1, is positive (i.e., DIV1 > 0).
The dividends grow at a constant growth rate g, and the growth rate is equal to the return on equity, ROE, times the retention ratio, b (i.e., g = ROE × b). The dividend payout ratio [i.e., (1 – b)] is constant.
The cost of retained earnings determined by the dividend-valuation model implies that if the firm would have distributed earnings to shareholders, they could have invested it in
![]()
the shares of the firm or in the shares of other firms of similar risk at the market price (P0) to earn a rate of return equal to ke. Thus, the firm should earn a return on retained funds equal to ke to ensure growth of dividends and share price. If a return less than ke is earned on retained earnings, the market price of the firm’s share will fall. It may be emphasized again that the cost of retained earnings will be equal to the shareholders’ required rate of return since no flotation costs are involved.
If the company intends to retain earnings, it should at least earn a return of 13 per cent on retained earnings to keep the current market price unchanged.
Zero-growth
The dividend valuation model can also be used to estimate the cost of equity of no-growth companies. The cost of equity of a share on which a constant amount of dividend is expected perpetually is given as follows:

The growth rate g will be zero if the firm does not retain any of its earnings; that is, the firm follows a policy of 100 per cent payout. Under such case, dividends will be equal to earnings, and therefore Equation (13) can also be written as:
![]()
which implies that in a no-growth situation, the expected earnings–price (E/P) ratio may be used as the measure of the firm’s cost of equity.
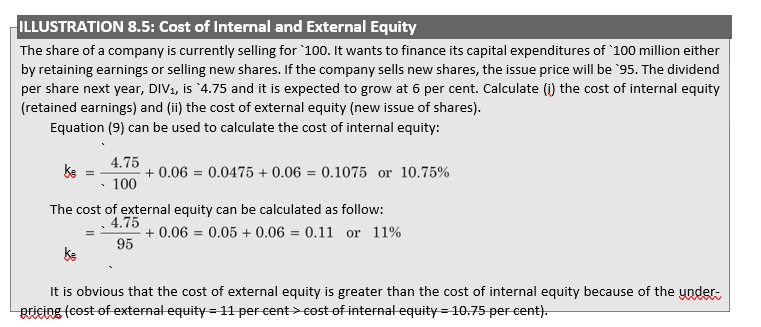
Cost of External Equity: The Dividend-growth Model
The firm’s external equity consists of funds raised externally through public or right issues. The minimum rate of return, which the equity shareholders require on funds supplied by them by purchasing new shares to prevent a decline in the existing market price of the equity share, is the cost of external equity. The firm can induce the existing or potential shareholders to purchase new shares when it promises to earn a rate of return equal to:
![]()
Thus, the shareholders’ required rate of return from retained earnings and external equity is the same. The cost of external equity is, however, greater than the cost of internal equity for one reason. The selling price of the new shares may be less than the market price. In India, the new issues of ordinary shares are generally sold at a price less than the market price prevailing at the time of the announcement of the share issue. Thus, the formula for the cost of new issue of equity capital may be written as follows:

where PI is the issue price of new equity. The cost of retained earnings will be less than the cost of new issue of equity if P0 > PI.
Calculating Growth Rate
Growth rate is calculated on the basis of historical data. As discussed earlier, the dividend of a company grows when it retains its earnings at its rate of return on investments. Thus, growth is given as follows:
Growth = Retention ratio × Rate of return g = b × r
Another method of estimating growth is to calculate the average of the year-to-year growth in dividend per share (DPS) or earnings per share (EPS). Consider the following example.
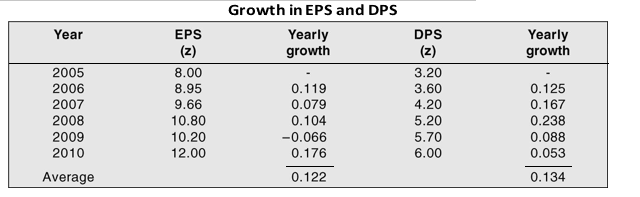
The 5-year average growth in EPS is 12.2 per cent and in DPS 13.4 per cent.
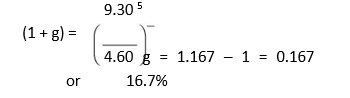
Yet another method is calculating the compound growth rate between two points of time. Suppose DPS has grown to `9.30 from `4.60 in 5 years. The compound growth can be calculated as follows:
- 60(1 + g)5 = 9.30 1
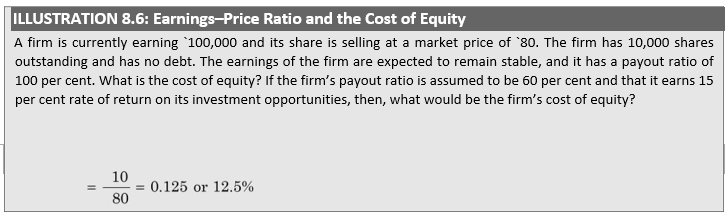
Earnings–Price Ratio and the Cost of Equity
As a general rule, it is not theoretically correct to use the ratio of earnings to price as a measure of the cost of equity. The earnings–price (E/P) ratio does not reflect the true expectations of the ordinary shareholders. For example, if the current market price of a share is `500 (face value being `100) and the earning per share is `10, the E/P ratio will be: `10 ÷ `500 = 0.02 or 2 per cent. Does this mean that the expectation of shareholders is 2 per cent? They would, in fact, expect to receive a stream of dividends and a final price of the share that would result in a return significantly greater than the E/P ratio. The dividendgrowth model gives the most of valid measure of the cost of equity.
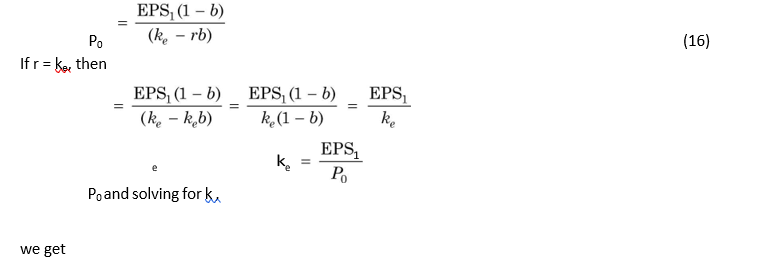
There are exceptions, however. One exception, that we have already pointed out, is the no-growth firms. In a no-growth firm, the firm distributes all its earnings as dividends and hence, the retention ratio, b, is zero. The cost of equity in the case of the no-growth firms is equal to the expected E/P ratio:
where b is the earnings retention rate, EPS1 is the expected earnings per share and r is the return equity. The assumption is that the firm does not employ debt (borrowing).
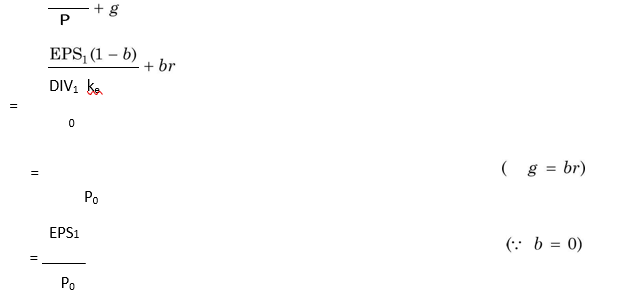
Another situation where the expected earnings–price ratio may be used as a measure of the cost of equity is expansion, rather than growth faced by the firm. A firm is said to be expanding, not growing, if the investment opportunities available to it are expected to earn a rate of return equal to the cost of equity.6 For example, Equation (9) may be written as follows:
In the first case, since expected growth rate is zero, we can use expected earnings–price ratio to compute the cost of equity. Thus:
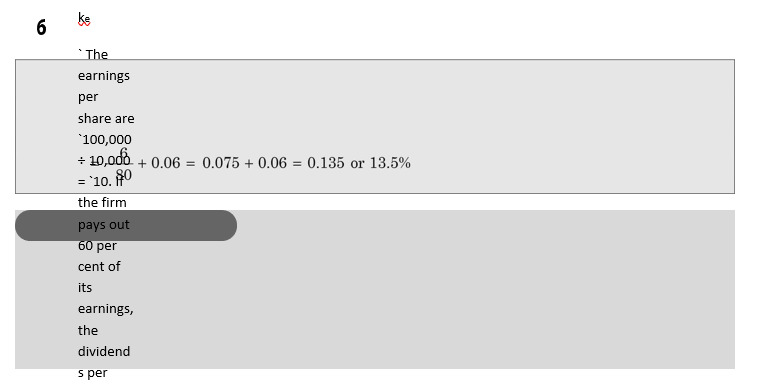
share will be: `10 × 0.6 = `6, and the retention ratio will be 40 per cent. If the expected return on internal investment opportunities is 15 per cent, then the firm’s expected growth is: 0.40 × 0.15 = 0.06 or 6 per cent. The firm’s cost of equity will be:
` ke `
Check Your Concepts
- Is equity cost free? Why or why not?
- Explain the dividend growth model for calculating equity under (i) no growth and (ii) constant growth.
- Is there a difference between the cost of external equity (new issue) and internal equity(retained earnings)? Explain.
- Can you use earnings–price ratio as the cost of equity? Why or why not?
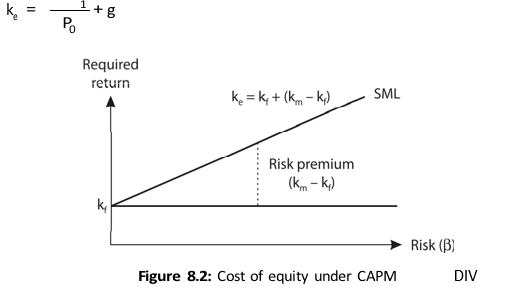
COST OF EQUITY AND THE CAPITAL ASSET PRICING MODEL (CAPM)
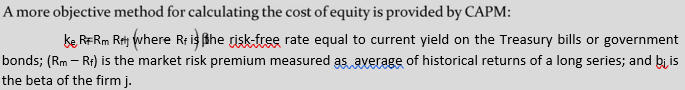
You may recall from an earlier chapter, that the CAPM provides an alternative approach for the calculation of the cost of equity. As per the CAPM, the required rate of return on equity is given by the following relationship:
![]()
Equation (17) requires the following three parameters to estimate a firm’s cost of equity:
The risk-free rate (Rf) The yields on the government Treasury securities are used as the risk-free rate. You can use returns either on the short-term or the long-term Treasury securities. It is a common practice to use the return on the short-term Treasury bills as the risk-free rate. Since investments are long-term decisions, many analysts prefer to use yields on long-term government bonds as the risk-free rate. You should always use the current risk-free rate rather than the historical average for calculating the cost of equity.
The market risk premium R–Rm f In practice, the market risk premium is measured as the difference between the long-term, historical arithmetic averages of market return and the risk-free rate. Some people use a market risk premium based on returns of the most recent years. This is not a correct procedure since the possibility of measurement errors and variability in the short-term, recent data is high. The variability (standard deviation) of the estimate of the market risk premium will reduce when you use long series of market returns and risk-free rates. If you use the current long-term government bonds as the risk-free rate, then the market risk premium should also be based on the historical average return of the long-term bond. On the other hand, if you use the current yield on short-term government bonds as the risk-free rate, then the market risk premium should also be based on the historical average yield of short-term government bonds. You should be consistent; you should match the estimation of the market risk premium with the maturity of the security used as the risk-free rate.
The beta of the firm’s share ( ) Beta ( ) is the systematic risk of an ordinary share in relation to the market. We have explained the methodology for calculating beta for an ordinary share. The share returns are regressed to the market returns to estimate beta. A broad-based index like the BSE’s Sensitivity Index (Sensex) is used as a proxy for the market.
Suppose in the year 2010 the risk-free rate is 6 per cent, the market risk premium is 9 per cent and beta of a company’s share is 1.54. The cost of equity for the company is: ke
![]()
COST OF EQUITY: CAPM vs DIVIDEND-GROWTH MODEL
The dividend-growth approach has limited application in practice because of its two assumptions. First, it assumes that the dividend per share will grow at a constant rate, g, forever. Second, the expected dividend growth rate, g, should be less than the cost of equity, ke, to arrive at the simple growth formula. That is:
These assumptions imply that the dividend-growth approach cannot be applied to those companies, which are not paying any dividends, or whose dividend per share is growing at a rate higher than ke, or whose dividend policies are highly volatile. The dividend-growth approach also fails to deal with risk directly. In contrast, the CAPM has a wider application although it is based on restrictive assumptions. The only condition for its use is that the company’s share is quoted on the stock exchange. Also, all variables in the CAPM are market determined and except the company specific share price data, they are common to all companies. The value of beta is determined in an objective manner by using sound statistical methods. One practical problem with the use of beta, however, is that it does not normally remain stable over time.
THE WEIGHTED AVERAGE COST OF CAPITAL
Once the component costs have been calculated, they are multiplied by the proportions of the respective sources of capital to obtain the weighted average cost of capital (WACC). The proportions of capital must be based on target capital structure. Target capital structure is the company desired mix of debt and equity, which it will maintain, on an average, over a period of time. WACC is the composite, or overall cost of capital. You may note that it is the weighted average concept, not the simple average, which is relevant in calculating the overall cost of capital. The simple average cost of capital is not appropriate to use because firms hardly use various sources of funds equally in the capital structure.
The following steps are involved for calculating the firm’s WACC:
Calculate the cost of specific sources of funds.
Multiply the cost of each source by its proportion in the capital structure.
Add the weighted component costs to get the WACC.
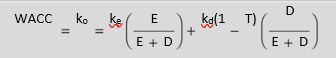
In financial decision making, the cost of capital should be calculated on an after-tax basis. Therefore, the component costs should be the after-tax costs. Notice that interest on debt is tax deductible and it saves taxes. Dividend on equity is not tax deductible. If we assume that a firm has only debt and equity in its capital structure, then the WACC (k0) will be:
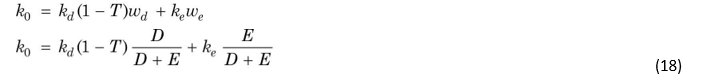
where k0 is the WACC, kd (1 – T) and ke are, respectively, the after-tax cost of debt and equity, D is the amount of debt and E is the amount of equity. In a general form, the formula for calculating WACC can be written as follows:
![]()
weights of various types of capital, employed by the company.
Book Value vs Market Value Weights
We should always use the market value weights to calculate WACC. In practice, firms do use the book value weights. Generally, there will be difference between the book value and market value weights, and therefore, WACC will be different. WACC, calculated using the book-value weights, will be understated if the market value of the share is higher than the book value and vice versa.
Suppose Lohia Chemicals Ltd has 4,50,00,000 equity shares outstanding and that the current market price per share is `20. Assume that the market values and the book values of debt and the preference share capital are the same. If the component costs were the same as before, the market value weighted average cost of capital would be about 15 per cent:
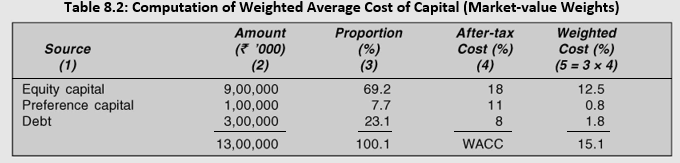
It should be noticed that the equity capital for Lohia Chemicals Ltd is the total market value of the ordinary shares outstanding, which includes retained earnings (reserves). It is obvious that the market value weighted cost of capital (15.1%) is higher than the book value weighted cost of capital (14.3%), because the market value of equity share capital (`90,00,00,000) is higher than its book value (`60,00,00,000).
Why Book Value Weights?
Why do managers prefer the book value weights for calculating WACC? Besides the simplicity of the use, managers claim following advantages for the book value weights:
Firms in practice set their target capital structure in terms of book values.
The book value information can be easily derived from the published sources. The book value debt–equity ratios are analysed by investors to evaluate the risk of the firms in practice.
The use of the book-value weights can be seriously questioned on theoretical grounds. First, the component costs are opportunity rates and are determined in the capital markets. The weights should also be market-determined. Second, the book-value weights are based on arbitrary accounting policies that are used to calculate retained earnings and value of assets. Thus, they do not reflect economic values. It is very difficult to justify the use of the book-value weights in theory.
Why Market Value Weights?
Market-value weights are theoretically superior to book-value weights. They reflect economic values and are not influenced by accounting policies. They are also consistent with the marketdetermined component costs. The difficulty in using market-value weights is that the market prices of securities fluctuate widely and frequently. A market-value-based target capital structure means that the amounts of debt and equity are continuously adjusted as the value of the firm changes.
Marginal Cost of Capital (MCC)
Marginal cost is the new or the incremental cost of new capital (equity and debt) issued by the firm. We assume that new funds are raised at new costs according to the firm’s target capital structure. Hence, what is commonly known as the WACC is in fact the weighted marginal cost of capital (WMCC); that is, the weighted average cost of new capital given the firm’s target capital structure.
Consider an example. A company has a target capital structure of 60 per cent equity and 40 per cent debt. The company is considering an investment project which requires funds of `200 crore. The internal funds (retained earnings) available for the project are `120 crore and the remaining funds will be met out of borrowing of `80 crore. The after-tax cost of debt is
8 per cent and the cost of equity is 15 per cent. The marginal cost of capital which the weighted cost of capital of the project given the target capital structure is: MCC = WACC = 0.15 × 0.6 + 0.08 × 0.4 = 0.122 or 12.2 per cent. Now suppose that the company has only `60 crore internal funds. As per the target capital structure, the equity funds needed for the project are `120 crore. Thus, the company will issue external equity of `60 crore. External equity will be expensive as compared to internal equity if the share issue price is less than the market price. Suppose the cost of external equity is 18 per cent. Now the marginal cost of capital, which is the weighted average cost of capital issued on the target capital structure will be:
MCC = WACC = 0.18 × 0.30 + 0.15 × 0.30 + 0.08 × 0.40
= 0.054 + 0.045 + 0.032 = 0.131 or 13.1 per cent
Summary
The cost of capital to a firm is the minimum return, which the suppliers of capital require. In other words, it is a price of obtaining capital; it is a compensation for time and risk.
The cost of capital concept is of vital significance in the financial decision making. It is used: (a) as a discount, or cutoff, rate for evaluating investment projects, (b) for designing the firm’s debtequity mix and (c) for appraising the top management’s financial performance.
Firms obtain capital for financing investments in the form of equity or debt or both. Also, in practice, they maintain a target debt–equity mix. Therefore, the firm’s cost of capital means the weighted average cost of debt and equity.
kd(1 T) where kd is beforetax cost of debt and T is the corporate tax rate.
Debt includes all interestbearing borrowings. Its cost is the yield (return), which lenders expect from their investment. In most cases, return is equal to annual contractual rate of interest (also called coupon rate). Interest charges are tax deductible. Therefore, cost of debt to the firm should be calculated after adjusting for interest tax shield:
Equity includes paidup capital and reserve and surplus (retained earnings). Equity has no explicit cost, as payment of dividends is not obligatory. However, it involves an opportunity cost.
The opportunity cost of equity is the rate of return required by shareholders on securities of comparable risk. Thus, it is a price, which the company must pay to attract capital from shareholders.
In practice, shareholders expect to receive dividends and capital gains. Therefore, the cost of equity can be thought to include expected dividend yield and percentage capital gain:
![]()
where DIV1 is the expected dividend per share, P0 is the market price today
ke P0
and g is the expected dividend growth (capital gain). The dividend growth rate, g, can be calculated as the product of the firm’s retention ratio and rate of return (ROE) in case of a totally equity financed firm. It can also be approximated by the past growth in earnings per share or dividend per share.
When a company issues new share capital, it has to offer shares at a price, which is less than the prevailing market price. Therefore, the cost of retained earnings will be less than the cost of new issue of equity.
Three steps are involved in calculating the firm’s weighted average cost of capital (WACC). First, the component costs of debt and equity are calculated. Second, weights to each component of capital are assigned according to the target capital structure. Third, the product of component costs and weights is summed up to determine WACC. The weighted average cost of new capital is the weighted marginal cost of capital (WMCC). WACC for a firm, which has debt and equity in the capital structure, is given by the following formula:
where ke is the cost of equity, kd is the cost of debt, T is the tax rate, D is debt and E is equity. The market value weights should be used in calculating WACC.
Marginal cost of capital is the new or incremental cost of capital using incremental weights. Since incremental weights depend on target capital structure, the marginal cost of capital is the weighted average cost of capital of incremental capital.
Review Questions
- Define cost of capital? Explain its significance in financial decision making.
- What are the various concepts of cost of capital? Why should they be distinguished in financial management?
- How is the cost of debt computed? How does it differ from the cost of preference capital?
- ‘The equity capital is cost free.’ Do you agree? Give reasons.
- The basic formula to calculate the cost of equity is: (DIV1/P0) + g. Explain its rationale.
- Are retained earnings less expensive than the new issue of ordinary shares? Give your views.
- What is the CAPM approach for calculating the cost of equity? What is the difference between this approach and the constant growth approach? Which one is better? Why?
- ‘Debt is the cheapest source of funds.’ Explain.
- How is the weighted average cost of capital calculated? What weights should be used in its calculation?
- Define the marginal cost of capital. Why is the marginal cost of capital referred to as the weighted average cost of new capital?