
INTRODUCTION
An efficient allocation of capital is the most important finance function in the modern times. It involves decisions to commit the firm’s funds to the long-term assets. Capital budgeting or investment decisions are of considerable importance to the firm, since they tend to determine its value by influencing its growth, profitability and risk. In this chapter we focus on the nature and evaluation of capital budgeting decisions.
NATURE OF CAPITAL BUDGETING
The investment decisions of a firm are generally known as the capital budgeting, or capital expenditure decisions. A capital budgeting decision may be defined as the firm’s decision to invest its current funds most efficiently in the long-term assets in anticipation of an expected flow of benefits over a series of years. The long-term assets are those that affect the firm’s operations beyond the one-year period. The firm’s investment decisions would generally include expansion, acquisition, modernization and replacement of the long-term assets. Sale of a division or business (divestment) is also as an investment decision. Decisions like the change in the methods of sales distribution, or an advertisement campaign or a research and development programme have long-term implications for the firm’s expenditures and benefits, and therefore, they should also be evaluated as investment decisions. It is important to note that investment in the long-term assets invariably requires large funds to be tied up in the current assets such as inventories and receivables. As such, investment in fixed and current assets is one single activity.
Features of Capital Budgeting Decisions
The following are the features of capital budgeting decisions:
The funds are invested in long-term assets
The exchange of current funds for future benefits
The future benefits will occur to the firm over a series of years
It is significant to emphasize that expenditures and benefits of an investment should be measured in cash. In the investment analysis, it is cash flow, which is important, and not the accounting profit. It may also be pointed out that investment decisions affect the firm’s value. The firm’s value will increase if investments are profitable and add to the shareholders’ wealth. Thus, investments should be evaluated on the basis of a criterion, which is compatible with the objective of the Shareholder Wealth Maximization. An investment will add to the shareholders’ wealth if it yields benefits in excess of the minimum benefits as per the opportunity cost of capital. In this chapter, we assume that the investment project’s opportunity cost of capital is known. We also assume that the expenditures and benefits of the investment are known with certainty. Both these assumptions are relaxed in later chapters.
Importance of Capital Budgeting Decisions
Investment decisions require special attention because of the following reasons:1
They influence the firm’s growth in the long run
They affect the risk of the firm
They involve commitment of large amount of funds
They are irreversible, or reversible at substantial loss
They are among the most difficult decisions to make
Growth
The effects of investment decisions extend into the future and have to be endured for a longer period than the consequences of the current operating expenditure. A firm’s decision to invest in long-term assets has a decisive influence on the rate and direction of its growth. A wrong decision can prove disastrous for the continued survival of the firm; unwanted or unprofitable expansion of assets will result in heavy operating costs to the firm. On the other hand, inadequate investment in assets would make it difficult for the firm to compete successfully and maintain its market share.
Risk
A long-term commitment of funds may also change the risk of the firm. If the adoption of an investment increases average gain but causes frequent fluctuations in its earnings, the firm will become more risky. Thus, investment decisions shape the basic character of a firm.
Funding
Investment decisions generally involve large amount of funds, which make it imperative for the firm to plan its investment programmes very carefully and make an advance arrangement for procuring finances internally or externally.
Irreversibility
Most investment decisions are irreversible. It is difficult to find a market for such capital items once they have been acquired. The firm will incur heavy losses if such assets are scrapped.
Complexity
Investment decisions are among the firm’s most difficult decisions. They are an assessment of future events, which are difficult to predict. It is really a complex problem to correctly estimate the future cash flows of an investment. Economic, political, social and technological forces cause the uncertainty in cash flow estimation.
Check Your Concepts
- Define a capital budgeting decision.
- State the features of capital budgeting decisions.
- Why are capital budgeting decisions considered significant for the firm?
TYPES OF CAPITAL BUDGETING DECISIONS
There are many ways to classify investments. One classification is as follows:
Expansion of existing business or creating new business
Replacement and modernization
Expansion and Diversification
A company may add capacity to its existing product lines to expand existing operations. For example, the Gujarat State Fertilizer Company (GSFC) may increase its plant capacity to manufacture more urea. It is an example of related diversification. A firm may expand its activities in a new business. Expansion of a new business requires investment in new products and a new kind of production activity within the firm. If a packaging manufacturing company invests in a new plant and machinery to produce ball bearings, which the firm has not manufactured before, this represents expansion of new business or unrelated diversification. Sometimes a company acquires existing firms to expand its business. In either case, the firm makes investment in the expectation of additional revenue. Investments in existing or new products may also be called as revenue-expansion investments.
Replacement and Modernization
The main objective of modernization and replacement is to improve operating efficiency and reduce costs. Cost savings will reflect in the increased profits, but the firm’s revenue may remain unchanged. Assets become outdated and obsolete with technological changes. The firm must decide to replace those assets with new assets that operate more economically. If a cement company changes from semi-automatic drying equipment to fully automatic drying equipment, it is an example of modernization and replacement. Replacement decisions help to introduce more efficient and economical assets and therefore, are also called cost-reduction investments. However, replacement decisions that involve substantial modernization and technological improvements expand revenues as well as reduce costs.
Mutually exclusive investments
Independent investments
Contingent investments
Mutually Exclusive Investments
Mutually exclusive investments serve the same purpose and compete with each other. If one investment is undertaken, others will have to be excluded. A company may, for example, either use a more labour-intensive, semi-automatic machine, or employ a more capitalintensive, highly automatic machine for production. Choosing the semi-automatic machine precludes the acceptance of the highly automatic machine.
Independent Investments
Contingent Investments
Independent investments serve different purposes and do not compete with each other. For example, a heavy engineering company may be considering expansion of its plant capacity to manufacture additional excavators and addition of new production facilities to manufacture a new product—light commercial vehicles. Depending on their profitability and availability of funds, the company can undertake both investments.
Contingent investments are dependent projects; the choice of one investment necessitates undertaking one or more other investments. For example, if a company decides to build a factory in a remote, backward area, it may have to invest in houses, roads, hospitals, schools, etc., for the employees to attract the work force. Thus, building of factory also requires investment in facilities for employees. The total expenditure will be treated as one single investment.
Check Your Concepts
- Briefly explain the following types of investments: (i) expansion; (ii) diversification; (iii) modernization; and (iv) replacement.
- What is the difference between independent and contingent investments?
- What are mutually exclusive investments?
INVESTMENT EVALUATION CRITERIA
Three steps are involved in the evaluation of an investment:
Estimation of cash flows
Estimation of the required rate of return (the opportunity cost of capital) Application of a decision rule for making the choice
The first two steps are discussed in subsequent chapters. Our discussion in this chapter is confined to the third step. Specifically, we focus on the merits and demerits of various decision criteria or rules.
Investment Decision Rules
The investment decision rules may be referred to as capital budgeting techniques, or investment criteria. A sound appraisal technique should be used to measure the economic worth of an investment project. The essential property of a sound technique is that it should maximize the shareholders’ wealth. The following other characteristics should also be possessed by a sound investment evaluation criterion:2
It should consider all cash flows to determine the true profitability of the project. It should provide for an objective and unambiguous way of separating good projects from bad projects.
It should help ranking of projects according to their true profitability.
It should recognize the fact that bigger cash flows are preferable to smaller ones and early cash flows are preferable to later ones.
It should help to choose among mutually exclusive projects that project which maximizes the shareholders’ wealth.
It should be a criterion which is applicable to any conceivable investment project, independent of others.
These conditions will be clarified as we discuss the features of various investment criteria in the following pages.
Evaluation Criteria
A number of investment criteria (or capital budgeting techniques) are in use in practice. They may be grouped in the following two categories:
- Discounted Cash Flow (DCF) Criteria
Net present value (NPV)
Profitability index (PI)
Internal rate of return (IRR)
- Non-discounted Cash Flow Criteria
Payback (PB)
Discounted payback
Accounting rate of return (ARR)
Discounted payback is a variation of the payback method. It involves discounted cash flows, but, as we shall see later, it is not a true measure of investment profitability. We will show in the following pages that the net present value criterion is the most valid technique of evaluating an investment project. It is consistent with the objective of maximizing the shareholders’ wealth.
Check Your Concepts
- State three important steps in the evaluation of investments.
- What rules should be followed in making investment decisions?
- What is meant by the DCF criteria? State the DCF and non-DCF criteria of investment evaluation.
NET PRESENT VALUE
The net present value (NPV) method is the classic economic method of evaluating the investment proposals. It is a DCF technique that explicitly recognizes the time value of money. It correctly postulates that cash flows arising at different time periods differ in value and are comparable only when their equivalents—present values—are found out. The following steps are involved in the calculation of NPV:
Cash flows of the investment project should be forecasted based on realistic assumptions. Appropriate discount rate should be identified to discount the forecasted cash flows. The appropriate discount rate is the project’s opportunity cost of capital, which is equal to the required rate of return expected by investors on investments of equivalent risk. Present value of cash flows should be calculated using the opportunity cost of capital as the discount rate.
Net present value should be found out by subtracting present value of cash outflows from present value of cash inflows. The project should be accepted if NPV is positive (i.e., NPV > 0).
Let us consider an example.
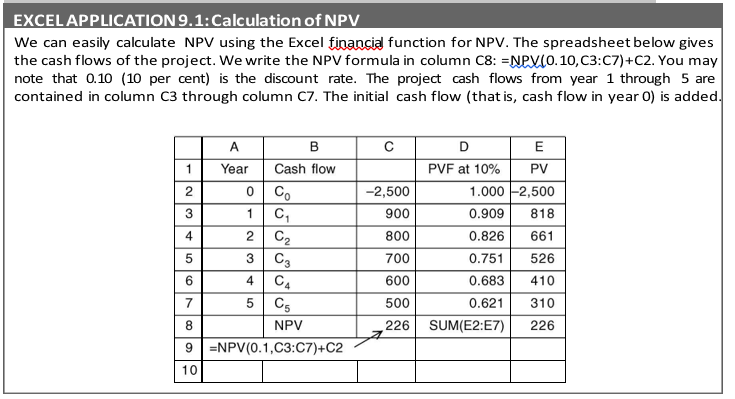
ILLUSTRATION 9.1: Calculating Net Present Value
Assume that Project X costs `2,500 now and is expected to generate year-end cash inflows of `900, `800, `700, `600 and `500 in years 1 through 5. The opportunity cost of the capital may be assumed to be 10 per cent.
The net present value for Project X can be calculated by referring to the present value table (Table C at the end of the book). The calculations are shown below:
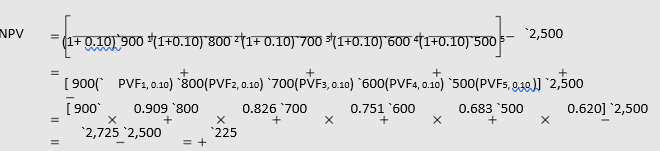
Project X’s present value of cash inflows (`2,725) is greater than that of cash outflow (`2,500). Thus, it generates a positive net present value (NPV = +`225). Project X adds to the wealth of owners; therefore, it should be accepted.
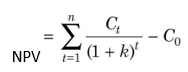
The formula for the net present value can be written as follows:

where C1, C2… represent net cash inflows in year 1, 2…, k is the opportunity cost of capital, C0 is the initial cost of the investment and n is the expected life of the investment. It should be noted that the cost of capital, k, is assumed to be known and is constant.
Why is NPV Important?
A question may be raised: why should a financial manager invest `2,500 in Project X? Project X should be undertaken if it is best for the company’s shareholders; they would like their shares to be as valuable as possible. Let us assume that the total market value of a hypothetical company is `10,000, which includes `2,500 cash that can be invested in Project X. Thus the value of the company’s other assets must be `7,500. The company has to decide whether it should spend cash and accept Project X or to keep the cash and reject Project X. Clearly Project X is desirable since its PV (`2,725) is greater than the `2,500 cash. If Project X is accepted, the total market value of the firm will be: `7,500 + PV of Project X = `7,500 + `2,725 = `10,225; that is, an increase by `225. The company’s total market value would remain only `10,000 if Project X was rejected.
Why should the present value of Project X reflect in the company’s market value? To answer this question, let us assume that a new company X with Project X as the only asset is formed. What is the value of the company? We know from our earlier discussion on valuation of shares that the market value of a company’s shares is equal to the present value of the expected dividends. Since Project X is the only asset of company X, the expected dividends would be equal to the forecasted cash flows from Project X. Investors would discount the forecasted dividends at a rate of return expected on securities equivalent in risk to company X. The rate used by investors to discount dividends is exactly the rate, which we should use to discount cash flows of Project X. The calculation of the PV of Project X is a replication of the process, which shareholders will be following in valuing the shares of company X. Once we find out the value of Project X, as a separate venture, we can add it to the value of other assets to find out the portfolio value.
The difficult part in the calculation of the PV of an investment project is the precise measurement of the discount rate. Funds available with a company can either be invested in projects or given to shareholders. Shareholders can invest funds distributed to them in financial assets. Therefore, the discount rate is the opportunity cost of investing in projects rather than in capital markets. Obviously, the opportunity cost concept makes sense when financial assets are of equivalent risk as compared to the project.
An alternate interpretation of the positive net present value of an investment is that it represents the maximum amount a firm would be ready to pay for purchasing the opportunity of making investment, or the amount at which the firm would be willing to sell the right to invest without being financially worse-off. The net present value (`225) can also be interpreted to represent the amount the firm could raise at the required rate of return (10%), in addition to the initial cash outlay (`2,500), to distribute immediately to its shareholders and by the
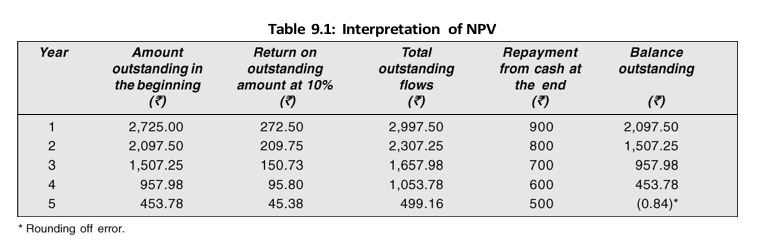
end of the projects’ life, to have paid off all the capital raised and return on it.3 The point is illustrated by the calculations shown in Table 9.1.
The calculations in Table 9.1 are based on the assumption that the firm chooses to receive the cash benefit resulting from the investment in the year it is made. Any pattern of cash receipts, such that the net present value is equal to `225, can be selected. Thus, if the firm raises `2,500 (the initial outlay) instead of `2,725 (initial outlay plus net present value) at 10 per cent rate of return, at the end of fifth year after having paid the principal sum together with interest, it would be left with `363, whose present value at the beginning of the first year at 10 per cent discount rate is `225. It should be noted that the gain to shareholders would be more if the rate of raising money is less than 10 per cent. Why?
Acceptance Rule
It should be clear that the acceptance rule using the NPV method is to accept the investment project if its net present value is positive (NPV > 0) and to reject it if the net present value is negative (NPV < 0). Positive NPV contributes to the net wealth of the shareholders, which should result in the increased price of a firm’s share. The positive net present value will result only if the project generates cash inflows at a rate higher than the opportunity cost of capital. A project with zero NPV (NPV = 0) may be accepted. A zero NPV implies that project generates cash flows at a rate just equal to the opportunity cost of capital. The NPV acceptance rules are:
Accept the project when NPV is positive NPV > 0 Reject the project when NPV is negative NPV < 0
May accept the project when NPV is zero NPV = 0
The NPV method can be used to select between mutually exclusive projects; the one with the higher NPV should be selected. Using the NPV method, projects would be ranked in order of net present values; that is, first rank will be given to the project with highest positive net present value and so on.
Evaluation of the NPV Method
NPV is the true measure of an investment’s profitability. It provides the most acceptable investment rule for the following reasons:
Time valueIt recognizes the time value of money—a rupee received today is worth more than a rupee received tomorrow.
Measure of true profitability It uses all cash flows occurring over the entire life of the project in calculating its worth. Hence, it is a measure of the project’s true profitability. The NPV method relies on estimated cash flows and the discount rate rather than any arbitrary assumptions, or subjective considerations.
Value-additivityThe discounting process facilitates measuring cash flows in terms of present values; that is, in terms of equivalent, current rupees. Therefore, the NPVs of projects can be added. For example, NPV (A + B) = NPV (A) + NPV (B). This is called the value-additivity principle. It implies that if we know the NPVs of individual projects, the value of the firm will increase by the sum of their NPVs. We can also say that if we know values of individual assets, the firm’s value can simply be found by adding their values. The value-additivity is an important property of an investment criterion because it means that each project can be evaluated, independent of others, on its own merit.
Shareholder valueThe NPV method is always consistent with the objective of the shareholder value maximization. This is the greatest virtue of the method.
Are there any limitations in using the NPV rule? The NPV method is a theoretically sound method. In practice, however, it may pose some computational problems.
Cash flow estimationThe NPV method is easy to use if forecasted cash flows are known. In practice, it is quite difficult to obtain the estimates of cash flows due to uncertainty.
Discount rateIt is also difficult in practice to precisely measure the discount rate.
Mutually exclusive projectsCaution needs to be applied in using the NPV method when alternative (mutually exclusive) projects with unequal lives, or under funds constraint are evaluated. The NPV rule may not give unambiguous results in these situations. These problems are discussed in a later chapter.
Ranking of projectsIt should be noted that the ranking of investment projects as per the NPV rule is not independent of the discount rates.4 Let us consider an example.
Suppose there are two projects—A and B—both costing `50 each. Project A returns `100 after one year and `25 after two years. On the other hand, Project B returns `30 after one year and `100 after two years. At discount rates of 5 per cent and 10 per cent, the NPV of projects and their ranking are as follows:

It can be seen that the project ranking is reversed when the discount rate is changed from 5 per cent to 10 per cent. The reason lies in the cash flow patterns. The impact of the discounting becomes more severe for the cash flow occurring later in the life of the project; the higher is the discount rate, the higher would be the discounting impact. In the case of Project B, the larger cash flows come later in the life. Their present value will decline as the discount rate increases.
Check Your Concepts
- State the steps in the calculation of NPV.
- What does positive NPV imply? Why is NPV important?
- Explain the concept of value-additivity in the NPV method.
- Explain the merits and demerits of the NPV method.
INTERNAL RATE OF RETURN
The internal rate of return (IRR) method is another discounted cash flow technique, which takes account of the magnitude and timing of cash flows.5 Other terms used to describe the IRR method are yield on an investment, marginal efficiency of capital, rate of return over cost, time-adjusted rate of return and so on. The concept of internal rate of return is quite simple to understand in the case of a one-period project. Assume that you deposit `10,000 with a bank and would get back `10,800 after one year. The true rate of return on your investment would be:
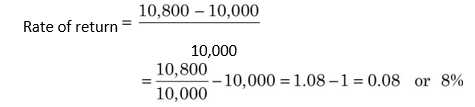
The amount that you would obtain in the future (`10,800) would consist of your investment (`10,000) plus return on your investment (0.08 × `10,000):
10,000 (1.08) = 10,800
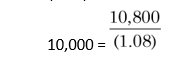
You may observe that the rate of return of your investment (8 per cent) makes the discounted (present) value of your cash inflow (`10,800) equal to your investment (`10,000).
We can now develop a formula for the rate of return (r) on an investment (C0) that generates a single cash flow after one period (C1) as follows:
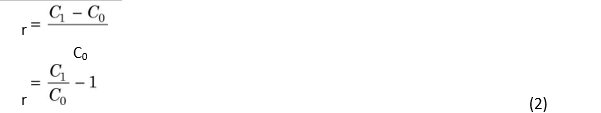
Equation (2) can be rewritten as follows:
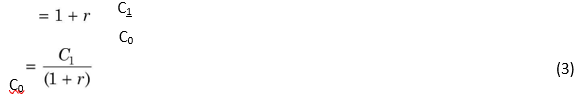
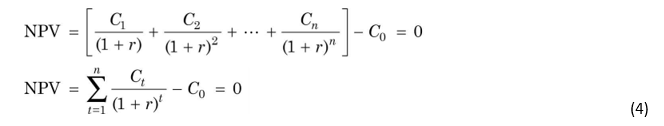
From Equation (3), you may notice that the rate of return, r, depends on the project’s cash flows, rather than any outside factor. Therefore, it is referred to as the internal rate of return. The internal rate of return (IRR) is the rate that equates the investment outlay with the present value of cash inflow. This also implies that the rate of return is the discount rate which makes NPV = 0. There is no satisfactory way of defining the true rate of return of a long-term asset. IRR is the best available concept. We shall see that although it is a very frequently used concept in finance, yet at times it can be a misleading measure of an investment’s worth.6 IRR can be determined by solving the following equation for r:
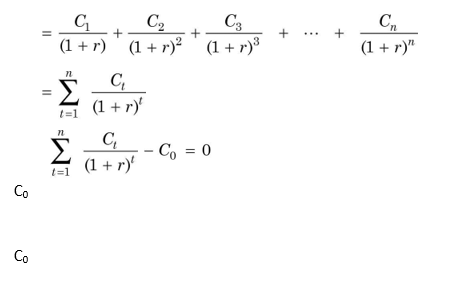
It can be noticed that the IRR equation is the same as the one used for the NPV method. In the NPV method, the required rate of return, k, is known and the net present value is found, while in the IRR method the value of r has to be determined at which the net present value becomes zero.
Uneven Cash Flows: Calculating IRR by Trial and Error
The value of r in Equation (4) can be found out by trial and error. The approach is to select any discount rate to compute the present value of cash inflows. If the calculated present value of the expected cash inflow is lower than the present value of cash outflows, a lower rate should be tried. On the other hand, a higher value should be tried if the present value of inflows is higher than the present value of outflows. This process will be repeated unless the net present value becomes zero. The following illustration explains the procedure of calculating IRR.
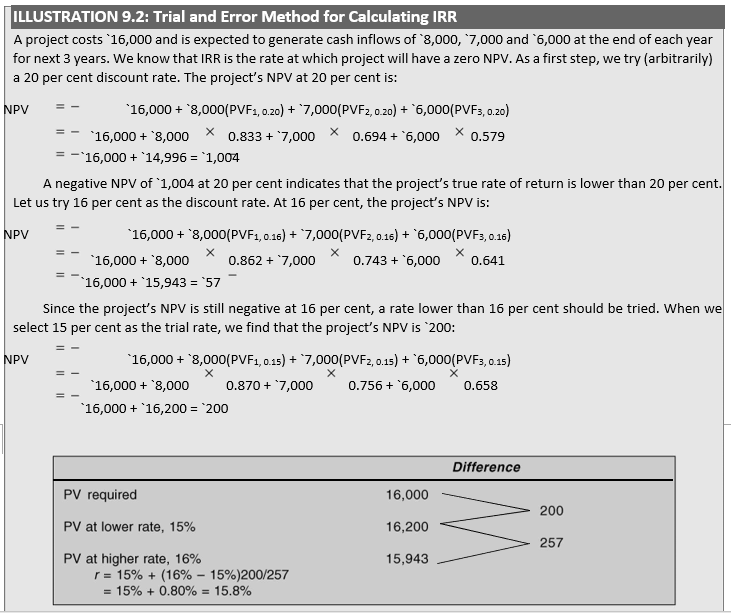
The true rate of return should lie between 15–16 per cent. We can find out a close approximation of the rate of return by the method of linear interpolation as follows:
Level Cash Flows
An easy procedure can be followed to calculate the IRR for a project that produces level or equal cash flows each period. To illustrate, let us assume that an investment would cost `20,000 and provide annual cash inflow of `5,430 for 6 years. If the opportunity cost of capital is 10 per cent, what is the investment’s NPV? The `5,430 is an annuity for 6 years. The NPV can be found as follows:

The rate, which gives a PVFA of 3.683 for 6 years, is the project’s internal rate of return. Looking up PVFA in Table D (given at the end of the book) across the 6-year row, we find it approximately under the 16 per cent column. Thus, 16 per cent is the project’s IRR that equates the present value of the initial cash outlay (`20,000) with the constant annual cash inflows (`5,430 per year) for 6 years.
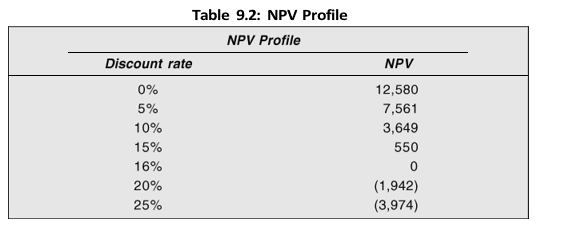
NPV Profile and IRR
We again emphasize that NPV of a project declines as the discount rate increases, and for discount rates higher than the project’s IRR, NPV will be negative. NPV profile of the project referred above at various discount rates is shown in Table 9.2 and Figure 9.1. At 16 per cent, the NPV is zero; therefore, it is the IRR of the project. We have used the Excel spreadsheet to make the computations and create the chart using the Excel chart wizard.
Acceptance Rule
The accept-or-reject rule, using the IRR method, is to accept the project if its internal rate of return is higher than the opportunity cost of capital (r > k). Note that k is also known as the required rate of return, or the cut-off, or hurdle rate. The project shall be rejected if its internal rate of return is lower than the opportunity cost of capital (r < k). The decision maker may remain indifferent if the internal rate of return is equal to the opportunity cost of capital (r = k). Thus the IRR acceptance rules are:
Accept the project when r > k
Reject the project when r < k
May accept the project when r = k
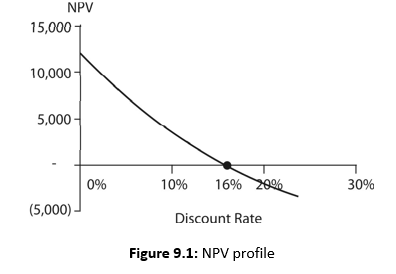
The reasoning for the acceptance rule becomes clear if we plot NPVs and discount rates for the project given in Table 9.2 on a graph like Figure 9.1. It can be seen that if the discount rate is less than 16 per cent IRR, then the project has positive NPV; if it is equal to IRR, the project has a zero NPV; and if it is greater than IRR, the project has negative NPV. Thus, when we compare the IRR of the project with the opportunity cost of capital, we are in fact trying to ascertain whether the project’s NPV is positive or not. In case of independent projects, IRR and NPV rules will give the same results if the firm has no shortage of funds.
Evaluation of IRR Method
IRR method is like the NPV method. It is a popular investment criterion since it measures profitability as a percentage and can be easily compared with the opportunity cost of capital. IRR method has following merits:
Time valueThe IRR method recognizes the time value of money.
Profitability measureIt considers all cash flows occurring over the entire life of the project to calculate its rate of return.
Acceptance ruleIt generally gives the same acceptance rule as the NPV method.
Shareholder value It is consistent with the Shareholder Wealth Maximization objective. Whenever a project’s IRR is greater than the opportunity cost of capital, the shareholders’ wealth will be enhanced.
Like the NPV method, the IRR method is also theoretically a sound investment evaluation criterion. However, IRR rule can give misleading and inconsistent results under certain circumstances. Here we briefly mention the problems that IRR method may suffer from.
Multiple rates A project may have multiple rates, or it may not have a unique rate of return. As we explain later on, these problems arise because of the mathematics of IRR computation.
Mutually exclusive projectsIt may also fail to indicate a correct choice between mutually exclusive projects under certain situations. This pitfall of the IRR method is elaborated later on in this chapter.
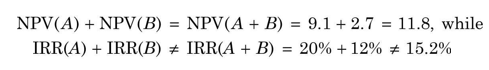
Value additivity Unlike in the case of the NPV method, the value additivity principle does not hold when the IRR method is used—IRRs of projects do not add.7 Thus, for Projects A and B, IRR(A) + IRR(B) will not be equal to IRR (A + B). Consider an example given below.
The NPV and IRR of Projects A and B are given below:
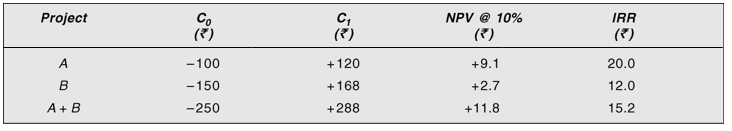
It can be seen from the example that NPVs of projects add:
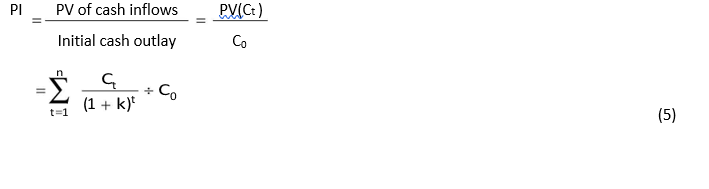
PROFITABILITY INDEX
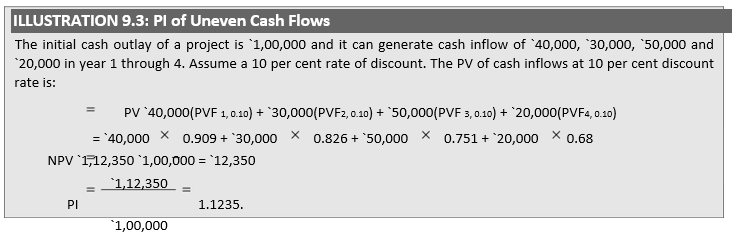
Yet another time-adjusted method of evaluating the investment proposals is the benefit – cost (B/C) ratio or profitability index (PI). Profitability index is the ratio of the present value of cash inflows, at the required rate of return, to the initial cash outflow of the investment. The formula for calculating benefit–cost ratio or profitability index is as follows:
Evaluation of PI Method
Like the NPV and IRR rules, PI is a conceptually sound method of appraising investment projects. It is a variation of the NPV method, and requires the same computations as the NPV method.
Time valueIt recognizes the time value of money.
Value maximization It is consistent with the shareholder value maximization principle. A project with PI greater than one will have positive NPV and if accepted, it will increase shareholders’ wealth.
Relative profitability In the PI method, since the present value of cash inflows is divided by the initial cash outflow, it is a relative measure of a project’s profitability. Like NPV method, PI criterion also requires calculation of cash flows and estimate of the discount rate. In practice, the estimation of cash flows and discount rate poses problems.
Check Your Concepts
- Define profitability index (PI). Why is it called benefit–cost ratio?
- Will PI be greater or lesser than one if a project’s NPV is (i) negative; (ii) zero; (iii) positive?
- What are the merits of PI method?
PAYBACK
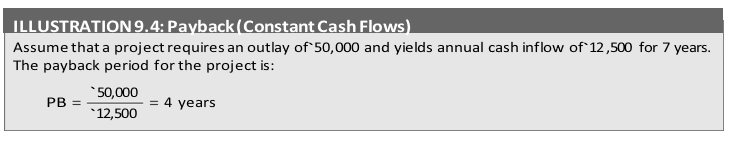
The payback (PB) is one of the most popular and widely recognized traditional methods of evaluating investment proposals. Payback is the number of years required to recover the original cash outlay invested in a project. If the project generates constant annual cash inflows, the payback period can be computed by dividing cash outlay by the annual cash inflow. That is:

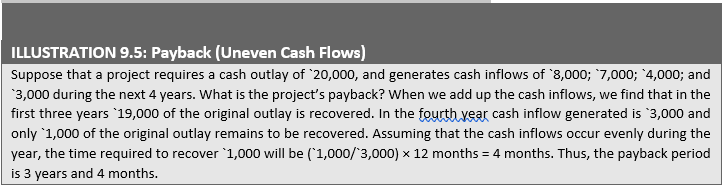
Unequal Cash Flows
In case of unequal cash inflows, the payback period can be found out by adding up the cash inflows until the total is equal to the initial cash outlay. Consider the following example.
Acceptance Rule
Many firms use the payback period as an investment evaluation criterion and a method of ranking projects. They compare the project’s payback with a predetermined, standard payback. The project would be accepted if its payback period is less than the maximum or standard payback period set by management. As a ranking method, it gives highest ranking to the project, which has the shortest payback period and lowest ranking to the project with highest payback period. Thus, if the firm has to choose between two mutually exclusive projects, the project with shorter payback period will be selected.
Evaluation of Payback
Payback is a popular investment criterion in practice. It is considered to have certain virtues.
SimplicityThe most significant merit of payback is that it is simple to understand and easy to calculate. The business executives consider the simplicity of method as a virtue. This is evident from their heavy reliance on it for appraising investment proposals in practice.
Cost effective Payback method costs less than most of the sophisticated techniques that require a lot of the analysts’ time and the use of computers.
Short-term effects A company can have more favourable short-run effects on earnings per share by setting up a shorter standard payback period.8 It should, however, be remembered that this may not be a wise long-term policy as the company may have to sacrifice its future growth for current earnings.
Risk shieldThe risk of the project can be tackled by having a shorter standard payback period as it may ensure guarantee against loss. A company has to invest in many projects where the cash inflows and life expectancies are highly uncertain. Under such circumstances, payback may become important, not so much as a measure of profitability but as a means of establishing an upper bound on the acceptable degree of risk.9 Liquidity The emphasis in payback is on the early recovery of the investment. Thus, it gives an insight into the liquidity of the project. The funds so released can be put to other uses.
In spite of its simplicity and the so-called virtues, the payback may not be a desirable investment criterion since it suffers from a number of serious limitations:
Cash flows after paybackPayback fails to take account of the cash inflows earned after the payback period. For example, consider the following projects X and Y:
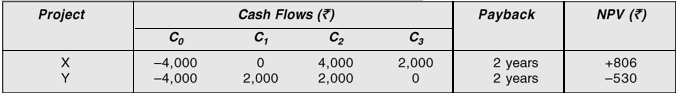
As per the payback rule, both the projects are equally desirable since both return the investment outlay in two years. If we assume an opportunity cost of 10 per cent, Project X yields a positive net present value of `806 and Project Y yields a negative net present value of `530. As per the NPV rule, Project X should be accepted and Project Y rejected. The payback rule gave wrong results because it failed to consider `2,000 cash flow in the third year for Project X.
Cash flows ignored Payback is not an appropriate method of measuring the profitability of an investment project as it does not consider all cash inflows yielded by the project. Considering Project X again, payback rule did not take into account its entire series of cash flows.
Cash flow patterns Payback fails to consider the pattern of cash inflows, i.e., magnitude and timing of cash inflows. In other words, it gives equal weights to returns of equal amounts even though they occur in different time periods. For example, compare the following projects C and D where they involve equal cash outlay and yield equal total cash inflows over equal time periods:
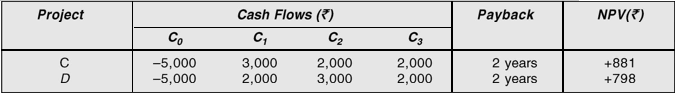
Using payback period, both projects are equally desirable. But Project C should be preferable as larger cash inflows will come earlier in its life. This is indicated by the NPV rule; Project C has higher NPV (`881) than Project D (`798) at 10 per cent opportunity cost. It should be thus clear that payback is not a measure of profitability. As such, it is dangerous to use it as a decision criterion.
Administrative difficulties A firm may face difficulties in determining the maximum acceptable payback period. There is no rational basis for setting a maximum payback period. It is generally a subjective decision.
Inconsistent with shareholder value Payback is not consistent with the objective of maximizing the market value of the firm’s shares. Share values do not depend on payback periods of investment projects.10
Let us re-emphasize that the payback is not a valid method for evaluating the acceptability of the investment projects. It can, however, be used along with the NPV rule as a first step in screening the projects roughly. In practice, the use of DCF techniques has been increasing but payback continues to remain a popular and primary method of investment evaluation.
DISCOUNTED PAYBACK
One of the serious objections to the payback method is that it does not discount the cash flows for calculating the payback period. We can discount cash flows and then calculate the payback. The discounted payback period is the number of periods taken in recovering the investment outlay on the present value basis. The discounted payback period still fails to consider the cash flows occurring after the payback period.
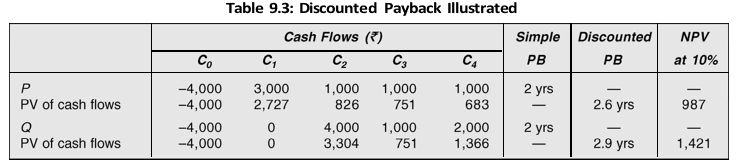
Let us consider an example. Projects P and Q involve the same outlay of `4,000 each. The opportunity cost of capital may be assumed as 10 per cent. The cash flows of the projects and their discounted payback periods are shown in Table 9.3.
The projects indicated are of same desirability by the simple payback period. When cash flows are discounted to calculate the discounted payback period, Project P recovers the investment outlay faster than Project Q, and therefore, it would be preferred over Project Q. Discounted payback period for a project will be always higher than simple payback period because its calculation is based on the discounted cash flows. Discounted payback rule is better as it discounts the cash flows until the outlay is recovered. But it does not help much. It does not take into consideration the entire series of cash flows. It can be seen in our example that if we use the NPV rule, Project Q (with the higher discounted payback period) is better.
ACCOUNTING RATE OF RETURN
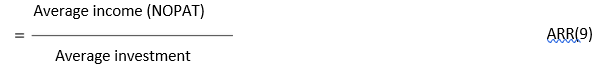
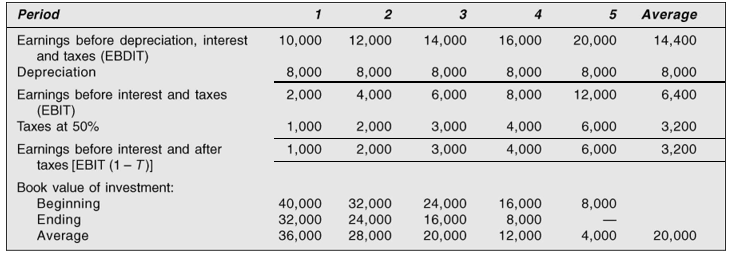
The accounting rate of return (ARR), also known as the return on investment (ROI), uses accounting information, as revealed by financial statements, to measure the profitability of an investment. The accounting rate of return is the ratio of the average net operating aftertax profit (NOPAT), divided by the average investment. The average investment would be equal to half of the original investment if it were depreciated constantly. Alternatively, it can be found out by dividing the total of the investment’s book values after depreciation by the life of the project. The accounting rate of return, thus, is an average rate and can be determined by the following equation:
In Equation (9), average income should be defined in terms of earnings after taxes without an adjustment for interest, viz., EBIT (1 – T) or net operating profit after tax. Thus:
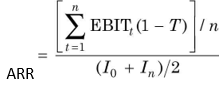
where EBIT is earnings before interest and taxes, T tax rate, I0 book value of investment in the beginning, In book value of investment at the end of n number of years.*\
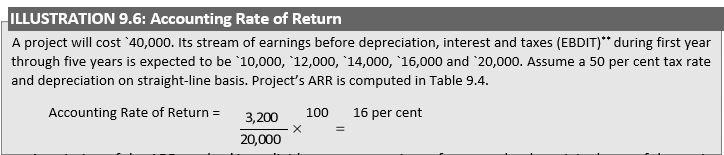
A variation of the ARR method is to divide average earnings after taxes by the original cost of the project instead of the average cost. Thus, using this version, the ARR in Illustration 9.6 would be: `3,200 ÷ `40,000 × 100 = 8 per cent. This version of the ARR method is less consistent as earnings are averaged but investment is not.11
Table 9.4: Calculation of Accounting Rate of Return
Acceptance Rule
As an accept-or-reject criterion, this method will accept all those projects whose ARR is higher than the minimum rate established by the management and reject those projects which have ARR less than the minimum rate. This method would rank a project as number one if it has highest ARR and lowest rank would be assigned to the project with lowest ARR.
Evaluation of ARR Method
The ARR method may claim some merits:
Simplicity The ARR method is simple to understand and use. It does not involve complicated computations.
Accounting dataThe ARR can be readily calculated from the accounting data; unlike in the NPV and IRR methods, no adjustments are required to arrive at cash flows of the project.
Accounting profitability The ARR rule incorporates the entire stream of income in calculating the project’s profitability.

The ARR is a method commonly understood by accountants, and frequently used as a performance measure. As a decision criterion, however, it has serious shortcomings.
Cash flows ignoredThe ARR method uses accounting profits, not cash flows, in appraising the projects. Accounting profits are based on arbitrary assumptions and choices and also include non-cash items. It is, therefore, inappropriate to rely on them for measuring the acceptability of the investment projects.
Time value ignoredThe averaging of income ignores the time value of money. In fact, this procedure gives more weightage to the distant receipts.
Arbitrary cut-offThe firm employing the ARR rule uses an arbitrary cut-off yardstick. Generally, the yardstick is the firm’s current return on its assets (book value). Because of this, the growth companies earning very high rates on their existing assets may reject profitable projects (i.e., with positive NPVs) and the less profitable companies may accept bad projects (i.e., with negative NPVs).
The ARR method continues to be used as a performance evaluation and control measure in practice. But its use as an investment criterion is certainly undesirable. It may lead to unprofitable allocation of capital.
NPV VS IRR
Equivalence of NPV and IRR: Case of Conventional Independent Projects
The net present value and the internal rate of return methods are two closely related investment criteria. Both are time-adjusted methods of measuring an investment’s worth. In case of independent projects, two methods lead to same decisions. However, under certain situations (to be discussed later in this section), a conflict arises between them. It is under these cases that a choice between the two criteria has to be made.
It is important to distinguish between conventional and non-conventional investments in discussing the comparison between NPV and IRR methods. A conventional investment can be defined as one whose cash flows take the pattern of an initial cash outlay followed by cash inflows. Conventional projects have only one change in the sign of cash flows; for example, the initial outflow followed by inflows, i.e., – + + +. A non-conventional investment, on the other hand, is one, which has cash outflows mingled with cash inflows throughout the life of the project.12 Non-conventional investments have more than one change in the signs of cash flows; for example, – + + + – ++ – +.
In case of conventional investments, which are economically independent of each other, NPV and IRR methods result in same accept-or-reject decision if the firm is not constrained for funds in accepting all profitable projects. Same projects would be indicated profitable by both methods. The logic is simple to understand. As has been explained earlier, all projects with positive net present values would be accepted if the NPV method is used, or projects with internal rates of return higher than the required rate of return would be accepted if the IRR method were followed. The last or marginal project acceptable under the NPV method is the one, which has zero net present value; while using the IRR method, this project will have an internal rate of return equal to the required rate of return. Projects with positive net present values would also have internal rates of return higher than the required rate of return and the marginal project will have zero present value only when its internal rate of return is equal to the required rate of return.
We know that NPV is:
and IRR is that rate r which satisfies the following equation:

Subtracting Equation (4) from Equation (1), we get:

As we know that Ct, k, r and t are positive, NPV can be positive (NPV > 0) only if r > k. NPV would be zero if and only if r = k and it would be negative (NPV < 0) if r < k. Thus, we find that NPV and IRR methods are equivalent as regards the acceptance or rejection of independent conventional investments.
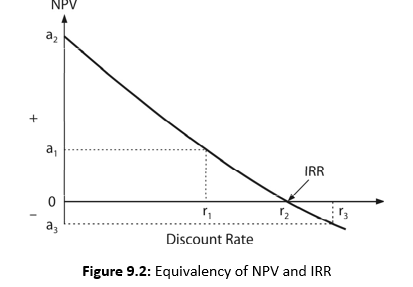
Figure 9.2 also substantiates this argument where a2 represents the highest net present value for the project at zero discount rate; at this point NPV is simply the difference between cash inflows and cash outflows. At r2, discount rate, the net present value is zero and therefore, by definition, r2 is the internal rate of return of the project. For discount rate (say r3) greater than IRR, the net present value would be negative (a3). Conversely, for discount rate (say r1) lower than IRR, the net present value of the project will be positive (a1). Thus, if the required rate of return is r1, the project will be accepted under both methods since the net present value, a1, is greater than zero and internal rate, r2, exceeds the required rate, r1. Project could also be accepted if the required rate is r2 as net present value is zero and the required rate and internal rate are equal. But the project would be rejected under either method if the required rate is r3 as the net present value is negative (a3) and the internal rate of return is lower than the required rate of return (i.e., r2 < r3).
Non-conventional Investments: Problem of Multiple IRRs
A serious shortcoming of the IRR method, when used to evaluate non-conventional investments, is that it can yield multiple internal rates of return.13 The reason for more than one rate of return solution lies in the algebra of the IRR equation. As we know, the formula to calculate IRR is as follows:
In solving for r as the unknown, the analyst is actually solving for n roots of r. In case of conventional investment only one positive value for r exists, other roots being either imaginary or negative. It is in the case of non-conventional project, which involves more than one reversal of signs in cash flows that there is the possibility of multiple positive roots of r.
Thus, the net present value of the project may be zero at more than one rate. It needs to be emphasized here that this dilemma does not arise when the NPV method is used—we have simply to specify the required rate of return and find NPV. The relationship between discount rates and NPVs are shown in Figure 9.3, where the discount rate is plotted along the horizontal axis and net present value along the vertical axis.
It should be clear from Figure 9.3 that the project combines the features of both lending and borrowing.14 The first part of the figure has an upward slope typical of a loan; the second part has a downward slope typical of an ordinary investment (lending). Since the NPV curve cuts the horizontal-axis twice, the project has two rates of return, 50 and 150 per cent.
Which of the two rates is correct? None. The project would be worthwhile only when the opportunity cost of the capital falls between these two rates; NPV is positive at the discount rates ranging between 50 and 150 per cent.
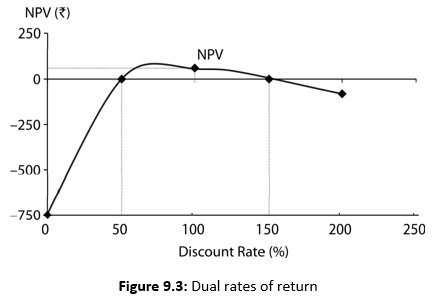
The number of rates of return depends on the number of times the sign of the cash flow stream changes. In the case of the project above, there are two reversals of sign (– + –), and there are two rates of return. Reversal of sign is a necessary but not a sufficient condition for multiple rates of return.
A number of adaptations of the IRR criterion have been suggested to take care of the problem of multiple rates. In our opinion, none of them will work satisfactorily. The simple, straightforward alternative is to use the NPV rule.
Difference: Case of Ranking Mutually Exclusive Projects
We have shown that the NPV and IRR methods yield the same accept-or-reject rule in case of independent conventional investments. However, in real business situations there are alternative ways of achieving an objective and, thus, accepting one alternative will mean excluding the other. As defined earlier, investment projects are said to be mutually exclusive when only one investment could be accepted and others would have to be excluded.15 For example, in order to distribute its products, a company may decide either to establish its own sales organization or engage outside distributors. The more profitable out of the two alternatives shall be selected. This type of exclusiveness may be referred to as technical
exclusiveness. On the other hand, two independent projects may also be mutually exclusive if a financial constraint is imposed. If limited funds are available to accept either Project A or Project B, this would be an example of financial exclusiveness or capital rationing. The NPV and IRR methods can give conflicting ranking to mutually exclusive projects. In the case of independent projects, ranking is not important since all profitable projects will be accepted. Ranking of projects, however, becomes crucial in the case of mutually exclusive projects. Since the NPV and IRR rules can give conflicting ranking to projects, one cannot remain indifferent as to the choice of the rule.
The NPV and IRR rules will give conflicting ranking to the projects under the following conditions:16
The cash flow pattern of the projects may differ. That is, the cash flows of one project may increase over time, while those of others may decrease or vice versa.
The cash outlays (initial investments) of the projects may differ. The projects may have different expected lives.
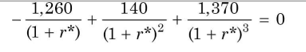
The most commonly found condition for the conflict between the NPV and IRR methods is the difference in the timing of cash flows. Let us consider the following two Projects, M and N.
Timing of Cash Flows
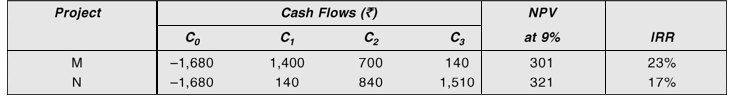
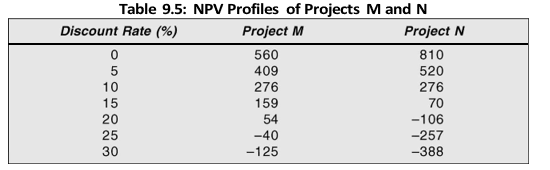
At 9 per cent discount rate, Project N has higher NPV of `321 than Project M’s NPV of `301. However, Project N has a lower IRR of 17 per cent than Project M’s IRR of 23 per cent. Why this conflict? Which project should we accept? Let us see how NPVs of Projects M and N behave with discount rates. The NPV profiles of two projects would be as shown in Table 9.5.
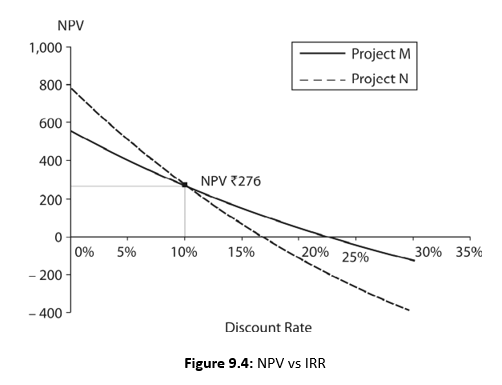
The net present values of Projects M and N, as a function of discount rates, are plotted in Figure 9.5. It is noticeable from the NPV calculations as well as from Figure 9.5 that the present value of Project N falls rapidly, as the discount rate increases. The reason is that its largest cash flows come late in life, when the compounding effect of time is most significant. The reverse is true with Project M as its largest cash flows come early in the life when compounding effect is not so severe. The internal rates of Projects M and N, respectively, are 23 per cent and 17 per cent. The NPV profiles of two projects intersect at 10 per cent discount rate. This is called Fisher’s intersection.17
Fisher’s intersection occurs at the discount rate where the NPVs of two projects are equal. We can determine the discount rate at which Fisher’s intersection occurs as follows:
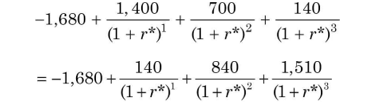
This equation can be simplified by bringing all terms over from the left-hand side.
Solving for r*—Fisher’s intersection rate—by trial and error, we obtain: r* = 10%.
We can write the following formula for determining the rate at which Fisher’s intersection occurs for two Projects M and N:

It is notable from Table 9.5 and Figure 9.4 that at the discount rates less than the intersection rate (10 per cent), Project N has the higher NPV but lower IRR (17 per cent). On the other hand, at the discount rates greater than the intersection rate (10 per cent), Project M has both higher NPV as well as higher IRR (23 per cent). Thus, if the required rate of return is greater than the intersection rate, both NPV and IRR methods will yield consistent results. That is, the project with higher internal rate of return will also have higher net present value. However, if the required rate of return is less than the intersection rate, the two methods will give contradictory results. That is, the project with higher internal rate of return will have lower net present value and vice versa.
Which project should we choose between Projects M and N? Both projects generate positive net present value at 9 per cent opportunity cost of capital. Therefore, both are
profitable. But Project N is better since it has a higher NPV. The IRR rule, however, indicates that we should choose Project M as it has a higher IRR. If we choose Project N, following the NPV rule, we shall be richer by an additional value of `20. Should we have the satisfaction of earning a higher rate of return, or should we like to be richer? The NPV rule is consistent with the objective of shareholder wealth maximization. When we have to choose between mutually exclusive projects, the easiest procedure is to compare the NPVs of the projects and choose the one with the larger NPV.
Incremental Approach
It is argued that the IRR method can still be used to choose between mutually exclusive projects if we adapt it to calculate rate of return on the incremental cash flows. If we prefer Project N to Project M, there should be incremental benefits in doing so. To see this, let us calculate the incremental flows of Project N over Project M. We obtain the following cash flows:
The incremental approach is a satisfactory way of salvaging the IRR rule. But the series of incremental cash flows may result in negative and positive cash flows (i.e., lending and borrowing type pattern). This would result in multiple rates of return and ultimately the NPV method will have to be used.
The IRR on the incremental flows is 10 per cent. It is more than the opportunity cost of 9 per cent. Therefore, Project N should be accepted. Project N is better than Project M despite its lower IRR because it offers all benefits that Project M offers plus the opportunity of an incremental investment at 10 per cent—a rate higher than the required rate of return of 9 per cent. It may be noticed that the NPV of the incremental flows is the difference of the NPV of Project N over that of Project M; this is so because of the value-additivity principle.
Scale of Investment
Another condition under which the NPV and IRR methods will give contradictory ranking to the projects, is
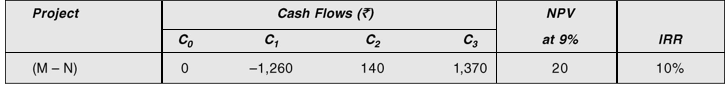
when the cash outlays are of different sizes. Let us consider Projects A and B, involving following cash flows:
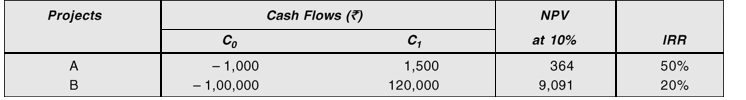
Project A’s NPV at 10 per cent required rate of return is `364 and IRR is 50 per cent. Project B’s NPV at 10 per cent required rate of return is `9,091 and internal rate of return is 20 per cent. Thus, the two projects are ranked differently by the NPV and IRR rules.
As we have explained earlier, the NPV method gives unambiguous results. Since the NPV of Project B is high, it should be accepted. The same result will be obtained if we calculate the internal rate of return on the incremental investment:
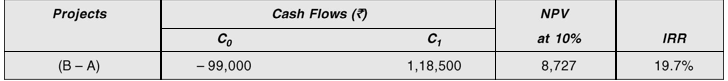
The incremental investment of `99,000 (i.e., `1,00,000 – `1,000) will generate cash inflow of `1,18,500 after a year. Thus, the return on the incremental investment is 19.7 per cent, which is in excess of the 10 per cent required rate of return. We should, therefore, prefer Project B to Project A.
Project Life Span
Difference in the life spans of two mutually exclusive projects can also give rise to the conflict between the NPV and IRR rules. To illustrate, let us consider two mutually exclusive Projects, X and Y, of significantly different expected lives:
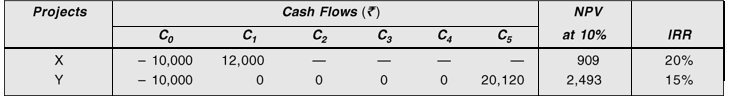
Both the projects require initial cash outlays of `10,000 each. Project X generates a cash flow of `12,000 at the end of one year, while Project Y generated cash flow of `20,120 at the end of fifth year. At 10 per cent required rate of return, Project X’s net present value is `908 and internal rate of return is 20 per cent, while Project Y’s net present value is `2,495 and internal rate of return is 15 per cent. Thus, the two methods rank the projects differently. The NPV rule can be used to choose between the projects since it is always consistent with the wealth maximization principle. Thus, Project Y should be preferred since it has higher NPV.
Check Your Concepts
- Define conventional and non-conventional investment projects.
- Prove that NPV and IRR are equivalent methods for evaluating a project.
- Why do non-conventional projects have problem of multiple rates of return?
- Under what conditions do NPV and IRR methods of ranking mutually exclusive projects rankdifferently?
- What is Fisher’s intersection rate?
REINVESTMENT ASSUMPTION AND MODIFIED INTERNAL RATE OF RETURN (MIRR)
The NPV and IRR rules are sometimes assumed to rest on an underlying implicit assumption about reinvestment of the cash flows generated during the lifetime of the project. It is contented that the source of conflict between the two techniques lies in their different implicit reinvestment rates.18 The IRR method is assumed to imply that the cash flows generated by the project can be reinvested at its internal rate of return, whereas the NPV method is thought to assume that the cash flows are reinvested at the opportunity cost of capital.
Net Terminal Value
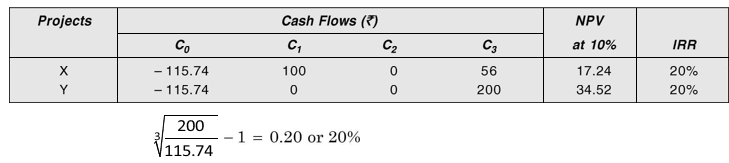
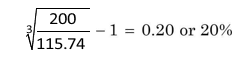
Net terminal value advocates of the reinvestment assumption calculate terminal values of the project to prove their point. For example, consider Projects X and Y. They are equally attractive if the IRR method is used. The terminal value of Project Y is `200. X should also have a terminal value of `200 to have same IRR as Y. Following the IRR method, the terminal value of X would be `200 only when its cash flows are assumed to be reinvested at its IRR of 20 per cent. For example, `100 (1 + 20)2 + `56 = `200. Given the initial value (`115.74) and terminal value (`200), the compound average annual return should be equal to IRR as shown below:
Modified Internal Rate of Return (MIRR)
Some people argue that it is more realistic to use the opportunity cost of capital as the reinvestment rate. If we use 10 per cent as the reinvestment rate, X’s terminal value will be `177. Now Project X’s compound average annual return would approximately be:
This is a modified internal rate of return. The modified internal rate of return (MIRR) is the compound average annual rate that is calculated with a reinvestment rate different than the project’s IRR. You can use the Excel function to calculate the MIRR. The Excel builtin function is: MIRR (Values, Finance_Rate, Reinvest_Rate), where Values represent the range of cash flows, Finance_Rate is the opportunity cost of capital (the required rate of return) and Reinvest_Rate is the reinvestment rate.
You may notice that when we use 10 per cent — the opportunity cost of capital — as the reinvestment rate, we get X’s terminal value less by `23 than the Project Y’s terminal value. The present value of `23 at 10 per cent is equal to the difference between the net present values of Projects X and Y (`34.52 – `17.24) = `23 × 0.751 = `17.28.
Check Your Concepts
- Briefly explain reinvestment rate assumption in the NPV versus IRR controversy.
- What is modified IRR? How is it calculated?
NPV vs PI
The NPV method and PI, yield same accept-or-reject rules, because PI can be greater than one only when the project’s net present value is positive. In case of marginal projects, NPV will be zero and PI will be equal to one. But a conflict may arise between the two methods if a choice between mutually exclusive projects has to be made.19 Consider the following illustration where the two methods give different ranking to the projects.
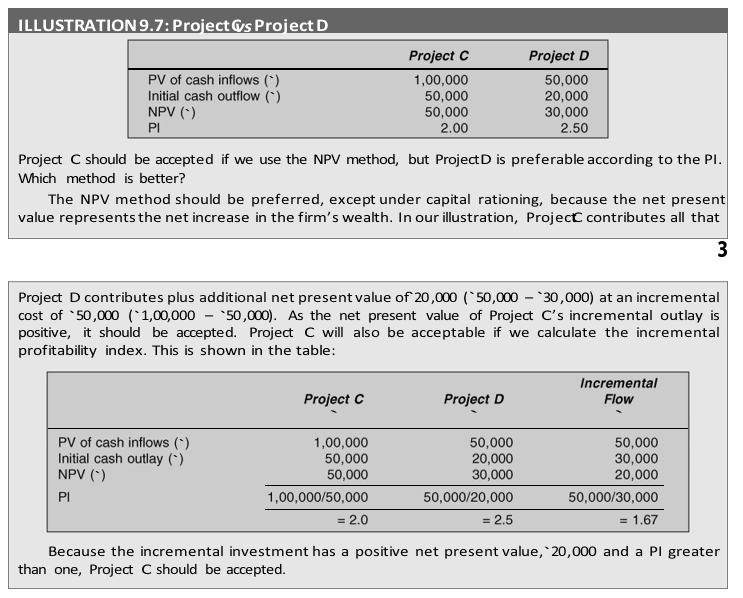
If we consider a different situation where two mutually exclusive projects return `100,000 each, in terms of net present value and one project costs twice as much as another, the profitability index will obviously give a logical answer. The net present value method will indicate that both are equally desirable in absolute terms. However, the profitability index will evaluate these two projects relatively and will give me correct answer. Between two mutually exclusive projects with same NPV, the one with lower initial cost (or higher PI) will be selected.
| Summary | |
| Investments involve cash flows. Profitability of an investment project is determined by evaluating its cash flows. NPV, IRR and PI are the discounted cash flow (DCF) criteria for appraising the worth of an investment project. The net present value (NPV) method is a process of calculating the present value of the project’s cash flows, using the opportunity cost of capital as the discount rate, and finding out the net present value by subtracting the initial investment from the present value of cash flows. Under the NPV method, the investment project is accepted if its net present value is positive (NPV > 0). The market value of the firm’s share is expected to increase by the project’s positive NPV. Between the mutually exclusive projects, the one with the highest NPV will be chosen. The internal rate of return (IRR) is that discount rate at which the project’s net present value is zero. Under the IRR rule, the project will be accepted when its internal rate of return is higher than the opportunity cost of capital (IRR > k). Both IRR and NPV methods account for the time value of money and are generally consistent with the wealth maximization objective. They give same acceptreject results in case of conventional independent projects, viz., cash outlay followed by cash inflows. Under a number of situations, the IRR rule can give a misleading signal for mutually exclusive projects. The IRR rule may also yield multiple rates of return for nonconventional projects (viz., projects with cash outflows occuring more than once) and fails to work under varying cost of capital conditions. Since the IRR violates the valueadditivity principle; since it may fail to maximize wealth under certain conditions; and since it is cumbersome, the use of the NPV rule is recommended. |
|
Profitability index (PI) is the ratio of the present value of cash inflows to initial cash outlay. It is a variation of the NPV rule. PI specifies that the project should be accepted when it has a profitability index greater than one (PI > 1.0) since this implies a positive NPV.
A conflict of ranking can arise between the NPV and PI methods, in case of mutually exclusive projects. Under such a situation, the NPV rule should be preferred since it is consistent with the shareholder wealth maximization principle.
In practice, two other methods have found favour with the business executives. They are the payback (PB) and accounting rate of return (ARR) methods.
The discounted payback considers the time value of money, but like the simple payback, it also ignores cash flows after the payback period.
PB is the number of years required to recoup the initial cash outlay of an investment project. The project would be accepted if its payback is less than the standard payback. The greatest limitations of this method are that it does not consider the time value of money, and does not consider cash flows after the payback period.
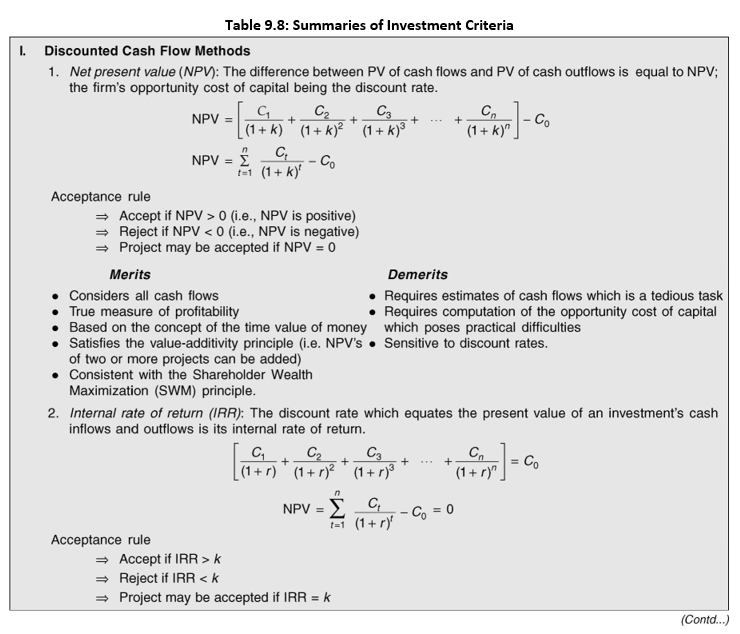
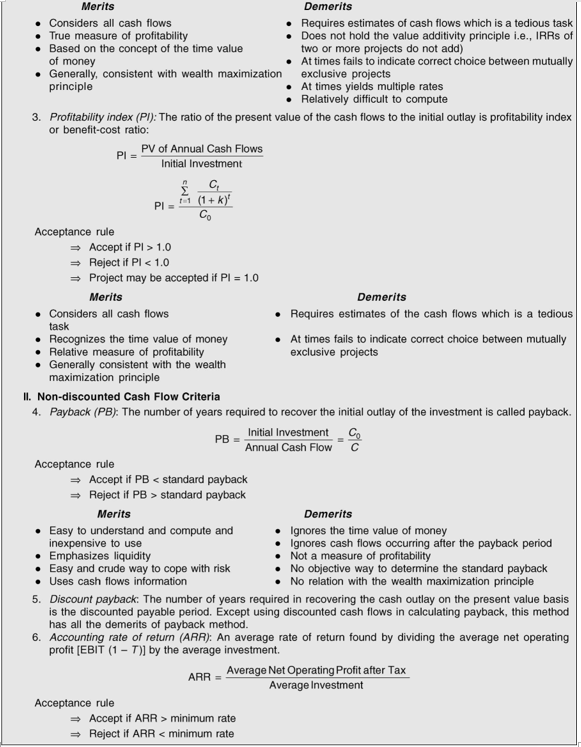
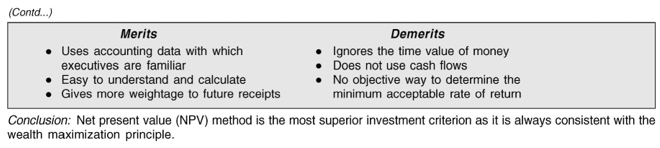
ARR is found out by dividing the average net operating profit aftertax by the average amount of investment. A project is accepted if its ARR is greater than a cutoff rate (arbitrarily selected). This method is based on accounting flows rather than cash flows; therefore, it does not account for the time value of money. Like PB, it is also not consistent with the objective of the shareholder wealth maximization. Table 9.8 provides a summary of the features of various investment criteria.
Review Questions
- What is capital budgeting? Why is it significant for a firm?
- Show how you will calculate NPV and IRR of an investment project.
- Despite its weaknesses, the payback period method is popular in practice. What are the reasonsfor its popularity?
- How do you calculate the accounting rate of return? What are its limitations?
- Explain the merits and demerits of the time-adjusted methods of evaluating the investmentprojects.
- What is meant by the term value of money? Which capital budgeting methods take intoconsideration this concept? How is it possible for the capital budgeting methods that do not consider the time value of money to lead to wrong capital budgeting decisions?
- Under what circumstances do the net present value and internal rate of return methods differ?Which method would you prefer and why?
- What are the mutually exclusive projects? Explain the conditions when conflicting ranking wouldbe given by the internal rate of return and net present value methods to such projects.
- What is profitability index? Which is a superior ranking criterion, profitability index or the netpresent value?
- Comment on the following statements:
- ‘We use payback primarily as a method of coping with risk.’
- ‘The virtue of the IRR rule is that it does not require the computation of the required rate of return.’
- ‘The average accounting rate of return fails to give weight to the later cash flows.’
- ‘Discounted payback ensures that you don’t accept an investment with negative NPV, but it can’tstop you from rejecting projects with a positive NPV.’ Illustrate why this can happen.
Quiz Exercises
- An investment would cost `100,000 and provide annual cash inflow of `21,150 for 6 years. If the opportunity cost of capital is 10 per cent, what is the investment’s NPV? What is the investment’s IRR?
- Suppose two projects—X and Y—both costing `500 each. Project A returns `1,000 after one year and `250 after two years. On the other hand, Project B returns `300 after one year and `1,000 after two years. Calculate NPV of projects at discount rates of 5 per cent and 10 per cent. What happens to projects’ (NPV-based) rankings at these discount rates? Why is there a difference in the ranking?
- A project costs `96,000 and is expected to generate cash inflows of `48,000, `42,000 and `36,000 at the end of each year for next 3 years. Calculate project’s IRR.
- A project will cost `200,000 and will generate annual cash flows of `70,000. What is the project’s payback period?
- The initial cash outlay of a project is `500,000 and it can generate cash inflow of `190,000, `170,000, `160,000 and `120,000 in year 1 through 4. Calculate the project’s payback period.
- A project will cost `400,000. Its stream of earnings before depreciation, interest and taxes (EBDIT) during first year through five years is expected to be `100,000, `120,000, `140,000, `160,000 and `200,000. Assume a 30 per cent tax rate and depreciation on straight-line basis. Calculate the project’s accounting rate of return.