
INTRODUCTION
Let us summarize the essence of the concept of risk which we have discussed in Chapter 6. The risk of a portfolio of securities is measured by portfolio variance or standard deviation. The variance of a portfolio is the sum of:
the variances of individual securities and (the square of) their respective weights, the covariance (that is, the correlation coefficient between securities times their standard deviations) of securities and twice the product of their respective weights.
MEASURING BETA: DIRECT METHOD
In a well-diversified portfolio the weights of individual securities would be very small and therefore, the variances of individual securities would be quite insignificant. But the covariance between the securities would be significant, and its magnitude would depend on the correlation coefficients between the securities. The covariance will be negative if all securities in the portfolio are negatively correlated. In practice, securities may have some positive correlation because they all have a tendency to move with the market. This logic introduces the concepts of diversifiable risk and non-diversifiable risk. The unique or the unsystematic risk of a security can be diversified when it is combined with other securities to form a well-diversified portfolio. On the other hand, the market or the systematic risk of the security cannot be diversified because like other securities, it also moves with the market. Beta is the measure of systematic risk. We will explain the methods of calculating beta and its uses in finance decisions.
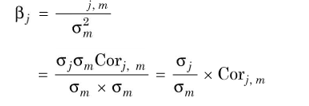
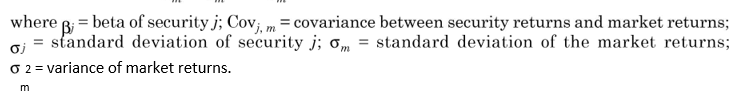
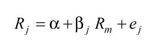
How is the systematic risk of a security measured? We have discussed in the previous chapter that beta is the measure of systematic risk and it is the ratio of covariance between market return and the security’s return to the market return variance: Cov
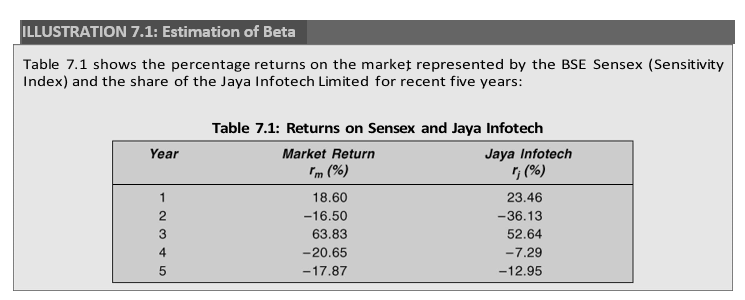
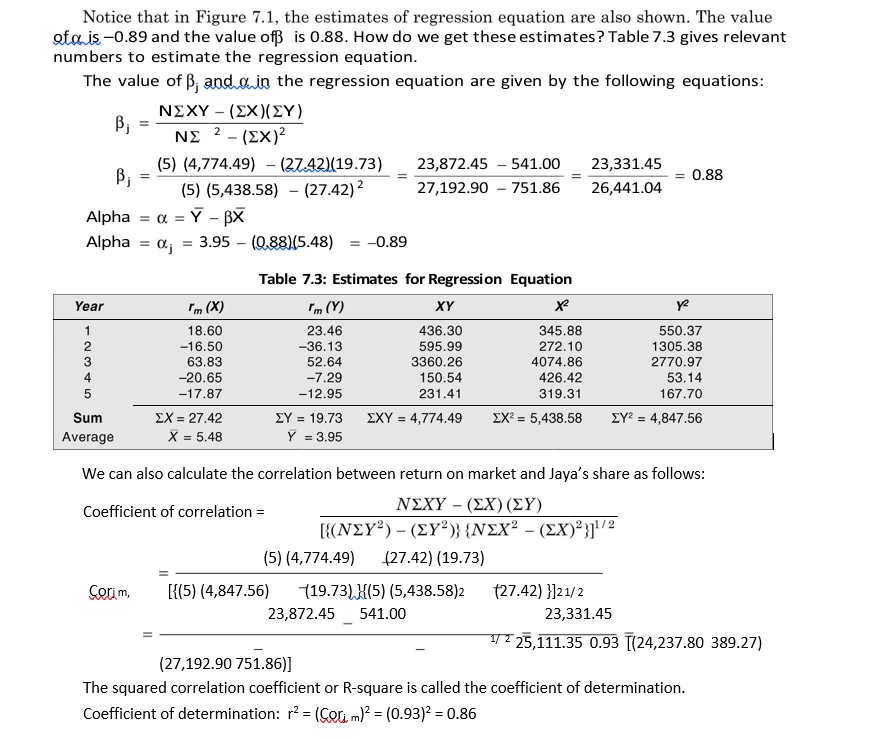
Let us consider an example to show the estimation of beta and intercept.
ILLUSTRATION 7.1: Estimation of Beta
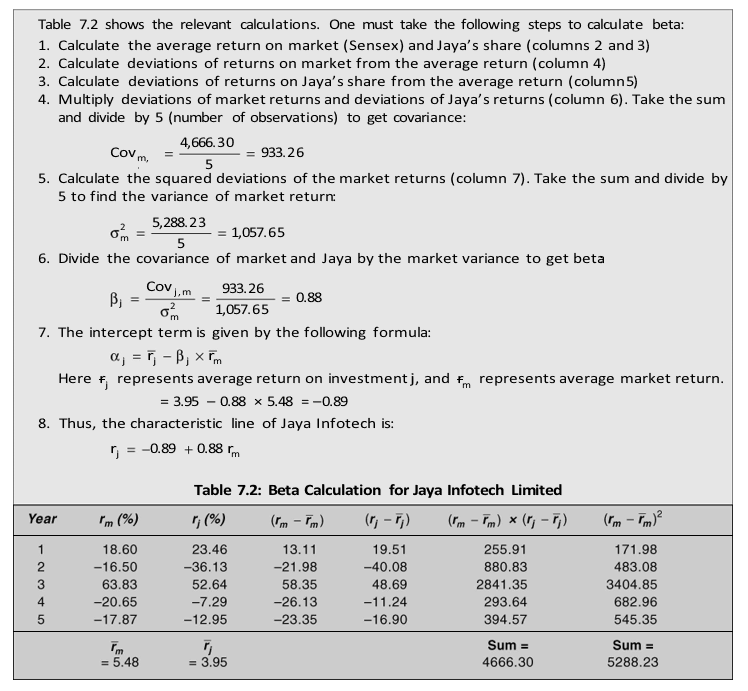
We can plot the observed returns on market and Jaya’s share and fit a regression line as shown in Figure
7.1. The fitted line is given by Equation (2). As discussed earlier, the regression line of the market model is called the characteristic line.
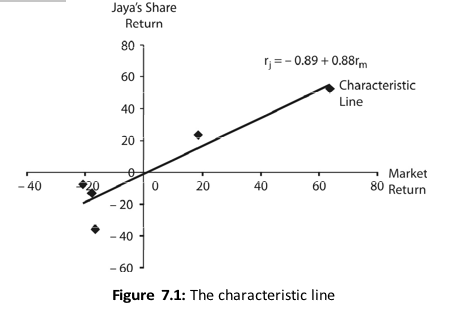
The R-square indicates the extent to which the market model explains a security’s returns.
In this example, the market is able to explain 86 per cent of Jaya Infotech’s share return.
CAPM AND THE OPPORTUNITY COST OF EQUITY CAPITAL
The expected rate of return or the cost of equity in CAPM is given by the following equation:
Shareholders supply capital to a firm. In return, they expect to receive dividends. They can also realize cash (by way of capital gains) by selling their shares. The firm has discretion to retain entire or a part of profits. If dividends were distributed to shareholders, they would have an opportunity to invest cash so received in securities in the capital markets and earn a return. When the firm retains profits, there is loss of opportunity for which shareholders need to be compensated. The expected rate of return from a security of equivalent risk in the capital market is the cost of the lost opportunity. Shareholders require the firm to earn, at least, this rate on their capital invested in projects. From the firm’s point of view, the expected rate of return from a security of equivalent risk is the cost of equity.
![]()
We need the following information to estimate a firm’s cost of equity:
The risk-free rate
The market risk premium
The beta of the firm’s share
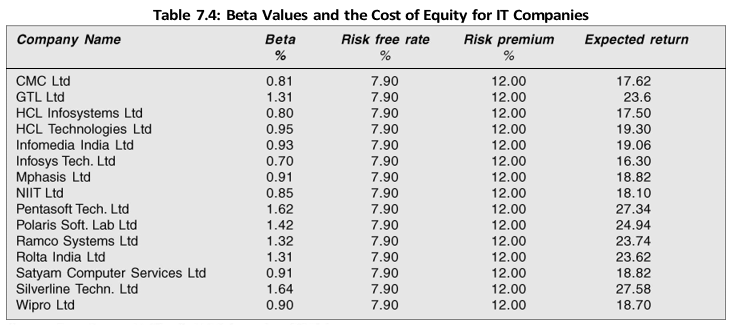
In practice, the risk-free rate will be approximated by the current yield on the government bonds. The market risk premium is estimated as the difference between the average of the historical returns of the market and the average of the historical returns of the firm over a long period of time. In Table 7.4, we have given betas for IT companies. The risk-free rate is approximated by long-term government bond yields. The yield in March 2008 was 7.9 per cent. The historical risk premium on shares (as compared to long-term government bonds yield), in India, was about 12 per cent. We use these numbers to calculate the expected return or cost of equity for various firms listed in Table 7.4.
You may notice that Infosys has the lowest beta (0.70), in our sample of IT companies, and its expected rate of return is 16.30 per cent. Silverline Technologies has the highest beta (1.64) and its expected return is 27.58 per cent.
Industry vs Company Beta
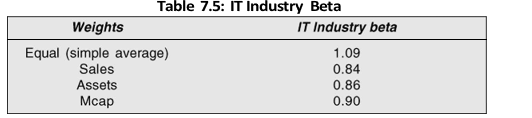
We have shown the company beta values for the IT industry comprising 15 companies in our sample (Table 7.4). In Table 7.5, we show IT industry beta values as the average of 15 companies’
beta values. The four values of IT industry beta in Table 7.5 are: simple average (equal weighted), sales weighted average, assets weighted average and market capitalization weighted average. The simple average beta is 1.09. There is not much difference in the sales, assets and market capitalization weighted averages of beta values.
In Table 7.4, we have shown the BSE betas of the IT companies. Though a number of companies have betas very close to 1, you may notice that the beta values show variations. For example, Silverline Technologies has the highest beta of 1.64 and Infosys the lowest beta of 0.70. For both these companies, the estimates of the expected return would show significant differences, depending on whether the companies use the industry beta or their individual betas. Based on their beta values, the expected rates of return for Silverline Technologies and Infosys, respectively, are 27.58 per cent and 16.30 per cent. If these companies use the industry beta, then the required rates will be the same for both companies.
What should companies do? Should they use their own betas or the industry beta? The use of the industry beta is preferable for those companies whose operations match up with the industry operations. The industry beta is less affected by random variations. Those companies that have operations quite different from a large number of companies in the industry, may stick to the use of their own betas rather than the industry beta. Let us emphasize that there is no theory for the selection of weights and beta values. Beta estimation and selection is an art as well, which one learns with experience.
Check Your Concepts
- Define opportunity cost of equity?
- What is the relationship between CAPM and the cost of equity?
- What is the difference between the industry beta and the company beta?
Summary
A line known as the characteristic line can represent the relationship between the security returns and the
referred to as beta ( ).
![]()
Beta reflects the systematic risk, which cannot be reduced. Investors can eliminate unsystematic risk when they invest their wealth in a welldiversified market portfolio. A beta of 1.0 indicates average level of risk while more than 1.0 means that the security’s return fluctuates more than that of the market portfolio. A zero beta means no (systematic) risk.
The expected return on a security is given by the following equation:
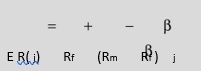
where Rf is the riskfree rate, Rm the market return and j the measure of the security’s systematic risk. This equation gives a line called the security market line (SML).
In terms of the security market line, beta is the ratio of the covariance of returns of a security, j, and the market portfolio, m, to the variance of return of the market portfolio:

returns of the market portfolio, where j is beta of the security, 2m the standard deviation of return of security, the variance of returns of the market portfolio mm the standard deviation of and Corj,m the correlation coefficient between the returns of the security j and the market portfolio m.
The market portfolio may be approximated by a welldiversified share price index such as the Bombay Stock Exchange’s National Index or Sensitivity Index (Sensex).
The expected return on the share of a company depends on its beta. The higher the beta, the higher the expected return.
We can use historical data to determine a firm’s beta. The estimate of beta would depend on the period of analysis (say, one year, three years or five years) and the frequency of returns (e.g., daily, weekly or monthly). The analyst should be careful in using a reasonable period and time interval.
The firm uses capital supplied by shareholders. Alternatively, shareholders could invest their funds in securities in the capital market. Thus, they would require firm to earn a return equal to the expected rate of return on security of the equivalent risk. Hence, the cost of equity is equal to the expected rate of return. The riskfree rate and market premium is common to all firms; betas of firms would be different.
Review Questions
- Define beta of a security? How is it measured? What are the problems in beta estimation?
- How do you calculate the expected rate of return of a security?
- How do you calculate the cost of equity using the CAPM framework?
Quiz Exercises
- Calculate LNM’s equity beta given the following information: Correlation between the returns onLMN’s share and Sensex = 0.809; Variance of the returns on LMN’s share = 0.00754, Variance of the returns on Sensex = 0.001578.
- Market has the following percentage returns during the last five years: 15.7, 10.7, – 7.6,– 0.58 and 7.2. A company’s returns during the same period were 13.9; 15.6; 3.8; – 0.70 and 12.4. Calculate the following: (a) average returns; (b) variances; (c) covariance; (d) beta.
- Calculate cost of equity: risk-free rate is 7.7 per cent; market rate of return is 15.6 per cent; betais 1.23.
- Calculate cost of equity: market premium is 7.5 per cent; market rate of return is 15.6 per cent;beta is 1.33.