
Introduction
In the previous chapter, we looked closely at the investment decision – one of the main decisions faced by the financial manager.
In all cases so far, our considerations have been restricted to organisations operating in a single, domestic market. For example, none of our investment appraisals involved foreign projects and hence foreign currency denominated cash flows.
This chapter first introduces the concepts of international trade and multinational companies, and then looks at the additional complexities when making investment decisions in an international context.
2 Multinational companies and international trading
A multinational company (MNC) is defined as one that generates at least 25% of its sales from activities in countries other than its own.
From this definition we can see that many companies are multinationals. Increasingly, in the modern business environment, organisations are trading with customers and suppliers in many different countries. It is useful to consider why this happens, and what the advantages and disadvantages of international trading are.
Practical reasons for international trading
- Choice – The diversity of goods available in a domestic economy is increased through the import of goods that could be uneconomic or impossible to produce at home.
- Competition – International trade will increase competition in domestic markets, which is likely to lead to both a reduction in price, together with increasing pressure for new products and innovation.
- Economies of scale – By producing both for the home and international markets companies can produce at a larger scale and therefore take advantage of economies of scale.
- Specialisation – If a country specialises in producing the goods and services at which it is most efficient, it can maximise its economic output.
Illustration 1
Imagine the impact on a country’s consumers if international trade did not take place. No bananas, no tropical fruits at any time of the year, vegetables only when they are in season. Less obviously, some countries would be chronically short of many basic metals and materials. Many countries are also increasingly dependent on energy imports. Overall, world economic output would be far lower as countries would be forced to allocate resources to inefficient methods of production.
The theory of comparative advantage
The main theoretical justification for international trade is the law of comparative advantage.
The law of comparative advantage states that two countries can gain from trade when each specialises in the industries in which each has the lowest opportunity cost.
Comparative advantage between countries – Illustration
Imagine a global economy with two countries and two products. Each country needs both products and at present all needs are met by domestic production. Each country has the same resources available to it and they are split equally between the two products.
Suppose the current situation with regard to production is as follows:
| Units of X per day | Units of Y per day | |
| Country A | 1,200 | 720 |
| Country B | 960 | 240 |
| Total daily production | 2,160 | 960 |
As the situation currently stands, country A has an absolute advantage in production of both X and Y.
Given this what are the benefits of A trading with B?
To answer this question we need to consider the opportunity costs incurred by producing X and Y.
- If country A were to focus on making X only, it would give up 720 units of Y to produce an extra 1,200 units of X, i.e. the opportunity cost of 1 unit of X is 720/1,200 = 0.6 units of Y.
- If country B were to focus on making X only, it would give up
240 units of Y to produce an extra 960 units of X, i.e. the opportunity cost of 1 unit of X is 240/960 = 0.25 units of Y.
- The opportunity cost of producing X is lower for country B than it is for country A. It follows that B has a comparative advantage in production of X and should specialise in this product.
If country B is to make product X, it follows that country A should make product Y. An analysis of opportunity costs supports this conclusion.
- If country A were to focus on making Y only, it would give up
1,200 units of X to make 720 units of Y, i.e. the opportunity cost of
- unit of Y is 1,200/720 = 1.67 units of X.
- If country B were to focus on making Y only, it would give up
- units of X to make 240 units of Y, i.e. the opportunity cost of
- unit of Y is 960/240 = 4 units of X.
- Since country A has the lowest opportunity cost for production of Y, it should specialise in production of this product.
The impact of this decision by each country to specialise in production of the good for which they have the lowest opportunity cost on world output is shown below:
| Specialisation based on lowest opportunity cost | ||
| Units of X per day | Units of Y per day | |
| Country A | 0 | 1,440 |
| Country B | 1,920 | 0 |
| Total daily production | 1,920 | 1,440 |
Trade barriers
There are a number of ways that a country can seek to restrict imports. Trade barriers include:
- Quotas – imposition of a maximum number of units that can be imported e.g. quotas on the number of cars manufactured outside of Europe that can be imported into the EU.
- Tariffs – imposition of an import tax on goods being imported into the country to make them uncompetitive on price.
- Exchange controls – domestic companies wishing to buy foreign goods will have to pay in the currency of the exporter’s country. To do this they will need to buy the currency involved by selling sterling. If the government controls the sale of sterling it can control the level of imports purchased.
- Administrative controls – a domestic government can subject imports to excessive levels of administration, paperwork and red tape to slow down and increase the cost of importing goods into the home economy.
- Embargoes – the prohibition of commerce and trade with a certain country.
Multinational companies have to find ways of overcoming these barriers, for example by investing directly and manufacturing within a country rather than importing into it.
Trade agreements and common markets
In many parts of the world, governments have created trade agreements and common markets to encourage free trade. However, the World Trade Organisation (WTO) is opposed to these trading blocs and customs unions (e.g. the European Union) because they encourage trade between members but often have high trade barriers for non-members.
Example of trade agreements and common markets Bi-lateral trade agreements
These are agreements between two countries to eliminate quotas and tariffs on the trade of most (if not all) goods between them.
e.g. The Closer Economic Relations (CER) agreement between Australia and New Zealand.
Multi-lateral trade agreements
These are similar to bi-lateral agreements except more than two countries are involved.
e.g. The North American Free Trade Agreement (NAFTA) between Canada, the United States, and Mexico.
Free trade areas
If the members of a multi-lateral free trade agreement are all in the same geographical area then it is sometimes described as a free trade area.
e.g. The ASEAN Free Trade Area (AFTA) is an agreement by the Association of Southeast Asian Nations (Brunei, Indonesia, Malaysia, Philippines, Singapore, Thailand, Vietnam, Laos, Myanmar and Cambodia).
Customs unions
A customs union is a free trade area with a common external tariff. The participant countries set up common external trade policy, but in some cases they use different import quotas.
e.g. Mercosur is a customs union between Brazil, Argentina, Uruguay, Paraguay and Venezuela in South America.
Single markets (economic communities)
A single market is a customs union with common policies on product regulation, and freedom of movement of all the four factors of production (goods, services, capital and labour).
e.g. The Economic Community of West African States (ECOWAS).
Economic unions
An economic and monetary union is a single market with a common currency.
e.g. The largest economic and monetary union at present is the Eurozone. The Eurozone consists of the European Union member states that have adopted the Euro.
The World Trade Organisation (WTO)
The World Trade Organisation (WTO) was set up to continue to implement the General Agreement on Tariffs and Trade (GATT), and its main aims are to reduce the barriers to international trade. It does this by seeking to prevent protectionist measures such as tariffs, quotas and other import restrictions. It also acts as a forum for negotiation and offering settlement processes to resolve disputes between countries.
The WTO encourages free trade by applying the most favoured nation principle between its members, where reduction in tariffs offered to one country by another should be offered to all members.
Whereas the WTO has had notable success, some protectionist measures between groups of countries are nevertheless allowed and some protectionist measures, especially non-tariff based ones, have been harder to identify and control.
Advantages of reducing protectionist measures
A country (say X) can benefit from reducing protectionist measures because its actions would make other nations reduce their protectionist measures against it.
Normally countries retaliate against each other when they impose protectionist measures. A reduction in these may allow X to benefit from increased trade and economic growth. Such a policy may also allow X to specialise and gain competitive advantage in certain products and services, and compete more effectively globally. Its actions may also gain political capital and more influence worldwide.
Disadvantages of reducing protectionist measures
Possible drawbacks of reducing protectionist policies mainly revolve around the need to protect certain industries.
It may be that these industries are developing and in time would be competitive on a global scale. However, inaction to protect them now would damage their development irreparably. Protection could also be given to old, declining industries, which, if not protected, would fail too quickly due to international competition, and would create large scale unemployment making such inaction politically unacceptable.
Certain protectionist policies are designed to prevent ‘dumping’ of goods at a very cheap price, which hurt local producers.
International Financial Institutions
International Monetary Fund (IMF)
The IMF was founded in 1944 at an international conference at Bretton Woods in the USA but did not really begin to fully function until the 1950s. The so called Bretton Woods System that the IMF was to supervise was to have two main characteristics: stable exchange rates and a multilateral system of international payments and credit.
IMF objectives and functions:
- Promoting international financial cooperation and establishing a system of stable exchange rates and freely convertible currencies.
- Providing a source of credit for members with balance of payments deficits while corrective policies were adopted.
- Managing the growth of international liquidity.
The Bank for International Settlements
The Bank for International Settlements (BIS) is an intergovernmental organisation (IGO) whose membership consists of central banks and national monetary authorities.
Objectives:
- to foster international monetary and financial stability, and
- to foster financial cooperation, and
- to serve as a bank for central banks.
World Bank
The International Bank for Reconstruction and Development (IBRD), also known as the World Bank, was the second institution created at the Bretton Woods meeting in 1944. Its membership and decision making processes are similar to those of the IMF. The original purpose of the IBRD was to help finance the reconstruction of economies damaged by the war. However, it soon shifted the focus of its lending to countries of the developing world. The bank now comprises three principal constituent elements:
- The IBRD proper whose function is to lend long-term funds for capital projects in developing economies at a commercial rate of interest. The main source of these funds is borrowing by the IBRD itself.
- The International Development Association (IDA) which was established in 1960 to provide ‘soft’ loans to the poorest of the developing countries. The IDA:
- is mainly financed by 20 donor countries providing funds every three years; funding therefore depends on the generosity or otherwise of these countries
- provides loans on concessionary terms, normally interest free loans repayable over 50 years.
- The International Finance Corporation which promotes the private sector in developing countries by lending or by taking equity.
The World Bank is clearly an important source of capital funds for the developing countries. However, it has been criticised in recent years over the nature of its lending conditions. For example criticisms have been levelled about conditions that tie farmers into growing cash crops (e.g. oil seed rape) in countries that have a historical propensity for famine (e.g. parts of Eastern Africa).
Principal Central Banks
The Fed
The Federal Reserve System, also known as ‘The Fed,’ is the central bank of the United States.
Functions and objectives:
- In its role as a central bank, the Fed is a bank for other banks and a bank for the federal government.
- It was created to provide the US with a safer, more flexible, and more stable monetary and financial system.
- Over the years, its role in banking and the economy has expanded. The Federal Reserve System is a network of 12 Federal Reserve Banks and a number of branches under the general oversight of the Board of Governors. The Reserve Banks are the operating arms of the central bank.
ECB
The European Central Bank (ECB) is one of the world’s most important central banks, responsible for monetary policy covering the 13 member countries of the Eurozone.
The ECB was established on June 1, 1998 and its headquarters are located in Frankfurt, Germany.
Objectives of the ECB:
- The primary objective of the ECB, and the wider ESCB, is ‘to maintain price stability’ within the euro area, i.e. to keep inflation low.
- In addition, and without prejudice to the objective of price stability, the bank has to support the economic policies of the European Union. These are designed to foster a high level of employment and sustainable and non-inflationary economic growth under Article 2 of the Treaty of the European Union (otherwise known as the Maastricht Treaty).
Bank of Japan
The Bank of Japan is based in Tokyo.
Objectives and functions:
According to its charter, the missions of the Bank of Japan are
- issuance and management of banknotes
- implementation of monetary policy
- providing settlement services and ensuring the stability of the financial system
- treasury and government securities-related operations
- international activities
- compilation of data, economic analyses and research activities.
The Bank of England
The Bank of England’s Monetary Policy Committee sets interest rates in the UK.
Another of the Bank’s main roles is to act as ‘lender of last resort’ to other UK banks.
The role of the international financial markets
The global financial system is the worldwide framework of legal agreements, institutions, and both formal and informal economic entities that together facilitate international flows of financial capital for purposes of investment and trade financing. The system has evolved substantially since its emergence in the late 19th century during the first modern wave of economic globalisation, marked by the establishment of central banks, multilateral treaties, and intergovernmental organizations aimed at improving the transparency, regulation, and effectiveness of international markets.
The world economy became increasingly financially integrated throughout the 1980s and 1990s as nations liberalised capital accounts and deregulated financial sectors.
With greater exposure to volatile capital flows, a series of financial crises in Europe, Asia, and Latin America had contagious effects on other countries. In the 2000s, financial institutions became increasingly large with a more sophisticated range of investment activities.
During 2007 and 2008, the United States experienced a financial crisis characteristic of earlier systemic crises, which quickly propagated among other nations. It became known as the global financial crisis, or ‘credit crunch’ (see more details below), and is recognized as the catalyst for the worldwide Great Recession. Following revelations of Greece’s falsified fiscal data in 2009, financial markets began to adjust to the realisation that Greece was no longer in compliance with the European Economic and Monetary Union. The crisis spread to other European nations experiencing sovereign debt problems and became known as the Eurozone crisis.
A country’s decision to operate with an open economy and globalise its financial capital carries monetary implications captured by the balance of payments, which can indicate the degree to which a nation is living within its means and can reveal the composition of a nation’s wealth as well as its economic competitiveness. Globalised financial capital also carries exposure to systemic risks unique to international finance, such as political deterioration, regulatory changes, foreign exchange controls, and legal uncertainties for foreign investments and property rights.
Numerous groups and individuals participate in the global financial system. Economic entities such as general consumers and international businesses undertake functions such as consumption, production, and investment. Governments and intergovernmental organisations also participate as economic entities, undertaking roles as investors and as purveyors of international trade, economic development, and crisis management.
Regulatory bodies such as governments and multilateral institutions establish financial regulations and legal procedures, while independent self-regulatory associations attempt to coordinate standard practices and facilitate industry supervision.
Professional associations, policy think tanks, and research institutes undertake an observational role by collecting and analysing data, publishing reports and policy recommendations, and facilitating public discourse on global financial affairs.
The global credit crunch and toxic assets
During the ‘Credit Crunch’ of 2008, the phrase ‘toxic assets’ was used by the international media to describe the range of financial products traded by banks and other financial institutions in order to earn income and lay off risk.
To understand the problem of toxic assets it is first necessary to understand how banks have traditionally moved to lay off risk through a process of securitisation using ‘Collateralised Debt Obligations’ (CDOs).
Securitisation through CDOs
When banks lend money to borrowers (for mortgages, car loans etc), they invariably try to lay off their risk by a process of securitisation. This involves selling the asset from the bank’s statement of financial position to a company called a ‘Special Purpose Vehicle’ (SPV). This sale generates cash for the bank in the short term which can then be lent again, in an expanding cycle of credit formation.
CDOs are ‘packages’ of many securitised loans which are put together by an SPV and sold to investors. The investors decide what level of risk they are prepared to tolerate and invest in an appropriate grade of CDO accordingly. The CDOs are then traded between investors (usually banks).
The Credit Crunch
During the late 2000s, it became apparent that the banks had pursued borrowers so aggressively that many of the loans sold to SPVs in the securitisation process were likely not to be repaid (so called ‘sub-prime’ loans). This in turn meant that it had become very difficult to trace which CDOs represented loans which were sound, and which were likely to be defaulted. Even some CDOs which were sold as AAA grade investments were found to be unexpectedly risky.
Consequently, suspicion grew in the financial markets that some banks’ statements of financial position were carrying large amounts of CDOs which were not worth what they appeared to be.
This meant that inter-bank lending reduced dramatically, as banks viewed each other with suspicion.
These CDOs are known as toxic assets.
The main problem is the uncertainty about which loans (and CDOs) are sound and which aren’t. In practice, until time passes and some of the loans are repaid, it will be impossible to tell which banks’ statements of financial position are most badly affected.
The impact on business in general
As a consequence of the credit crunch, the banks have been more reluctant to lend and have set more stringent lending criteria. This has meant that many businesses have struggled to refinance their debts.
It is hoped that the financial stimulus packages introduced by governments in 2009 – 2011 will encourage banks to lend, and will have a positive impact on businesses in general.
Numerical example of securitisation (and tranching)
Smithson Bank has made a number of loans to customers with a current value of $500 million. The loans have an average term to maturity of four years. The loans generate a steady income to the bank of 9% per year.
The company will use 95% of the loan pool as collateral for a collateralised loan obligation structured as follows:
- 70% of the collateral value to support a tranche of A-rated fixed rate loan notes offering investors 7% per year.
- 20% of the collateral value to support a tranche of B-rated fixed rate loan notes offering investors 10% per year.
- 10% of the collateral value to support a tranche of subordinated certificates (unrated).
Required:
Calculate the maximum rate of interest that Smithson Bank can afford to pay to investors in the subordinated certificates.
Solution
In order to estimate the returns an annual cash account should be created showing the cash flow receivable from the pool of assets and the cash payments against the various liabilities created by the securitisation process.
| Receipts | $m | Payments | $m |
| $500m × 9% | 45 | To A class $332.5m (W1) × 7% | (23.275) |
| To B class $95m (W2) × 10% | (9.500) | ||
| ––– | –––––– | ||
| 45 | (32.775) | ||
| ––– | –––––– | ||
| Excess (45 – 32.775) could be | 12.225 | ||
| paid to investors in the | |||
| subordinated certificates |
The payment of $12.225m to the subordinated loan holders would represent an effective return of
$12.225m/($500m × 95% × 10%) = 25.7%
This is therefore the maximum rate that the bank can afford to pay.
(W1) A class total $500m × 95% × 70% = $332.5m
(W2) B class $500m × 95% × 20% = $95m
Student Accountant article
The article ‘Securitisation and tranching’ in the Technical Articles section of the ACCA website provides further details on this topic.
The Eurozone debt crisis
The global financial crisis which started in 2007-2008 caused problems with the liquidity of banks and, as a result, lending and economic growth faltered. However, many of the loans made to both governments and private organisations had assumed certain levels of growth and when these failed to materialise, problems arose with repaying and servicing the debts.
In particular, several countries within the Eurozone (notably Ireland, Portugal and Greece) had to be bailed out by the other members of the European Union.
As the crisis developed, the loss of confidence in the countries affected led to rises in the bond yields required on their government debt.
Given the amount of debt their governments had, bond yields quickly achieved levels at which the governments could no longer afford to service their debt.
This loss of confidence was fuelled by downgrades from the credit rating agencies, media speculation and speculators betting against the Euro and/or certain countries.
Student Accountant article
The article ‘The European debt crisis’ in the Technical Articles section of the ACCA website provides a detailed explanation of the European debt crisis.
Free movement of capital and money laundering
The removal of barriers to the free movement of capital
The free movement of goods, services and capital across national barriers has long been considered a key factor in establishing stable and independent world economies.
However, removing barriers to the free movement of capital also increases the opportunities for international money laundering and terrorist financing.
Money laundering is a process in which assets obtained or generated by criminal activity are moved or concealed to obscure their link with the crime.
The international fight against money laundering and terrorist financing
Ever since the second world war, organisations such as the international monetary fund (IMF) have been working to establish a multilateral framework for trade and finance.
However, terrorist activities are sometimes funded from the proceeds of illegal activities, and perpetrators must find ways to launder the funds in order to use them without drawing the attention of authorities.
The international community has made the fight against money laundering and terrorist financing a priority. Among the goals of this effort are:
- protecting the integrity of the international financial system
- cutting off the resources available to terrorists
- making it harder for criminals to profit from their crimes.
The IMF is especially concerned about the possible consequences of money laundering on its members’ economies, which could include risks to the soundness and stability of financial institutions and financial systems and increased volatility of international capital flows.
Outcomes of the fight against money laundering and terrorist financing
One of the results of this activity is to create a wide definition of the offence of money laundering to include:
- possessing, dealing with, or concealing the proceeds of a crime
- attempting or conspiring to commit such an offence
- failing to inform the national financial intelligence unit (FIU) of knowledge or suspicion of such an offence.
Furthermore, the international efforts to combat money laundering and terrorist financing have resulted in:
- the establishment of an international task force on money laundering (the international Financial Action Task Force on money laundering (FATF))
- the issue of specific recommendations to be adopted by nation states
- the enactment of legislation by many countries on matters covering:
– the criminal justice system and law enforcement
– the financial system and its regulation
– international co-operation.
The implications for the financial manager
The regulatory framework recommended by the FATF and implemented in countries throughout the world, places significant responsibilities on accountants and other professional advisors.
The rules are designed to ensure:
- all customers are properly identified as legitimate and no anonymous accounts are permitted
- any suspect financial activities are immediately reported to the appropriate authorities
- records of all due diligence investigations and financial transactions are kept for the proscribed number of years
- adequate and appropriate policies and procedures are established to forestall and prevent operations related to money laundering or terrorist financing including staff training
- sanctions for non-compliance are in place.
The laws implemented by most countries have had a significant impact on professional accountants who are obliged to:
- undertake customer due diligence (CDD) procedures before acting for a client
- keep records of transactions undertaken and of the verification procedures carried out on clients
- report suspicions to the relevant financial intelligence unit (FIU) e.g. the Serious Organised Crime Agency (SOCA) in the UK.
Professional accountants are not in breach of their professional duty of confidence if, in good faith, they report any knowledge or suspicions of money laundering to the appropriate authorities.
Penalties for non-compliance can be imposed by the regulator (such as the financial services authority in the UK) on any firm or individual. In addition, the ACCA may take its own disciplinary action against its members. It is therefore essential for all accountants to:
- monitor developments in legislation
- stay abreast of the requirements
- implement all recommended protocols.
Strategic issues for MNCs
National governance requirements
Different countries have different governance requirements. These national governance requirements will impact on the behaviour of multinational organisations.
Individual countries have imposed their own restrictions from time to time by, for example, reserving certain shareholdings for their own nationals or by limiting the transference of profits or royalties. But even governments have to tread carefully lest the subject of their attentions abandons the market altogether.
The mobility of capital
One of the drivers of globalisation has been the increased level of mobility of capital across borders.
Implications of an increased mobility of capital:
- Lower costs of capital.
- Ability of MNCs to switch activities between countries.
- Ability of MNCs to circumnavigate national restrictions.
- Potentially increased exposure to foreign currency risk.
‘Local risk’
Local risk for multinationals includes the following:
- Economic risk is the possibility of loss arising to a firm from changes in the economy of a country.
- Political risk is the possibility of loss arising to a firm from actions taken by the government or people of a country.
Examples of political risk:
Confiscation political risk
This is the risk of loss of control over the foreign entity through intervention of the local government or other force.
For example:
- Countries vulnerable to changes of regime
- Invasion by powerful neighbours
- Transition to local ownership
- Confiscation is a very real possibility.
Commercial political risk
Example: The Portuguese revolution of 1974 was followed by several years of left-wing military rule in which wages were compulsorily raised and prices controlled at unrealistic falling real levels. Subsidiaries of foreign parents found their margins squeezed and little sympathy from the authorities. Those that which happened to be suppliers to the government were hit hardest and also had to face serious attempts by the unions to take control of the management. Many such subsidiaries were either abandoned by their shareholders or sold at knockdown prices to local interests. It was interference with the commercial processes of supply and demand that drove their parents out, not confiscation. What drove their parents out was not confiscation but interference with the commercial processes of supply and demand.
Financial political risk
This risk takes many forms:
- Restricted access to local borrowings.
- Restrictions on repatriating capital, dividends or other remittances. These can take the form of prohibition or penal taxation.
- Financial penalties on imports from the rest of the group such as heavy interest-free import deposits.
Exchange control risk
One form of exchange control risk is that the group may accumulate surplus cash in the country where the subsidiary operates, either as profits or as amounts owed for imports to the subsidiary, which cannot be remitted out of the country. This can be mitigated by using FOREX hedging.
A good example is the French regulation under which intra-group trade debts of a French subsidiary to its associated companies, if not made within 12 months of import, become unremittable as ‘capital invested in the subsidiary’. Often the French subsidiary delays payment by more than 12 months because of a shortage of cash created by other French official actions or policies.
Control and agency issues
Within the hierarchy of firms (in a group) goal incongruence may arise when divisional managers in overseas operations promote their own self-interest over those of other divisions and of the organisation generally.
In order to motivate local management and to obtain the benefit of their local knowledge, decision making powers should be delegated to them. However, given the wide geographical spread of divisions, it is difficult for group management to control the behaviour of the local managers.
This gives rise to agency costs, and a difficult balance between local autonomy and effective central control.
Agency issues have already been discussed in terms of the relationship between shareholders and managers of a business.
In any large business there will also be agency relationships between the Board of Directors and the managers of individual business units. The managers of individual business units may well have goals which are not congruent with the main company Board, or the managers of the other business units. For example, the manager of a particular business unit will often make decisions which are in the best interests of that division, without considering how the decision impacts the other business units or the company as a whole.
In a multinational company, these agency relationships may be more problematic, because of the different cultures, languages and time zones which may hamper communication between the parties.
In order to minimise the agency problems which might arise in a multinational company, it is important that the company implements suitable corporate governance procedures, and attempts to align the goals of all the managers by using appropriate managerial compensation packages.
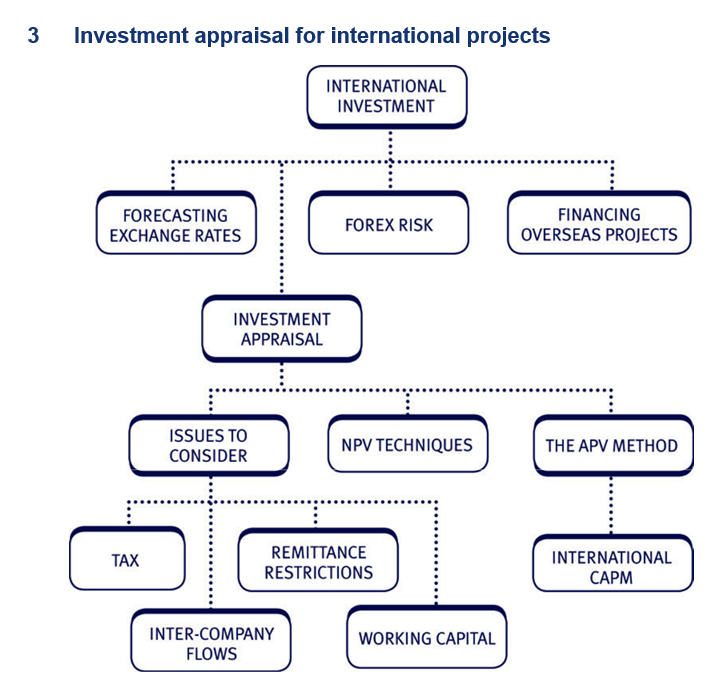
NPV analysis
The appraisal of projects involving international investments uses the same
NPV model we have used in the last chapter. It includes basics such as:
- identifying relevant cash flows
- calculating a project’s corporation tax liability, including the calculation of tax relief on capital expenditure
- dealing with inflation and distinguishing money and real flows. However, international investment appraisal includes additional challenges:
- Forecasting future exchange rates.
- Double taxation.
- Inter-company flows (e.g. management charges or royalties).
- Remittance restrictions.
Impact of a project on the firm’s risk exposure
When a firm starts trading in a different country, it is exposed to three types of risk: transaction, economic and translation risk. These terms are defined in detail in Chapter 10: Hedging foreign exchange risk.
Undertaking a new, foreign currency, project affects the firm’s exposure to these risks as follows:
Transaction risk
Individual receipts and payments which arise during the new project’s life will be subject to transaction risk, in that the value of the transactions will initially be calculated using the forecast rate of exchange which may differ from the actual rate on the transaction date. Firms can use hedging methods (see Chapter 10) to eliminate this transaction risk.
Economic risk
The project NPV is initially calculated using forecast exchange rates. A change in these forecasts over the life of the project will increase or decrease the project NPV, and hence the gain to shareholders.
Translation risk
Undertaking a foreign project often involves setting up a foreign based subsidiary, whose financial statements will have to be translated back into the home currency for the purposes of group accounting (consolidation). A change in exchange rates from one year to the next will cause the value of the subsidiary to fluctuate when its results are translated.
4 Forecasting foreign exchange rates
The relationship between interest, inflation, spot and forward rates
The overall relationship between spot rates, interest rates, inflation rates and the forward and expected future spot rates was covered in Financial Management (FM).
A feature of exam questions covering international investment decisions is often the need to calculate the relevant exchange rates over a number of years, and a summary of the key relationships is therefore given in the four-way equivalence table follows.
Note:
F0 = forward rate
S0 = spot rate
S1 = expected future spot rate
ib = interest rate for base currency
ic = interest rate for counter currency
hb = inflation rate for base currency
hc = inflation rate for counter currency
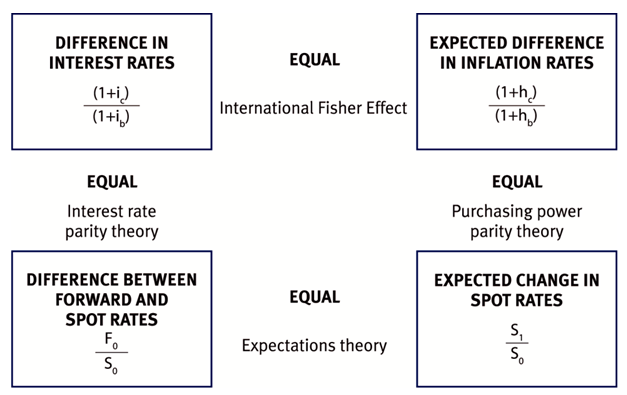
Illustration of parity calculations
The current exchange rate is given as ($… to £1) 1.7025 – 1.7075.
Expected inflation rates are:
| Year | USA | UK |
| 1 | 5% | 2% |
| 2 | 3% | 4% |
| 3 | 4% | 4% |
Use the relationships above to work out the expected spot rate for the next three years.
Solution
Using the PPPT formula:
| S1=S0× | (1 + hc) | |
| (1 + hb) | ||
| S1=S0× | (1 + USA inflation) | |
| (1 + UK inflation) | ||
and the midpoint of the quoted spread as the exchange rate today:
1.7075 + 1.7025 = 1.7050
2
The calculations for the next three years are:
| Year 1 | 1.7050 × | 1.05 | = 1.7551 | |
| 1.02 | ||||
| Year 2 | 1.7551 × | 1.03 | = 1.7382 | |
| 1.04 | ||||
| Year 3 | 1.7382 × | 1.04 | = 1.7382 | |
| 1.04 | ||||
Note that the exchange rate at the end of one year becomes the basis of the next year’s calculation.
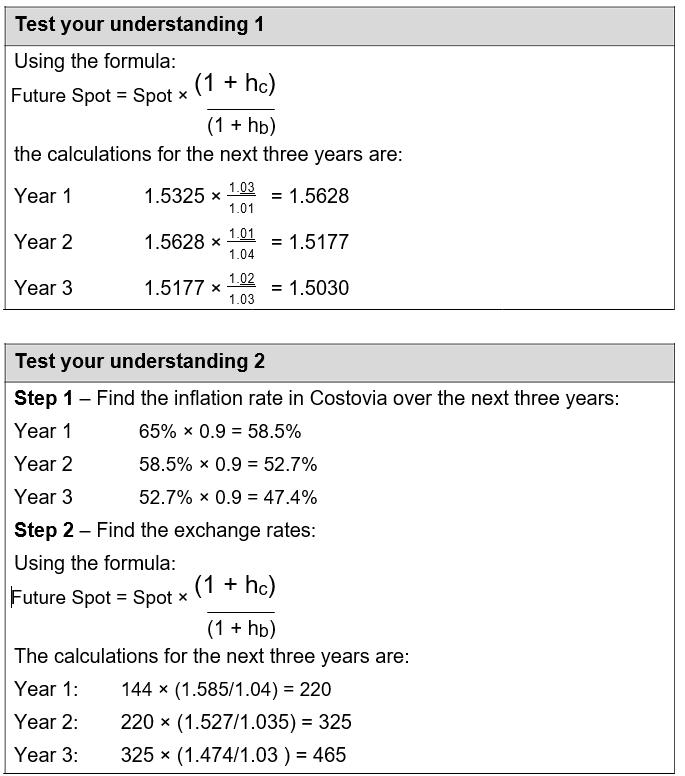
Test your understanding 1
The spot exchange rate is €1.5325 to £1.
Expected inflation rates are:
| Year | Europe | UK |
| 1 | 3% | 1% |
| 2 | 1% | 4% |
| 3 | 2% | 3% |
Required:
Use the relationships above to work out the expected spot rate for the next three years.
Cross rate calculation
Cross rates
You may not be given the exchange rate you need for a particular currency, but instead be given the relationship it has with a different currency. You will then need to calculate a cross rate.
For example, if you have a rate in $/ £ and a rate in €/£, you can derive a cross rate for $/€ by dividing the $/£ rate by the €/£ rate.
Cross rates example
A UK company has a Greek subsidiary which is to purchase materials costing $100,000. The NPV of the overseas cash flows is being calculated in euros, but you have not been provided with the euro/dollar exchange rate. Instead you have the following information:
$/£1 1.90
€/£1 1.45
Required:
Calculate the value of the purchase in euros.
Solution
The solution could be calculated in two stages:
- Convert the purchase into sterling: $100,000/1.90 = £52,632
- Convert the sterling value into euros
£52,632 × 1.45 = €76,316
However an easier alternative, particularly if there are a number of transactions to convert, is to calculate a cross rate:
The $/€ rate will be 1.90/1.45 = 1.3103
The value of the transaction is therefore:
$100,000/1.3103 = €76,318
Changing inflation rates
When finding exchange rates it might first be necessary to calculate the inflation rates expected in a foreign country.
Illustration 2
Inflation is currently 80% in Brazil, although the government hopes to reduce it each year by 25% of the previous year’s rate.
What will the inflation rate be in Brazil over the next four years?
| Solution | |||
| Year 1 | 80% | × 0.75 | = 60% |
| Year 2 | 60% | × 0.75 | = 45% |
| Year 3 | 45% | × 0.75 | = 34% |
| Year 4 | 34% | × 0.75 | = 26% |
| OR | 80% | × (0.75)4 | = 25.3% (more accurate) |
You should also comment in your answer that it is unlikely the government will achieve this reduction each year.
Test your understanding 2
The current rate of inflation in Costovia is 65%. Government action is helping to reduce this rate each year by 10% of the previous rate. The Costovian peso/ US dollar exchange rate is currently 144 pesos to 1 US dollar, and the inflation rate in the US over the next three years is expected to be 4%, 3.5% and 3% respectively.
Required:
Calculate the exchange rate for the Costovian peso against the US dollar for the next three years.
- The impact of taxation, intercompany cash flows and remittance restrictions
Taxation
The level of taxation on a project’s profits will depend on the relationship between the tax rates in the home and foreign country.
There are three possible tax scenarios for an exam question.
The home country may have a tax rate that is:
- lower than
- the same as
- higher than the foreign country.
The question will always assume a double-tax treaty => project always taxed at the higher rate.
Illustration 3
What will be the rate of tax on a project carried out in the US by a UK company in each of the following scenarios?
| UK tax | US tax | ||
| (a) | 33% | < | 40% |
| (b) | 33% | = | 33% |
| (c) | 33% | > | 25% |
Solution
- Scenario (a) – no further UK tax to pay on the project’s $ profits. Profits taxed at 40% in the US.
- Scenario (b) – no further UK tax to pay on the project’s $ profits. Profits taxed at 33% in the US.
- Scenario (c) – project’s profits would be taxed at 33% : 25% in the US and a further 8% tax payable in the UK.
Inter-company cash flows
Inter-company cash flows, such as transfer prices, royalties and management charges, can also affect the tax computations.
Although complex in reality, in the exam:
- Assume inter-company cash flows are allowable for tax (and state it) unless the question says otherwise.
- If an inter-company cash flow is allowable for tax relief overseas, there will be a corresponding tax liability on the income in the home country.
- Assume that the tax authorities will only allow ‘arm’s length’/open-market prices for tax relief and will not allow an artificially high or low transfer price.
Transfer pricing
The transfer price is the price charged by one part of a company when supplying goods or services to another part of the company, e.g. overseas subsidiary.
Transfer prices are particularly problematical. By manipulating the transfer prices charged it may be possible to minimise the global taxation cost for the group, i.e. to report low profits in countries with high taxes and high profits in countries with low rates.
For instance, suppose we have two companies within a group that are based in different countries.
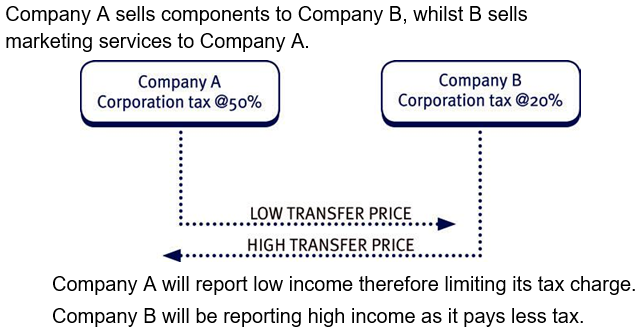
By manipulating the transfer price the overall tax charge can be lowered. However, the government of country A will not look favourably on this action.
This objective is therefore frustrated in many countries, as the relevant tax authorities require the transfer price to be set on an arm’s length basis, i.e. the market price.
If a question tells you that a company is going to considerably increase its transfer price, you could incorporate the new price in your NPV calculations. However it is essential that you then state in your report that the policy may be unsuccessful, as most governments require the transfer price to be set on an arm’s length basis, i.e. the market price.
Therefore it is preferable, for exam purposes, to assume that the tax authorities will only allow ‘arm’s length’/open-market prices for tax relief and will not allow an artificially high or low transfer price.
A second problem may also arise. Although the above may decrease the taxation, the profits will end up in country B. If the currency of country B is weak relative to the holding company, then loss from the depreciation of the currency may be more than the tax saving.
The issues of double taxation and the tax treatment of inter-company flows can be shown with an example:
Illustration 4
A project carried out by a US subsidiary of a UK company is due to earn revenues of $100m in the US in Year 2 with associated costs of $30m. Royalty payments of $10m will be made by the US subsidiary to the UK. Assume tax is paid at 25% in the US and 33% in the UK; and assume a forecast $/£ spot rate of $1.50/£1.
| Required: | ||||
| Forecast the project’s cash flows in Year 2. | ||||
| Solution | ||||
| Year 2 | $m | |||
| Revenues | 100 | |||
| Costs | (30) | |||
| Royalties | (10) | |||
| –––– | ||||
| Pre-tax profit | 60 | |||
| 25% US tax | (15) | $10m | ||
| –––– | ÷1.50 | |||
| Remit to parent | 45 | = £6.7m | ||
| @ $/£ Spot | ÷1.50 | |||
| ––––– | ||||
| £ Cash flow | 30 | |||
| Royalties | 6.7 | |||
| UK tax | (5.4)* | |||
| ––––– | ||||
| After tax cash flow | £31.3m | |||
| ––––– | ||||
| UK tax computation | ||||
| UK tax on $ profits = 33% – 25% = 8% | ||||
| 8% UK tax on $ profits | $60m ÷ 1.50 | = £40m | ||
| £40m × 0.08 | = £3.2m | |||
| 33% UK tax on royalties: | £6.7m × 0.33 | = £2.2m | ||
| UK tax payable | = £5.4m* | |||
Remittance restrictions
Remittance restrictions occur where a foreign government places a limit on the foreign profits that can be repatriated back to the parent company. This restriction may change the extra tax payable by the parent company.
Illustration 5
A UK company is appraising a new US project.
The forecast pre-tax US profit is as follows ($m):
| Year | 0 | 1 | 2 | 3 |
| 3 | 4 | 6 |
In any one year, only 50% of profits generated can be remitted back to the parent. The blocked profits can be released back to the parent in the year after the end of the project.
The US tax rate is 15% and the UK tax rate is 25%. Assume that the exchange rate will be £1 = $1.30 for the foreseeable future.
| Required: | ||||
| Calculate the additional UK tax payable each year. | ||||
| Solution | ||||
| Profits remitted to parent: | ||||
| Year | 1 | 2 | 3 | 4 |
| US$ profit | 3 | 4 | 6 | |
| Blocked funds | (1.5) | (2) | (3) | |
| Remitted to parent ($m) | 1.5 | 2 | 3 | 6.5 |
| Amount remitted (£m) | 1.154 | 1.538 | 2.308 | 5.000 |
| Extra tax payable | (0.115) | (0.154) | (0.231) | (0.500) |
| (25 – 15 = 10%) | ||||
Exchange controls and how to deal with them Exchange controls
Foreign exchange controls are various forms of controls imposed by governments on the purchase/sale of foreign currencies by residents or on the purchase/sale of local currency by non-residents. Common foreign exchange controls include:
- Banning the use of foreign currency within the country.
- Banning locals from possessing foreign currency.
- Restricting currency exchange to government-approved exchangers.
- Fixed exchange rates.
- Restrictions on the amount of currency that may be imported or exported.
Countries with foreign exchange controls are also known as ‘Article 14 countries’ after the provision in the International Monetary Fund agreement allowing exchange controls for transitional economies. Such controls used to be common in most countries, particularly poorer ones, until the 1990s when free trade and globalisation started a trend towards economic liberalisation. Today, countries that still impose exchange controls are the exception rather than the rule.
Strategies to deal with exchange controls
Multinational companies have several options if they want to get round the problem posed by exchange controls, such as:
- management charges – levied by the parent company for costs incurred in the management of the foreign operations.
- transfer pricing – on goods/services supplied by one member of a group to another.
- royalty payments – imposed when the foreign subsidiary is granted the right to make certain patented goods.
- loans – if the parent lends money to the foreign subsidiary, the interest rate can be set at a level to ensure that the required amount of money is transferred to the parent from the subsidiary.
Working capital
It is a normally assumed that the working capital requirement for the foreign project will increase by the annual rate of inflation in that country.
Working capital calculation
Four million pesos in working capital are required immediately for a project running in South America. The inflation rates for the next six years in the South American country are expected to be:
| Year | 1 | 2 | 3 | 4 | 5 | 6 |
| 6% | 4% | 5% | 4% | 3% | 4% |
Required:
Identify the working capital flows for the NPV calculation:
Solution
All cash flows in $000s
| Year | 0 | 1 | 2 | 3 | 4 | 5 | 6 | 7 |
| Working | ||||||||
| capital | 4,000 | |||||||
| Inflation | 1 | 1.06 | 1.04 | 1.05 | 1.04 | 1.03 | 1.04 | |
| Total w/c | 4,000 | 4,240 | 4,410 | 4,631 | 4,816 | 4,960 | 5,158 | |
| W/c | ||||||||
| injection | (4,000) | (240) | (170) | (221) | (185) | (144) | (198) | 5,158 |
Working capital
released
Test your understanding 3
Four million pesos are required in working capital immediately. The inflation rate in the South American country is expected to remain constant for the next six years at a rate of 6%.
Required:
Identify the working capital flows for the NPV calculation, assuming the working capital is released at t = 7.
NPV analysis for foreign projects
There are two methods for calculating the NPV of foreign projects:
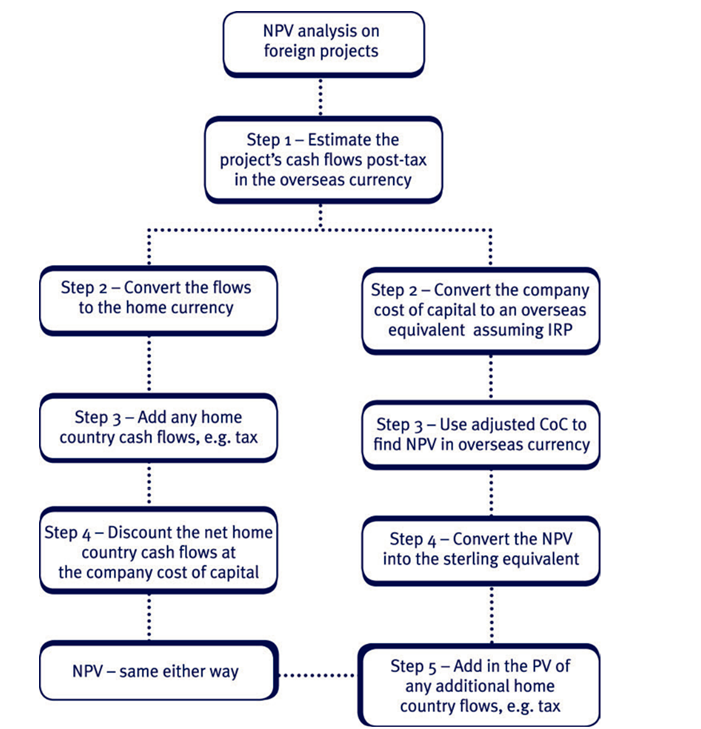
The simpler 4-step method is the more conventional one which is used in the majority of cases.
Test your understanding 4 – Standard method for foreign NPV
A manufacturing company based in the United Kingdom is evaluating an investment project overseas – in REBMATT a politically stable country. It will cost an initial 5.0 million REBMATT dollars (RM$) and it is expected to earn post-tax cash flows as follows:
| Year | 1 | 2 | 3 | 4 |
| Cash flow RM$’000 | 1,500 | 1,900 | 2,500 | 2,700 |
The following information is available:
- Real interest rates in the two countries are the same. They are expected to remain the same for the period of the project.
- The current spot rate is RM$ 2 per £1 Sterling.
- The risk-free rate of interest in REBMATT is 7% and in the UK 9%.
- The company requires a sterling return from this project of 16%.
Required:
Calculate the £ Sterling net present value of the project using the standard method i.e. by discounting annual cash flows in £ Sterling.
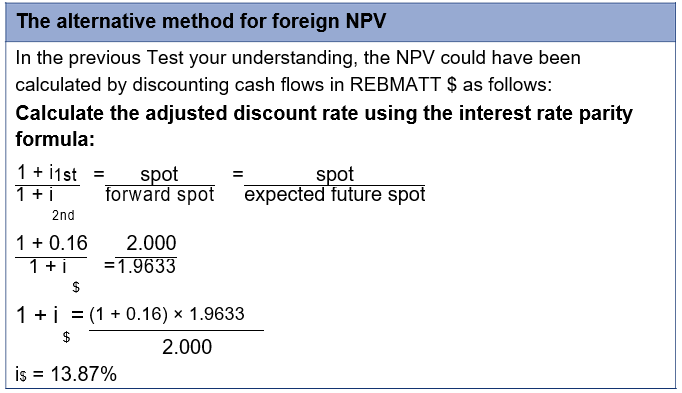
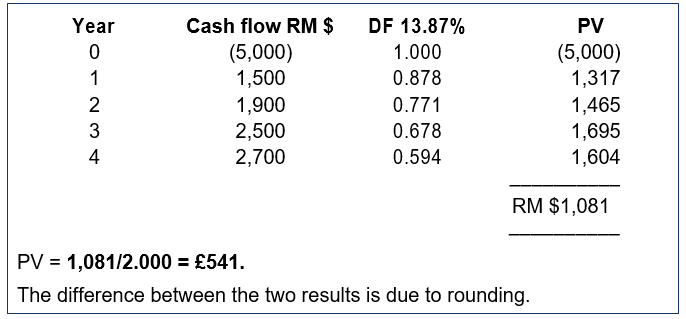
The alternative method for foreign NPV
In the previous Test your understanding, the NPV could have been calculated by discounting cash flows in REBMATT $ as follows:
Calculate the adjusted discount rate using the interest rate parity formula:
Free cash flows in foreign currency
In an exam question, you may be told specifically what the foreign currency free cash flows are for a new project. Alternatively, you may be expected to estimate the free cash flows from given accounting information. This is covered in more detail in Chapter 13: Business valuation, but a simple introductory illustration is shown below.
Illustration of how to estimate free cash flow
Wine Co is considering international expansion by taking over House Co, a manufacturing company based in a foreign country (whose currency is the Foreign Dollar, F$).
According to the most recent accounts of House Co, its revenue and EBIT are F$ 356m and F$70m respectively. Capital expenditure in the most recent year was F$33m and the depreciation charge was F$24m. If Wine Co takes over House Co, it expects growth in revenue and profitability to be 3% per annum, and capital expenditure and depreciation to stay constant. The tax rate in the foreign country is 30% per annum.
The current exchange rate is F$2 = H$1 (H$ is the home currency, the Home Dollar), and this is expected to stay constant for the foreseeable future.
Required:
Estimate the free cash flow, in H$, for the first year after the takeover.
| Solution | |||||||
| Current | Year 1 | ||||||
| F$m | F$m | ||||||
| EBIT (3% increase) | 70 | 72.1 | |||||
| Less: Tax (30%) | (21) | (21.6) | |||||
| Add back depreciation | 24 | 24 | |||||
| Operating cash flow | 73 | 74.5 | |||||
| Less: Capital Expenditure | (33) | (33) | |||||
| Free cash flow in F$m | 40 | 41.5 | |||||
| Exchange rate (F$ …=H$1) | 2 | ||||||
| Free cash flow in H$m | 20.75 | ||||||
| Standard proforma for the conventional approach | |||||||
| Year | 0 | 1 | 2 | 3 | 4 | 5 | |
| Sales/receipts | FC | FC | FC | FC | FC | FC | |
| payments: | x | x | x | x | |||
| Variable costs | (x) | (x) | (x) | (x) | |||
| Wages/materials | (x) | (x) | (x) | (x) | |||
| Incremental fixed costs | (x) | (x) | (x) | (x) | |||
| Untaxed royalties/mgt | |||||||
| charges etc | (x) | (x) | (x) | (x) | |||
| Tax allowable depn | (x) | (x) | (x) | (x) | |||
| Taxable profits | ––– | ––– | ––– | ––– | |||
| x | x | x | x | ||||
| Foreign tax | |||||||
| @ say 20% | (x) | (x) | (x) | (x) | |||
| Add: Tax allowable | |||||||
| depn | x | x | x | x | |||
| Initial outlay | (x) | ||||||
| Realisable value | x | ||||||
| Working capital | (x) | (x) | (x) | (x) | (x) | x | |
| Net foreign CF | (x) | x | x | x | x | x | |
| Year | 0 | 1 | 2 | 3 | 4 | 5 |
| Exchange rate (based | FC | FC | FC | FC | FC | FC |
| on PPPT) | x | x | x | x | x | x |
| Home currency CF | (x) | x | x | x | x | x |
| Domestic tax on foreign | ||||||
| taxable profits @ 30% – | ||||||
| 20% = 10% | (x) | (x) | (x) | (x) | ||
| Untaxed royalties/mgt | ||||||
| charges etc | x | x | x | x | ||
| Domestic tax on | ||||||
| royalties etc. @ 30% | (x) | (x) | (x) | (x) | ||
| Net home currency CF | (x) | x | x | x | x | x |
| DF (say 16%) | 1 | 0.862 | 0.743 | 0.641 | 0.552 | 0.476 |
| Home currency PV | (x) | x | x | x | x | x |
| Home currency NPV | x/(x) |
Performing the calculation
It will be necessary to do a number of subsidiary workings in order to reach the final NPV figure, so remember the basic rules:
- Lay out your table clearly and remember you will need one column more than the length of the project if tax is lagged by a year.
- Make sure all workings are clearly referenced.
- State any assumptions and be prepared to comment on them further in any written report that follows.
The following is a guideline order of approach for the conventional approach:
- Calculate all the relevant flows in the foreign currency.
- If tax is payable on the foreign flows, deduct it.
- Convert the net flows into the domestic currency – you may well need to predict future exchange rates to do so.
- Consider whether any restrictions are placed on remittances and whether these will impact the additional tax payable by the parent.
- Add any other domestic cash flows to the remitted amounts from overseas.
- Discount the total net cash flows in the domestic currency at an appropriate cost of capital.
Student Accountant articles
Read the pair of articles ‘International project appraisal’ in the Technical Articles section of the ACCA website to see more worked examples covering this topic.
Test your understanding 5 – Introductory question Foreign NPV
Parrott Co is a UK based company. It is considering a 3 year project in Farland.
The project will require an initial investment of 81 m Farland Florins (FFl)
and will have a residual value of 10m FFl.
The project’s pre-tax net FFl inflows are expected to be:
| Year 1 | 35m |
| Year 2 | 80m |
| Year 3 | 50m |
The UK parent company will charge the overseas project with £2m of management charges each year.
The current spot rate is 5FFl – £1. UK inflation is expected to be 4% per annum, and Farland inflation is expected to be 7% per annum.
Farland tax is 20% and is paid immediately. Any losses are carried forward and netted off the first available profits for tax purposes. Tax allowable depreciation will be granted on a straight line basis, and any residual value will be taxable at 20%. UK tax is 30% and is payable 1 year in arrears.
Parrott Co recently undertook a similar risk project in the UK and used 11% as a suitable discount rate.
Required:
Calculate the NPV of the project in £.
Test your understanding 6 – Exam standard question Foreign NPV
Puxty plc is a specialist manufacturer of window frames. Its main UK manufacturing operation is based in the south of England, from where it distributes its products throughout the UK.
The directors are now considering whether they should open up an additional manufacturing operation in France – which they believe there will be a good market for their products.
A suitable factory has been located just outside Paris that could be rented on a 5-year lease at an annual charge of €3.8m, payable each year in advance. The manufacturing equipment would cost €75m, of which €60m would have to be paid at the start of the project, with the balance payable 12 months later.
At the start of each year the French factory would require working capital equal to 40% of that year’s sales revenues. It is expected that the factory will be able to produce and sell 80,000 window units per year although, in the first year, because of the need to ‘run in’ the machinery and its new workforce, output is only expected to be 50,000 window units. Each window is likely to be sold for €750, a price that represents a 150% mark-up on cash production costs.
The French factory would be set up as a wholly-owned subsidiary of Puxty plc. In France, 25% straight-line depreciation on cost is an allowable expense against company tax. Corporation tax is payable at 40% at each year-end without delay and any unused losses can be brought forward for set off against the following year’s profits. No UK tax would be payable on the after-tax French profits.
All amounts in € are given in current terms. Annual inflation in France is expected to run at 6% per year in the foreseeable future. All € cash flows involved are expected to increase in line with this inflation rate, with the exception of the factory rental and the cost of the manufacturing equipment, both of which would remain unchanged.
The French factory would be producing windows to a special design patented by Puxty. To protect its patent rights, Puxty plc will charge its French subsidiary a fixed royalty of £20 per window. This cost would be allowable against the subsidiary’s French tax liability.
The current € /£ spot rate is 1.5. Inflation in the UK is expected to be 4% per year over the period. There are no remittance restrictions between France and the UK.
Puxty plc is an all-equity financed company that is quoted on the London Stock Exchange. Its shares have a beta value of 1.25. The current annual return on UK Government Treasury Bills is 10% and the expected return on the market is 18%. In the UK Corporation Tax is payable at 35%, one year in arrears.
Puxty operates on a 5-year planning horizon. At the end of five years, assume that working capital would be fully recovered and the production equipment would have a scrap value, at that time, of €70m before tax. Proceeds on asset sales are taxed at 40%. Assume all cash flows arise at the end of the year to which they relate, unless otherwise stated.
Required:
Evaluate the proposed investment in France and recommend what investment decision should be made by Puxty plc. State clearly any assumptions you make and work all calculations rounded to nearest 10,000 (either € or £) – i.e. €0.01 m or £0.01m.
Chapter summary
This chapter has looked at the additional considerations when appraising an international investment.
As discussed earlier in the Text, the investment decision cannot be made without also considering the impact on financing and dividends.
These issues are covered in the next two chapters.
Test your understanding 3
| Year | 0 | 1 | 2 | 3 | 4 | 5 | 6 | 7 |
| Working | ||||||||
| capital | 4,000 | |||||||
| Inflation | 1.00 | 1.06 | 1.06 | 1.06 | 1.06 | 1.06 | 1.06 | |
| Total | ||||||||
| money | 4,000 | 4,240 | 4,494 | 4,764 | 5,050 | 5,353 | 5,674 | |
| Movement | (4,000) | (240) | (254) | (270) | (286) | (303) | (321) | 5,674 |
Working capital
released
Test your understanding 4 – Standard method for foreign NPV
| Calculation of exchange rates | ||||||
| Using the interest rate parity theory: | ||||||
| Year 1 | 2.00 × 1.07/1.09 = 1.9633 | |||||
| Year 2 | 1.9633 × 1.07/1.09 = 1.9273 | |||||
| Year 3 | 1.9273 × 1.07/1.09 = 1.8919 | |||||
| Year 4 | 1.8919 × 1.07/1.09 = 1.8572 | |||||
| Year | 0 | 1 | 2 | 3 | 4 | |
| Cash flow | ||||||
| (RM$000) | (5,000) | 1,500 | 1,900 | 2,500 | 2,700 | |
| Exchange rate | 2.000 | 1.9633 | 1.9273 | 1.8919 | 1.8572 | |
| –––––– | –––––– | –––––– | –––––– | –––––– | ||
| Cash flow £ | (2,500) | 764 | 986 | 1,321 | 1,454 | |
| PV factor 16% | 1.000 | 0.862 | 0.743 | 0.641 | 0.552 | |
| –––––– | –––––– | –––––– | –––––– | –––––– | ||
| PV | (2,500) | 659 | 733 | 847 | 803 | |
| –––––– | –––––– | –––––– | –––––– | –––––– | ||
NPV = £542
Test your understanding 5 – Introductory question
| FFl(millions) | T0 | T1 | T2 | T3 | T4 |
| Net inflow | 35 | 80 | 50 | ||
| Mgt charge (W2) | (10.3) | (10.6) | (10.9) | ||
| Tax allowable | |||||
| depn | (27) | (27) | (27) | ||
| ––––– | ––––– | ––––– | |||
| (2.3) | 42.4 | 12.1 | |||
| Tax (20%) (W3) | – | (8.0) | (2.4) | ||
| Tax allowable | |||||
| depn | 27 | 27 | 27 | ||
| Capital | |||||
| expenditure | (81) | ||||
| Residual value | 10 | ||||
| Tax on residual | |||||
| value | (2) | ||||
| Net FFl cash | ––––– | ––––– | ––––– | ––––– | |
| flow | (81) | 24.7 | 61.4 | 44.7 | |
| Exchange rate | |||||
| (W1) | 5 | 5.14 | 5.29 | 5.45 | |
| Net £ cash flow | (16.2) | 4.8 | 11.6 | 8.2 | |
| Extra UK tax | |||||
| (W4) | (0.8) | (0.4) | |||
| Management | |||||
| charge | 2 | 2 | 2 | ||
| Tax on mgt | |||||
| charge | (0.6) | (0.6) | (0.6) | ||
| ––––– | ––––– | ––––– | ––––– | ––––– | |
| (16.2) | 6.8 | 13.0 | 8.8 | (1.0) | |
| ––––– | ––––– | ––––– | ––––– | ––––– | |
| DF @ 11% | 1 | 0.901 | 0.812 | 0.731 | 0.659 |
| PV | (16.2) | 6.1 | 10.6 | 6.4 | (0.7) |
So, NPV = £6.2m, so accept the project.
Workings:
(W1) Exchange rates
Using Purchasing Power Parity,
future exchange rate = spot × (1.07/1.04)
Year 1 rate = 5 × (1.07/1.04) = 5.14
Year 2 rate = 5.14 × (1.07/1.04) = 5.29
Year 3 rate = 5.29 × (1.07/1.04) = 5.45
(W2) Management charges
Convert into FFl using the exchange rates from (W1) above.
Year 1: £2m × 5.14 = 10.3m FFl
Year 2: £2m × 5.29 = 10.6m FFl
Year 3: £2m × 5.45 = 10.9m FFl
(W3) Farland tax
Tax is 20% in the same year.
However, the loss of 2.3m FFl in year 1 is carried forward and netted off the profit of 42.4m FFl in year 2 to give year 2 tax of 20%
- (42.4 – 2.3) = 8.0m FFl
(W4) UK tax
From (W3) above, the taxable profit in year 2 is 42.4 – 2.3 = 40.1m FFl. At the year 2 exchange rate of 5.29 (W1) this amounts to £7.6m.
Hence, the extra UK tax payable is 10% × £7.6m = £0.8m, one year later (in year 3).
The taxable profit in year 3 is 12.1m + 10m (residual value) = 22.1m FFl. At the year 3 exchange rate of 5.45 (W1) this amounts to £4.1m.
Hence the extra UK tax payable is 10% × £4.1m = £0.4m, one year later (in year 4).
Test your understanding 6 – Exam standard question Cash flow analysis (€m)
| 0 | 1 | 2 | 3 | 4 | 5 | 6 | |
| Revenues (W1) | – | 39.75 | 67.42 | 71.46 | 75.75 | 80.29 | – |
| Operating costs | |||||||
| (W2) | – | (15.90) | (26.97) | (28.58) | (30.30) | (32.12) | – |
| Rental charges | (3.80) | (3.80) | (3.80) | (3.80) | (3.80) | – | – |
| Royalties (W3) | – | (1.53) | (2.50) | (2.54) | (2.59) | (2.64) | – |
| Tax charge (W5) | – | (0.00) | (6.07) | (7.12) | (8.12) | (16.69) | – |
| Equipment | |||||||
| outlay | (60.00) | (15.00) | – | – | – | – | – |
| Scrap value | – | – | – | – | – | 70.00 | – |
| Tax on scrap | – | – | – | – | – | (28.00) | – |
| Working capital | |||||||
| (W6) | (15.90) | (11.07) | (1.61) | (1.72) | (1.82) | 32.12 | – |
| ––––– | ––––– | ––––– | ––––– | ––––– | ––––– | ||
| Net €m c/f | (79.70) | (7.55) | 26.47 | 27.70 | 29.12 | 102.96 | – |
| €/£ (W4) | 1.50 | 1.53 | 1.56 | 1.59 | 1.62 | 1.65 | – |
| £m c/f | (53.13) | (4.93) | 16.97 | 17.42 | 17.98 | 62.40 | – |
| £m royalties | |||||||
| (W3) | – | 1.00 | 1.60 | 1.60 | 1.60 | 1.60 | – |
| UK royalty tax | |||||||
| 35% | – | – | (0.35) | (0.56) | (0.56) | (0.56) | (0.56) |
| ––––– | ––––– | ––––– | ––––– | ––––– | ––––– | ––––– | |
| Net £m c/f | (53.13) | (3.93) | 18.22 | 18.46 | 19.02 | 63.06 | (0.56) |
| 20% Discount | |||||||
| (W7) | 1 | 0.833 | 0.694 | 0.579 | 0.482 | 0.402 | 0.335 |
| ––––– | ––––– | ––––– | ––––– | ––––– | ––––– | ––––– | |
| (53.13) | (3.27) | 12.64 | 10.69 | 9.17 | 25.35 | (0.19) | |
| ––––– | ––––– | ––––– | ––––– | ––––– | ––––– | ––––– |
NPV: + £1.26m.
Workings
(W1) €m Sales revenues
50,000 × 750 (1.06) = 39.75 Year 1
80,000 × 750 (1.06)2 = 67.42 Year 2
80,000 × 750 (1.06)3 = 71.46 Year 3
80,000 × 750 (1.06)4 = 75.75 Year 4
80,000 × 750 (1.06)5 = 80.29 Year 5
(W2) €m Production costs
39.75 ÷ 2.5 = 15.9 Year 1
67.42 ÷ 2.5 = 26.97 Year 2
71.46 ÷ 2.5 = 28.58 Year 3
75.75 ÷ 2.5 = 30.30 Year 4
80.29 ÷ 2.5 = 32.12 Year 5
(W3) €m Royalty payments
50,000 × £20 = £1 m × 1.53 = €1.53m = Year 1
(exchange rate calculations – see (W4)).
80,000 × £20 = £1.6m × 1.56 = €2.50m = Year 2
80,000 × £20 = £1.6m × 1.59 = €2.54m = Year 3
80,000 × £20 = £1.6m × 1.62 = €2.59m = Year 4
80,000 × £20 = £1.6m × 1.65 = €2.64m = Year 5
(W4) €/£ Exchange rate
| S1 | = S0 | × | (1 + hc) | |
| (1 + h | ) | |||
| b | ||||
Year 1 = 1.50 × 1.06/1.04 = 1.53
Year 2 = 1.53 × 1.06/1.04 = 1.56
Year 3 = 1.56 × 1.06/1.04 = 1.59
Year 4 = 1.59 × 1.06/1.04 = 1.62
Year 5 = 1.62 × 1.06/1.04 = 1.65
| (W5) Basic €m tax calculations | |||||
| Years | |||||
| 1 | 2 | 3 | 4 | 5 | |
| Revenues | 39.75 | 67.42 | 71.46 | 75.75 | 80.29 |
| Less: | |||||
| Operating costs | (15.90) | (26.97) | (28.58) | (30.30) | (32.12) |
| Depreciation | (18.75) | (18.75) | (18.75) | (18.75) | – |
| Rental charges | (3.80) | (3.80) | (3.80) | (3.80) | (3.80) |
| Royalties | (1.53) | (2.50) | (2.54) | (2.59) | (2.64) |
| ––––– | ––––– | ––––– | ––––– | ––––– | |
| Taxable cash flow | (0.23) | 15.40 | 17.79 | 20.31 | 41.73 |
| Loss b/f* | (0.23) | ||||
| Tax at 40% (no lag) | 0.00 | 6.07 | 7.12 | 8.12 | 16.69 |
*No other business in France means no profits available to set off the loss in that year. Instead it is carried forward for set off in the following year.
(W6) €m Working capital requirement
Revenue × 40% Needed – Previous balance = Injection 39.75 × 0.4 = 15.90 – 0 = 15.90 Year 0
67.42 × 0.4 = 26.97 – 15.90 = 11.07 Year 1
71.46 × 0.4 = 28.58 – 26.97 = 1.61 Year 2
75.75 × 0.4 = 30.30 – 28.58 = 1.72 Year 3
80.29 × 0.4 = 32.12 – 30.30 = 1.82 Year 4
Recovery 3212 Year 5
(W7) £ discount rate
Using the CAPM equation:
Rj = Rf + β(Rm – Rf)
The discount rate can be found as: 10% + (18% – 10%) × 1.25 = 20%.
Conclusion
As the French manufacturing project generates a positive NPV it should be undertaken, provided the directors are happy with the estimates they have made.
Assumptions
Royalties are allowable against French tax.
Royalties are subject to UK tax.
Further information that might be useful to the analysis would include:
- Details as to how the estimates of the project’s cash flows were made.
- Details about where the company derived its estimate of the future French inflation rate and the future rate of depreciation of the French franc.
- Details of how the estimate of the machinery’s five-year scrap value was made.
- An analysis about whether or not country risk might be a significant factor.
- How sensitive is the NPV calculation to changes in some of the key estimates.
One thought on “International operations and international investment appraisal”