
The Co-op Accounting and Audit method uses three categories for identifying and recording data:
Strong Co-operatives; Strong People; and Strong Communities. These bring together the financial, social and environmental objectives to form a way of assessing the achievement of the triple bottom line.
- Strong Co-operatives (Commercial) is where data is collected on the commercial plans, targets and financial results for the period; and ratio analysis for the financial comparisons.
- Strong People (Social) is where data is collected on the members and employees and their capacity building.
- Strong Communities (Environment) is where planned and actual data is collected on community and environmental categories, and also has a SWOT analysis.
The Co-op Accounting and Audit poster, see below, uses the three dimensions of the triple bottom to group the information collected into three panels.
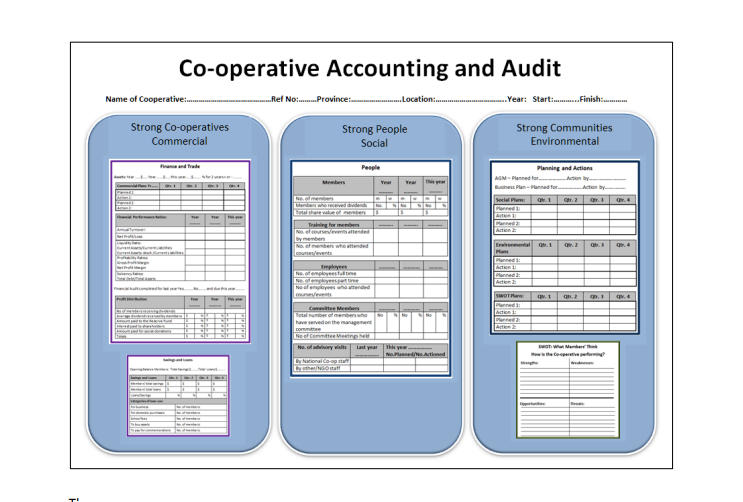
The Co-op Accounting and Audit poster is designed to be on display, open and interactive; it should be placed on the wall in the co-operative in a place that is open to members and customers for the whole year. It will create visibility of how the co-operative is managed, what amounts of money there is currently available, what plans are in place and how these are being implemented. This
transparency will enhance governance as it will provide insight into the process of management and decision making.
Alternatively, if a co-operative and its members have the means the poster information can be displayed on an interactive monitor either physically attached to a wall like a poster or using online computing so members can view and be interactive with the poster from their own computers or smartphones.
This chapter goes through each of the three panels in turn; the information that is collected in the poster, where it is obtained and how it is recorded is explained. Where necessary a short explanation of what the information tells us about the individual co-operative is included as part of the text and also included in the final chapter; 4 Analysis of Information and Reporting of Results.
The poster should be printed on a large sheet of strong paper; large enough to be easily filled in by hand. Although each poster will be used for one year (each year the co-operative will need to replace the completed poster with a new one) at the beginning of each year the results from the previous year(s) should be copied to the next year’s poster. The information in the poster is designed to cover up to three years in order to show how, over time, the co-operative has performed. In the first instance the information for the two previous years will come from existing records.
It is recommended that the recording and analysis of the information for the Co-op Accounting and Audit poster should be managed by an appointed team of members and the employed manager. The team should comprise of two to five people, depending on the size of the co-operative, and include at least one member of the Management Committee and other members. If it is possible to find an external individual or local government officer to be part of the team it can strengthen the independence of, and create more trust in, the results. The Accounting and Audit team should aim to meet, at least, four times a year to translate the business and social plans of the co-operative into quarterly targets, review and assess progress, analyse the results, and record the information on the poster.
The Co-op Accounting and Audit poster will serve to be the main communication channel between the Management Committee and the membership. The plans, once agreed by the Management Committee at the beginning of each year, will be written in the appropriate boxes in the poster along with quarterly targets, at the end of each quarter the actual results will be written in the poster, and then the finial annual results will be written in at the end of the year.
3.1 Strong Co-operatives – Commercial Viability
The Strong Co-operative panel is where financial information is recorded. It focuses on the planning and financial strength of the co-operative and provides some indication of past performance. In the Strong Co-operatives panel there are two sections, the first one, Finance and Trade, is for all cooperatives and the second one is an additional section for use only by Savings and Loans Cooperatives. Some trading co-operatives may also run a Savings and Loans facility. Non Savings and Loans co-operatives should just leave this section blank or it should not be included in the poster when printed.
The Finance and Trade section includes information on commercial planning, financial performance and dividends paid to members. For each of the numbered sections a short explanation is provided. All figures described in the poster use the $ dollar sign, these should be changed to the local currency sign when printed and used.
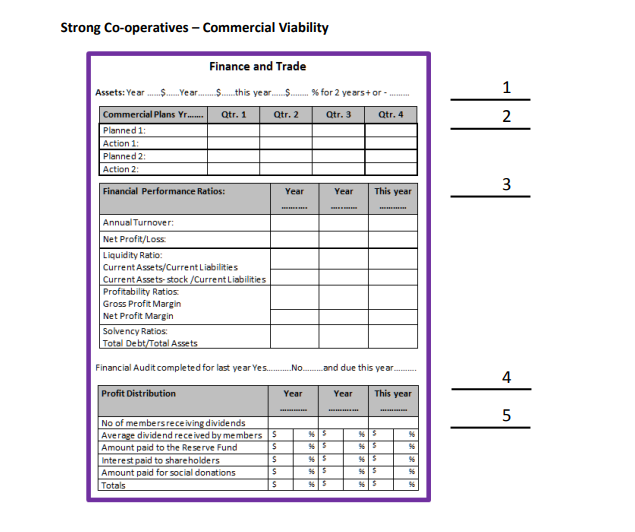
1. Assets (of the Co-operative)
First write in the actual year for each of the three years. The total asset amount provides an indication of the value of the co-operative in the year it was prepared. The asset value for each year will be stated in the financial audited accounts and for each of the two previous years should be copied to this section to provide the reader with an understanding of the size of the co-operative in
financial terms. The percentage of change between the two previous years will show if the asset value is increasing (a good result) or decreasing (a bad result) over the period and should be written in the final line.
2. Commercial Plans
The commercial plans will be stated in the Co-operative Business Plan. There can be as many commercial plans as you have planned for each year. Try to identify a number of targets (a target is a point in a process when something can be measured) this will help monitor and understand how the plans are progressing. The co-operative should update its Co-operative Business Plan annually at the
same time as the poster is set up for the coming year. In the poster annual plans are broken down into quarterly targets; if however, targets are less frequent just record them as appropriate; it is not essential that each quarter has a stated target.
The Accounting and Audit team should ensure that for each target the actual progress against the plan is recorded. This will enable the manager to understand what is happening and communicate the information to the Management Committee. It should also show where the manager may have to take some remedial action to make sure the plan is being implemented on schedule.
3. Financial Performance Ratios
Looking at a profit and loss account and a balance sheet can give you a clear idea of the health of a co-operative. Calculating a few basic financial ratios can help to assess quickly how well a cooperative is doing and provide early warning of potential financial problems. A ratio is simply a relationship between two numbers; it makes visible the invisible. Ratio analysis is a useful management tool that will improve the co-operative’s understanding of its financial position and trends over time, and provide key indicators of co-operative performance. Ratio analysis can help to pinpoint strengths and weaknesses which management can use to form strategies and plan initiatives. A National Registrar of Co-operatives may use ratio analysis to measure one cooperative’s results against other co-operative’s results.
Basic ratios are used to inform on the following:
Liquidity: is there a sufficient finance to cover working capital to pay bills?
Profitability: is the co-operative a good investment?
Solvency: is the co-operative strong enough to withstand difficult trading conditions?
If the information is available it can be possible to compare your co-operative’s ratios with the same ratios for other co-operatives operating in a similar environment to you – giving an idea of your relative performance. (Ratios may be published by the National Registrar of Co-operatives for cooperative sectors which can be used as a benchmark figure against which individual co-operatives
can compare and measure their performance.)
Ratios are also very good for comparing trends over a number of years, to see what patterns of performance emerge. This can also mean that the full benefit of using ratio analysis will not be seen for about three years, but thereafter a co-operative will always be able to know its performance from one year to the next.
The financial information needed to undertake ratio analysis will be in the financial audited accounts. This means of course that ratios are historical and should be used to inform a cooperative about past performance and help them make decisions for future performance.
Below is a description of each ratio and the information it provides:
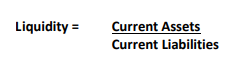
3.1 Liquidity Ratios
Liquidity ratios tell us if a co-operative can pay its bills. There are two ratios to test the liquidity of the co-operative: current ratio and quick ratio. The current assets of your co-operative are its cash or assets such as stock, work in progress, or debts that can be turned into cash. Current liabilities are your immediate trade creditors and your bank overdraft. You should always have sufficient current
assets to meet current liability obligations.
Current ratio
The current ratio simply shows the relationship of current assets to current liabilities. In particular, it shows the ability of your co-operative to meet short-term debts with current assets.
This ratio should normally be between 1.5 and 2. A ratio of less than 1 (that is, where the current liabilities exceed the current assets) could mean that you are unable to meet debts as they fall due, in which case you are insolvent. On the other hand a high current ratio of 2.5 to 5 could indicate that too much money is tied up in current assets, for example, giving customers too much credit.
Quick ratio
A stricter test of liquidity is the quick ratio or ‘acid test’. This ratio measures the co-operative’s ability to meet short-term liabilities from liquid assets such as cash. Some current assets, such as work in progress and stock, may be difficult to turn quickly into cash. Also, if debtors are slow or very slow in paying their bills you should consider deducting these amounts from the current assets as well.
Deducting these from the current assets gives the quick assets.

The quick ratio should normally be around 0.7-1. To be absolutely safe, the quick ratio should be at least 1. which indicates that quick assets exceed current liabilities. If the current ratio is rising and the quick ratio is static, there is almost certainly a stockholding problem – you may have too much stock.
3.2 Profitability ratios
Profitability ratios tell us how good management is as using resources. There are a number of simple profitability indicators that you can use; the gross profit margin is the figure to watch most closely – it is a measure of how well resources have been managed and overall management efficiency. The larger the profit margins, the better for the co-operative.
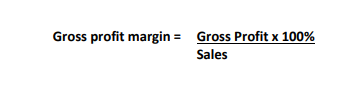
Gross profit margin
The gross profit is the total income for the co-operative less the direct cost of sales. The gross profit needs to cover all of the fixed costs and, after they have been paid, contributes to the net profit. The gross profit margin is simply the gross profit expressed as a percentage of sales. This is a good figure to compare with other co-operatives in the same sector and in terms of trends over time in one cooperative.
Net profit margin
The net profit of your co-operative is what is left after all your costs include business tax/license and interest payments. The net profit margin is the net profit expressed as a percentage of sales.
Profitability ratios need to be compared over time, one year with the next, or in relation to sector specific percentages. Different sectors have very different ratios, but within a sector it should be possible to compare one co-operative’s performance with another.
3.3 Solvency ratios
Solvency ratios tell us the overall financial health of the co-operative. If the net worth of your cooperative becomes negative – that is, the total liabilities exceed the total assets – you have become insolvent. In other words, if you closed, it would not be possible to repay all the people who are owed money. It is an offence to allow the co-operative to become insolvent, so watch the figures closely. Acceptable solvency ratios vary from sector to sector, however as a general rule, a solvency ratio higher than 20% is considered to be financially sound.
Hints and Tips
- The key purpose of ratios is to examine trends and identify problems. Ratios won’t solve a problem but they might help to identify the factors behind a co-operative’s financial problems.
- It is important to use the same ratios every year in order to build information on trends that will enable management to compare, over time, if the co-operative is improving or worsening.
- The smaller your co-operative, the more important it is to watch the cash flow, rather than relying on ratio analysis.
- Ratios depend upon accurate, consistent financial information, so keep your accounts up to date.
- The information for all these ratios is in the audited accounts and for the two previous years it should be recorded on the poster.
At the end of the year the current figures can be recorded on the Co-op Accounting and Audit poster to complete the appraisal. All together these ratios provide you with the basic information on the financial health of the cooperative.
4. Audited Financial Accounts
On the poster put in the date your financial audit is planned for and tick Yes or No if last year’s accounts were audited. Make sure you plan for your accounts to be audited well in advance and also make sure that when the time comes your entire financial book keeping and receipts, etc. are up to date and complete. Without audited accounts you will not be able to undertake the ratio analysis, nor will you be able to pay dividends to members.
5. Profit Distribution
After the accounts have been audited you will know the net profit for the year and how much money is available for the reserve fund, donations to community initiatives and to pay dividends to members. Dividends are of course paid in relation to the amount of trade transacted between the co-operative and a member and therefore each member will received different amounts each year.
Write in the poster the number of members receiving dividends for the year and the average amount per member (total dividends divide by the number of members receiving the dividends for the year). Write in the poster the amount put aside for the reserve fund and donations for social, community or environmental initiatives the co-operative has made in the year. Then fill in a percentage for each of the three entries in the column next to the figures and total both the amounts of money and percentages to make sure the calculations are right. This information will explain how the co-operative has distributed its net profit for the year.
3.1.1 Savings and Loans
The Savings and Loans section in the Strong Co-operatives panel is only to be used by Savings and Loans Co-operatives, otherwise leave it blank (or delete it). The term for a membership based local savings and loans co-operative may also be called a credit union, or a microcredit co-op. Whichever term is used it means the same type of co-operative organisation.
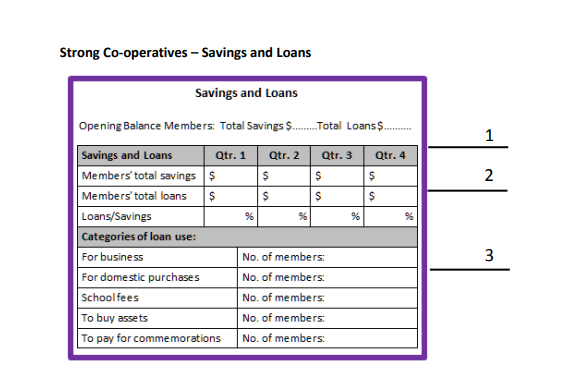
1. Opening Balance of Members’ Savings and Loans
At the beginning of the year write in the total of Members’ savings in the first space and in the second space write in the total of Members’ loans. These two figures will be carried forward from the close of the last financial year. The figures will be in the audited accounts or in the register of members’ savings and loans.
2. Loan Categories
When entering the figure for the first quarter start with the opening balances and either add or subtract the quarters’ figures to record the total savings and loans at that time. Continue filling in this information on a quarterly basis (every 3 months) as members will want to see what is going on. Total up the amount of savings all members have deposited at the end of each quarter and write it
in the appropriate box, and then do the same for the total loans for each quarter. The process of recording savings and loans is continuous so that at every quarter members will know the total savings and loans their co-operative is receiving and lending.
Compare total savings with total loans as a ratio and write that figure in the third row. There must always be enough savings to cover the loan. As a minimum a ratio of $100 as loan should be covered by $200 as savings, a ratio of 1 to 2.
3. Members Loan use
On making an application for a loan members have to fill in a short form explaining what they need the money for. This information is very useful both for the co-operative and for the National Registrar of Co-operatives in being able to analyse the ‘use’ in relation to how well members repay loans. It will also enable the National Registrar of Co-operatives to understand where investment is needed in the future when supporting new savings and loans co-operatives. For each category of loan write in the total number of loans made to members by the co-operative. (It is suggested that this is accumulated for the first five years of using the poster and then an analysis should be done to see which categories of loans are repaid on time and which categories are either late or defaulted on. Then after this five year period start again with current loans only.) The headings used for the loan categories are only guidance you may find you need to change the description of the type of loans made by your co-operative.
3.1.2 Analysing the Commercial Viability of the Co-operative
The analysis of the information in the Strong Co-operatives panel will inform on the strength of financial management and accounting and the capability to keep the accounts on track and up to date. It will also inform on the commercial plans in place and the co-operative’s planning and implementation strengths.
The financial ratios tell us about the health of the co-operative, if it can pay its bills, if it is allowing too much credit to customers, how profitable its operations are and how it compares with similar co-operatives operating in the same sector. The solvency ratio will provide risk data for the purposes of raising finance.
For savings and loans co-operatives the data will tell us how well the accounting and book keeping is, and if there are enough savings to cover loans. The categories of loan use will inform on how, in the future, funds can be allocated in relation to priorities of loan use. Additional data, from the records, on loan repayment in relation to category of loan will be very insightful when determining risk for
future loans.
3.2 Strong People – Social Wealth
The Strong People panel holds information on members and employees and displays to show a three year period. Most of the information for this will come from the members’ register, and other administrative records, about training and possibly advisory visits to the co-operative by the National Registrar of Co-operatives’ staff. It also shows us how much support the co-operative
provides for employees and members, and how interested the employees and members are in learning and training in skills.
Although the emphasises in the example panel is on training if co-operatives have other priorities in relation to supporting its members and customers then this information should be used and replace the training information.

1. Members
We want to know if the membership and share value is increasing or decreasing. From the members register, write in the total number of registered members for each year – divide members into men and women. Out of the total membership calculate and write down the number of members who received dividends in the year (the number of members trading with the co-operative). Then put in
the percentage of that number in relation to total membership to track increase or decrease in member trading. Their share payments will also be recorded in the register, copy the total amount of share value for the year in the section.
2. Training for Members
Co-operatives should invest in paying for members to attend, or travel to, training courses as part of the co-operative principles of education and supporting members to improve their skills. In this section record the number of members attending relevant co-operative training and record the number of courses all members attended.
3. Employees
Write in the number of employees employed by the co-operative, you may need to specify if they are full or part-time. Also, record the number of training courses attended by employees that the cooperative sponsored.
4. Committee Members
One of the ways of strengthening people is for them to participate as a Management Committee member. For each year count the new committee members, those who have never served on the committee before, and add this number to the last year’s total number. Then calculate the current percentage of the number of members who have served on the committee by the total membership. This will provide information on the level of participation by members in the management of the cooperative.
5. Number of Advisory Visits by the National Registrar of Co-operatives’ Staff
Co-operatives are likely to receive support from the National Registrar of Co-operatives or a similar support organisation in the country. Write in the relevant box how many times a year the cooperative has received visits by the Registrar’s staff, state whether they were from a local or national office. You can also write in if there are any plans for visits and if those visits took place as planned.
This will provide information about the National Registrar of Co-operatives’ role in supporting cooperatives to the relevant Ministry.
3.2.1 Analysing Social Wealth
The Strong People panel should provide information on the number of members and their share value, if it is increasing or decreasing; and should provide evidence of how the co-operative is supporting members and employees to improve their skills and confidence. If there is any cost to supporting training this should be recorded as an expense cost. The number of visits by the National Registrar of Co-operatives indicates how supportive the government is in developing co-operatives.
In the Strong People panel some of the information gathered provides basic statistical date on what is happening, it will often not explain why. If co-operative wants to know why, for example, only a small number of members ever serve on committees further investigation will be necessary. Nonetheless the basic information from the poster will be important in establishing the initial findings on which further investigation will need to be conducted.
3.3 Strong Communities – Community and Environmental
Responsibility
There are two sections in the Strong Communities panel; one is Planning and Actions for recording social and environmental plans and actions; and the second section is the SWOT for members and employees to write in any comments they have about how the co-operatives is performing.
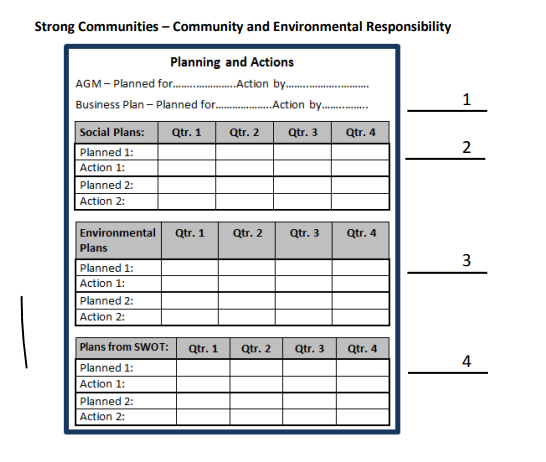
1. Planned and Actual for the AGM and Business Plan
In this section write the date for the planned AGM and the date by which you intend to review the business plan. It is a reflection of good governance to plan these two important annual events well in advance to inform and invite ideas from members. Once they have been undertaken write in the date they were completed.
2. Social Plans
If the co-operative has developed plans for providing support for social purposes in the local community, or school, or for any other purpose, then write this in the plan and provide any targets that can be used to monitor progress. If the plan is to give money to a social project then write in the amount of money and when it is planned to be given and then write the date it actually was given. Furthermore, you might write in what the money will be spent on and how that expenditure can be accounted for.
3. Environmental Plans
Environmental plans can include things the co-operative does to reduce its negative impact on the environment or an initiative to improve the environment. Sometimes this can be the co-operative changing from, for example, diesel energy to solar energy or it could be a new initiative the cooperative is planning to do like recycle plastic bottles into other products for sale, or it may be that the co-operative donates money to an environmental project in the local community and the plan is about expenditure and witnessing the use of that money by the community in undertaking some environmental works.
The information about social and environmental plans should already be in the business plan: copy key statements from the business plan onto the poster. Under the Social and Environmental Plans fill in the plans and targets to show when things should happen and as they are completed write in the actual rows when that happened. Not only will this inform members of the plans but will also show
if the plans are well laid out and if the co-operative carried out the actions as planned.
4. Plans from the SWOT
The Accounting and Audit team, and Management Committee and manager, will look at the comments and ideas written by members in the SWOT section on a regular basis, see next section. Some of these comments will be to do with the general operations of the co-operative, but some may also be about ideas that the co-operative could implement. If the Management Committee decides to implement some ideas immediately they should develop a small plan of action and write it down in this section on the poster. The process will be the same as used in the Social and Environmental plans.
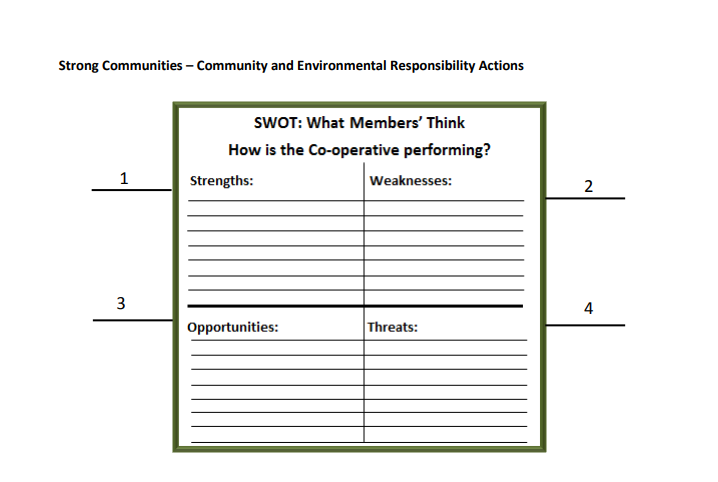
3.3.1 SWOT Analysis
The final section in the Strong Communities panel is a SWOT analysis. This is for members to write in an opinion in answer to the question ‘How is the Co-operative Performing?’
A SWOT Analysis is an exercise that will help identify the Strengths, Weaknesses, Opportunities and Threats in relation to ‘How is the Co-operative Performing?’ The Strengths and Weaknesses are internal influences and Opportunities and Threats are external influences on the co-operative. Ask members to write, in one of the four areas, what they think about the co-operative. Make sure
they feel able to be both positive and negative as this will help the Management Committee understand members’ feelings and attitudes and will likely provide some good ideas on how to improve the performance of the co-operative.
Below is a description of how a SWOT works.
Encourage members to participate in this exercise as it will provide valuable information for the Management Committee when preparing the co-operative business plan for the following year.
1. Strengths
Members should write comments about what they think are good or what is strong about the co-operative.
2. Weaknesses
Members should write comments about what they think are bad or what is weak about the cooperative.
3. Opportunities
Members should write comments about opportunities the co-operative can make use of or of ideas they have for new development or as solutions to problems.
4. Threats
Members should write comments about external threats or problems they see that may affect the performance of the co-operative.
Over time the comments written on the SWOT panel will start to develop a profile of how members and customers see the co-operative and what ideas they have on how to improve its performance. Once members have written in the SWOT section it is there for everyone to see; other members may want to comment of what has already been written and if so this is fine and should be encouraged.
The Accounting and Audit team should review the SWOT comments on a quarterly basis and, if necessary, put in place plans to take action where appropriate. It can be useful if the Management Committee writes a very short summary of the comments and what, if any, actions were taken. At the end of each year these short summary reports should be combined and be presented to members at the AGM.
3.3.2 Analysing Community and Environmental Responsibility
The Strong Communities panel provides information on co-operatives’ social and environmental responsibilities and how good the Management Committee is in planning and implementing its plans. It will also indicate whether the AGM takes place as is required by law and how members respond.
The SWOT analysis will provide evidence of how members feel about their co-operative and what ideas they have to improve its performance. The SWOT profiles what members think, this information should then be used by the Management Committee to review the past year and plan for the next year.
The SWOT information profiles members’ views and ideas, this open approach is an important part of good governance and will also provide the Management Committee and manager with ample information to assist in the forward and strategic planning.