
INTRODUCTION TO SAMPLING METHODS
A large amount of statistics is concerned with the use of samples. Before we look closely at this important area, we must be certain of what we mean by certain terms.
Some Definitions
A sample is a collection of ONLY SOME of the items in which we are interested. If we are concerned with the price of apples in Rwanda on a certain day, we cannot find out the price in every shop in the country and then form a frequency distribution (a tabulation which shows the number of times each different value occurs) – the job would be far too vast. So what we do is to find out the prices in a few shops and hope that they are sufficiently representative of the whole country. The few figures that we do have by this procedure make up our “sample” and the purpose of the theory of sampling is to arrive at methods which will enable us to make our sample results as reliable as they need to be.
The population is ALL the items that we are interested in. In the case above, where we are concerned with the price of apples, the population is every shop where apples are being sold on that day. If we count or measure the whole population it is a CENSUS. The best known example of a census in Rwanda is the census of population which would be carried out by the National Institute of Statistics of Rwanda (NISR).
Sampling methods are useful because we can analyse measurements from the sample and thereby estimate some corresponding measure for the population. For example, the proportion of faulty items in a sample can be used as an estimate of the overall proportion defective in the population. A quantity calculated from a sample is usually called a statistic; corresponding quantities for the whole population are usually called parameters. Thus we may calculate a statistic and use it as an estimate of a parameter. The accuracy with which the sample statistics reflect the population parameters is a primary concern of the theory of sampling.
Why Use Samples?
There are several reasons why we may wish to use samples instead of a census.
- The effort of carrying out a complete investigation may be prohibitive.
- The cost of carrying out a complete survey may be greater than the value of the information collected, and that is not cost-effective.
- The items may have to be destroyed to obtain the data. Some tests used to check the items actually destroy them. If we tested all the production from a match factory, there would not be any matches left to sell.
- There may not be sufficient time to carry out a census.
- The information may not be available to enable a census to be carried out.
Sampling Frames
Before we can start to pick a sample, we must define, as precisely as possible, the population from which the sample is to be taken. If we are going to survey a sample of meat shops in Byumba, then we must define the population by making a list of ALL the meat shops in Byumba. If we mean to carry out a survey of dwelling houses in a particular region, then we need a list of all the streets, with their house numbers or names, in all the places in the region. Such lists of the population to be sampled are called sampling frames.
Great care must be exercised in drawing up a sampling frame because if the frame does not represent the population exactly, then the subsequent samples we draw from it will not be representative; if some items in the population are missed out of the sampling frame, those items have no chance of being included in a sample. In practice, it will be very difficult, if not impossible, to get an absolutely accurate sampling frame, but every effort should be made to do so, and any deficiencies which may be detected should be rectified or noted, so that account may be taken of them when interpreting the results of the survey.
The electoral register is often used as a sampling frame by market research companies. It can never be 100% accurate as the information on households when collected takes a considerable amount of time to be registered and by that time the statistics may be misleading due to factors such as removals, deaths, demolitions and new buildings.
Having decided on the plan of the survey and drawn up the sampling frame, the next consideration is how to take the sample from the sampling frame. For the moment we will assume that the sample size is already decided. (We will consider the theory regarding this later on.) There are many methods of taking a sample, of which the following are the most important:
- Pure or simple random sampling
- Stratified sampling
- Systematic sampling
- Multi-stage sampling
- Cluster sampling
RANDOM OR PROBABILITY SAMPLING
A very important notion is that of randomness in relation to sampling. The word “random” can be defined as “heedless; without aim, purpose or principle”, but this is NOT what the statistician means by it. A sample is random in the statistical sense when, at the time of selecting an item for the sample, every member of the population stands a calculable chance of being included in the sample. All sampling theory is based on this notion and it is most important that you understand and remember it.
Pure or Simple Random Sampling
In this type of sampling, every item in the population has the SAME chance of being included in the sample. As an example, take the case of the national lottery. Here all the numbered “balls” are put into a big drum and whirled about until they are thought to be thoroughly mixed. We all hope and believe that each time the draw is made, all the “balls” in the drum stand the same chance of being picked out – there is no special bias in favour of (or against) odd numbers, even numbers, small numbers, large numbers or numbers of any other particular kind. The winning ”balls”, therefore, constitute a simple random sample. Random samples are, in fact, not at all easy to ensure.
All the sampling theory which is dealt with in this course depends on the true randomness of the samples under discussion. This assumption underlies all the work we do in sampling, so please do not forget it if it is not mentioned in a particular case.
There are two main ways of drawing a simple random sample from a sampling frame, namely:
- Number all the items in the sampling frame. Take an equal number of cards, discs or balls and number them correspondingly. Now thoroughly shuffle the cards (or shake up the discs or balls) and pick out a number of cards equal to the sample size. The items in the sampling frame the numbers of which are the same as the numbers on the sample cards constitute the random sample we require. This procedure is sometimes called “lottery sampling”.
- Number all the items in the sampling frame in an exactly equivalent way, i.e. if the population consists of 9,999 items, these would be numbered 0000, 0001, 0002 …. 0010, 0011 …. 0098, 0099, 0100, 0101, …. 0999, 1000, etc. so that each item is labelled with four digits. Then use a table of random numbers, which are published in books of statistical tables, to select those items which are to make up the sample. These tables have been generated by a computer and to use them you decide on which line and column you are going to start and then you read off numbers systematically (in groups of four in this instance). These numbers might be, for example, 2403, 3234, 9183, …. and you would include in your sample those items in the sampling frame labelled with these digits.
Whenever possible, this method should be used because it has a high degree of guarantee against bias.
These methods can also be adapted to time sampling. For instance, in work study a machine might be checked at random times through the day to see whether or not it was in use.
This type of sampling is known as “activity sampling”. Here the sampling frame is a complete list of, say, five minute intervals through the working day and a simple random sample of these intervals is taken as in (b).
Stratified Random Sampling
A pure random sample, taken as described above, will give a correct representation in a mathematical way of the population from which it is drawn. The results from such a sample can readily be used to make predictions about the parent population. The representativeness of the sample can, however, be improved by stratifying the sampling frame and taking separate, proportionally-sized random samples from each stratum. An example will make this clear.
Systematic Random Sampling
This is the procedure by which items are chosen for a sample by taking them at regular intervals throughout the sampling frame. If the sampling frame contains 10,000 items and a sample of 100 is wanted, then we can take every hundredth item down the list. Provided that the first item is taken properly at random between item No. 1 and item No. 100, the resulting sample will be a random sample. For example, if we use a table of random numbers to pick a number which lies between 01 and 99, we might get 56. For our “systematic” sample we then take, from the sampling frame, items 56, 156, 256, 356, 456 and so on until we have the required sample of one hundred. This speeds up considerably the process of choosing a sample from a large population as compared with a pure random sampling method.
There is one special danger to guard against though; we must be absolutely sure that there is no regularity in the sampling frame at intervals of 100, otherwise we get a biased sample. Yule and Kendall, in “An Introduction to the Theory of Statistics”, quote the example of a sampling frame which consists of a list of all the houses in a long street; a systematic sample of every tenth house is to be taken. If the street is divided into blocks by cross-streets at every tenth house, then there is a risk that every house in the sample may be a corner house (or a mid-block house, or some other regularly occurring type) and this would constitute a biased sample. Unless there is some special reason for using systematic sampling, it is not to be preferred to pure random sampling or stratified sampling.
Multi-Stage Sampling
This is a technique by which the advantages of random sampling are largely maintained, but the extent of the survey area is reduced. It is usually employed in order to cut down the cost of using large numbers of interviewers and of travelling over the survey area.
If a survey is to be carried out in, say, Kigali Province, then interviewers would have to travel all over the region to contact people in a random sample. To overcome this, the province is divided into districts and these districts are used as a sampling frame. The frame may, of course, be stratified into “rural”, “urban”, “municipal borough” classes, etc. Then a sample of districts is taken from this sampling frame; only the sample districts will be surveyed. This is one stage of the sampling scheme. Next, within each chosen district, sub-units, such as streets or electoral wards, are chosen (by random or stratified sampling again); this is stage two. Next, within the chosen sub-units, the persons to be interviewed are chosen, by random or stratified sampling. The number of stages need not, of course, be three – that is merely an example.
Cluster Sampling
Cluster sampling, which is another modification of random sampling, can be used when no sampling frame of all the individual items in a population is available, but a complete sampling frame does exist for some method of grouping individual items. A simple random sample of these groupings is taken and then every item in these selected groupings is used to form the cluster sample.
For example, suppose the Rwandan Housing Authority wished to find out opinions on housing conditions from those living in its suburbs. It would be possible to make a list of all the people in the suburbs and to take a simple random sample of them, but the work involved, both in compiling the list and visiting those selected, who would be dispersed in all the suburbs, would be time-consuming. The list of people living in these suburbs would be much shorter. Once a simple random sample of these suburb areas has been taken, the interviewers have only a limited number of suburb areas to visit and the saving in time, and hence costs, are considerable.
Clustering has its disadvantages as the sample might not be representative of the population as a whole, since it is limited to certain groups. It is thus preferable to have a large number of small clusters rather than a small number of large clusters at the penultimate sampling stage.
Sequential Sampling
Sequential sampling is mainly used in testing manufactured lots or batches of goods. Frequently, a sample from a batch is to be tested to check that it conforms to a standard, and the whole batch accepted or rejected on the basis of this test. Often, the items in the sample must be tested one at a time using a lengthy time-consuming test. Before all the items have been tested, it may be possible to say whether it will pass or fail.
If at a given point it is possible to say that the batch has definitely failed, or definitely passed, testing is stopped at this point. Otherwise, the sampling and testing process continues. Therefore, in sequential sampling, the actual size of the sample is not fixed in advance, although the maximum possible sample size is fixed.
NON-PROBABILITY SAMPLING
Quota sampling is a sampling method which does not use a sampling frame, and such a method is referred to as a non-probability sampling method.
In surveys involving personal interviews, the technique of “quota sampling” has been developed to economise on interview costs. Briefly, the method is that the interviewer is instructed to conduct interviews until a certain number have been completed (say 250). The choice of persons to interview is left entirely to the interviewer, and he is not given a list of specific persons, sampled from the sampling frame. The respondents, however, must usually satisfy specific criteria regarding age, occupation, etc.
The risk of bias in quota sampling is quite serious, because the interviewer may subconsciously select only those people who look “friendly”; or the quota may be completed at a time and place where certain types of people predominate, e.g. women at shopping times, workers outside a factory as the shift comes out. Because the technique usually requires less interviewer effort (in travelling time, or calling back where no response is given), it is often used by agencies conducting public opinion polls.
To overcome the disadvantage of bias just mentioned, the interviewers are usually given good training and advice as to how such bias may be guarded against. Furthermore, they are normally given quotas within predetermined strata, e.g. interview 50 women at their homes, 50 women entering shops, 25 women passers-by, 100 men in the street, 25 men in shops. Nevertheless, the drawbacks are serious and quota sampling should not be used without a very close examination and appreciation of its shortcomings.
OBJECTIVES OF SAMPLING
Introduction
There are various reasons why we use sampling techniques. In general terms there are three areas where samples are employed to obtain information about the population in which we are interested. The areas are:
- Estimating or forecasting, e.g. marketing of a product.
- Discovery or investigating, e.g. the effect of a high protein diet on farm animals.
- Accepting or quality control, e.g. accepting a batch of machined parts.
Estimating
In the business world, with which we are mainly concerned in this course, this is probably the most common reason for the use of sampling techniques. The uses are too numerous to mention them all, but a few examples are market research, analysis of sales or customers and forecasting production times or quantities.
The statistical values in which we may be interested are mean values, the variance or standard deviation, comparison of one population with another, etc. (We will come back to this subject later on.)
Discovery
There is often the need to discover what is, or is not, occurring. The accountant may wish to detect any fraud, while the production manager may want to find out if the increase in the number of machine breakdowns is significant or due to random chance. The medical researcher may be interested to discover if there is any relationship between smoking and lung cancer.
In many cases the population is too large or complex to carry out a census, so samples are collected and analysed.
Quality Control
The use of sampling in quality control is well established. The quality being surveyed may be the engineering tolerances on a precision product, the accuracy of invoices, or the lighting ability of a match.
The general idea is that a batch (or day’s production, etc.), which is the population, is accepted or rejected on the information provided by a sample.
INTRODUCTION TO CLASSIFICATION AND TABULATION OF DATA
Having completed the survey and collected the data, we need to organise it so that we can extract useful information and then present our results. The information will very often consist of a mass of figures in no very special order. For example, we may have a card index of the 3,000 workers in a large factory; the cards are probably kept in alphabetical order of names, but they will contain a large amount of other data such as wage rates, age, sex, type of work, technical qualifications and so on. If we are required to present to the factory management a statement about the age structure of the labour force (both male and female), then the alphabetical arrangement does not help us, and no one could possibly gain any idea about the topic from merely looking through the cards as they are. What is needed is to classify the cards according to the age and sex of the worker and then present the results of the classification as a tabulation. The data in its original form, before classification, is usually known as “raw data”.
. FORMS OF TABULATION
We classify the process of tabulation into Simple Tabulation and Complex or Matrix Tabulation.
Simple Tabulation
This covers only one aspect of the set of figures. The idea is best conveyed by an example. Consider the card index mentioned earlier; each card may carry the name of the workshop in which the person works. A question as to how the labour force is distributed can be answered by sorting the cards and preparing a simple table thus:
Note that such simple tables do not tell us very much – although it may be enough for the question of the moment.
Complex Tabulation
This deals with two or more aspects of a problem at the same time. In the problem just studied, it is very likely that the two questions would be asked at the same time, and we could present the answers in a complex table or matrix.
SECONDARY STATISTICAL TABULATION
So far, our tables have merely classified the already available figures, the primary statistics, but we can go further than this and do some simple calculations to produce other figures, secondary statistics. As an example, take the first simple table illustrated above, and calculate how many employees there are on average per workshop. This is obtained by dividing the total (3,000) by the number of shops (5), and the table appears thus:
RULES FOR TABULATION
The Rules
There are no absolute rules for drawing up statistical tables, but there are a few general principles which, if borne in mind, will help you to present your data in the best possible way. Here they are:
- Try not to include too many features in any one table (say, not more than four or five) as otherwise it becomes rather clumsy. It is better to use two or more separate tables.
- Each table should have a clear and concise title to indicate its purpose.
- It should be very clear what units are being used in the table (tonnes, RWF, people, RWF000, etc.).
- Blank spaces and long numbers should be avoided, the latter by a sensible degree of approximation.
- Columns should be numbered to facilitate reference.
- Try to have some order to the table, using, for example, size, time, geographical location or alphabetical order.
- Figures to be compared or contrasted should be placed as close together as possible.
- Percentages should be pleased near to the numbers on which they are based.
- Rule the tables neatly – scribbled tables with freehand lines nearly always result in mistakes and are difficulty to follow. However, it is useful to draw a rough sketch first so that you can choose the best layout and decide on the widths of the columns.
- Insert totals where these are meaningful, but avoid “nonsense totals”. Ask yourself what the total will tell you before you decide to include it. An example of such a “nonsense total” is given in the following table:
SOURCES OF DATA AND PRESENTATION METHODS
Sources, nature, application and use:
Sources
Data is generally found through research or as the result of a survey. Data which is found from a survey is called primary data; it is data which is collected for a particular reason or research project. For example, if your firm wished to establish how much money tourists spend on cultural events when they come to Rwanda or how long a particular process takes on average to complete in a factory. In this case the data will be taken in raw form, i.e. lots of figures and then analysed by grouping the data into more manageable groups. The other source of data is secondary data. This is data which is already available (government statistics, company reports etc). As a business person you can take these figures and use them for whatever purpose you require.
Nature of data.
Data is classified according to the type of data it is. The classifications are as follows:
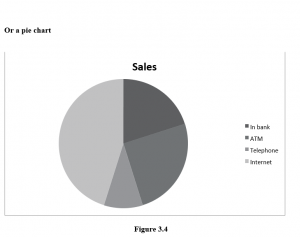
Categorical data: example: Do you currently own any stocks or bonds? Yes No This type of data is generally plotted using a bar chart or pie chart.
Numerical data: This is usually divided into discrete or continuous data.
How many cars do you own? This is discrete data. This is data that arises from a counting process.
How tall are you? This is continuous data. This is data that arises from a measuring process. Or the figures cannot be measured precisely. For example: clock in times of the workers in a particular shift: 8:23; 8:14; 8:16….
Whether data is discrete or continuous will determine the most appropriate method of presentation.
Precaution in use.
As a business person it is important that you are cautions when reading data and statistics. In order to draw intelligent and logical conclusions from data you need to understand the various meanings of statistical terms.
Role of statistics in business analysis and decision making.
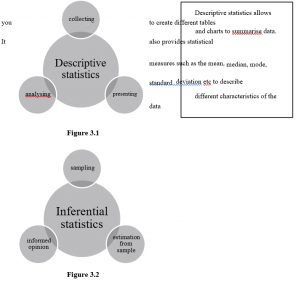
In the business world, statistics has four important applications:
- To summarise business data
- To draw conclusions from that data
- To make reliable forecasts about business activities – To improve business processes.
The field of statistics is generally divided into two areas.
Improving business processes involves using managerial approaches that focus on quality improvements such as Six Sigma. These approaches are data driven and use statistical method to develop these models.
– Presentation of data, use of bar charts, histograms, pie charts, graphs, tables, frequency distributions, cumulative distributions, Ogives. – Their uses and interpretations.
If you look at any magazine or newspaper article, TV show, election campaign etc you will see many different charts depicting anything from the most popular holiday destination to the gain in company profits. The nice thing about studying statistics is that once you understand the concepts the theory remains the same for all situations and you can easily apply your knowledge to whatever situation you are in.
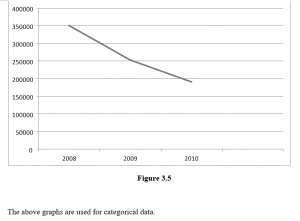
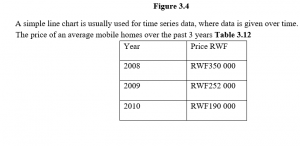
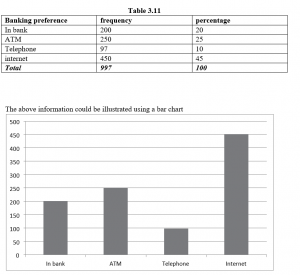
Tables and charts for categorical data:
When you have categorical data, you tally responses into categories and then present the frequency or percentage in each category in tables and charts.
The summary table indicates the frequency, amount or percentage of items in each category, so that you can differentiate between the categories.
Supposing a questionnaire asked people how they preferred to do their banking:
Numerical Data
Numerical data is generally used more in statistics. The process in which numerical data is processed is as follows.
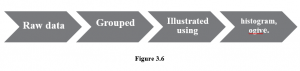
The Histogram:
The histogram is like a bar chart but for numerical data. The important thing to remember about the histogram is that the area under the histogram represents or is proportionate to the frequencies. If you are drawing a histogram for data where the class widths are all the same then it is very easy. If however one class width is bigger or narrower than the others an adjustment must be made to ensure that the area of the bar is proportionate to the frequency.