
In a market place, there are many different groups of people. Each group has its own reason for being into the market. There are those who have brought commodities for sale. There are others who have come with their money to purchase commodities to satisfy their needs.
Standardisation Culture!
We should be very keen and alert when purchasing commodities in the market. Ensure you purchase products that have the Rwanda standardisation mark of quality. Standardised products last longer than unstandardised products.
A market is generally a meeting point between buyers and sellers. It can be a physical place or online. It is also a mechanism that facilitates buyers and sellers to meet with an aim of exchanging a particular commodity. Commodities have to be exchanged at a price. Price refers to the relative value of a commodity expressed in some monetary terms. Different commodities in a market have different market values or prices expressed in monetary terms.
Financial Education!
Always remember to make a budget before going to the market to do some shopping. This is because money will never be enough. As a buyer, purchase only those commodities needed most to satisfy the basic needs before purchasing other commodities that are needed, but not very necessary.
5.1.1 Meaning and types of price
Activity 5.2
Attempt the following questions:
In groups of five, organise yourselves into buyers and a seller. Biro pens, exercise books, textbooks, pencils and foolscaps as items to be sold. As a seller, ask for or quote a higher price. As a buyer, quote or offer a lower price. Through bargaining, come up with an agreeable amount that both parties will be satisfied.
- Why did the seller reduce the price from the one he or she had quoted earlier?
- Suppose the buyer walked away from the seller, could he or she have found another place to purchase the products? Explain.
- What happens if the seller in the market practices monopoly? (The seller is the only one providing the given items in the market).
There are different types of prices that can be looked at this level.
Reserve price. The producer makes a commodity for purposes of sale. During the production process, the producer incurs expenses. These expenses are called costs of production. When the producer takes his commodity to the market, there is a starting price on which the commodity will be sold. This minimum price that the supplier or producer can accept in exchange
Equilibrium price: This is the price ruling in the market at which the buyers wholly clear what has been brought to the market by suppliers. At this price, quantity demanded is equal to quantity supplied. There is no excess or shortage in the market at this price. Equilibrium price (Pe) can be illustrated as shown below:
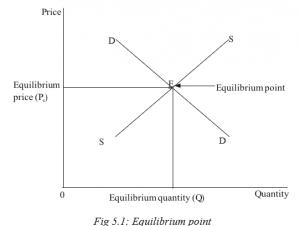
At Qe, (equilibrium quantity) quantity demanded is equal to quantity supplied. At Pe, all the commodities that have been brought to the market are bought by the available buyers. At equilibrium point, everybody gets what he or she wanted and goes home satisfied.
Market price. This is a short run price at which goods and services are sold in the market during a given period of time. When you visit a market, you find different commodities selling at different prices, depending on the demand and supply of each commodity. Each commodity thus has its own market price.
Normal price. This is an equilibrium price that has remained stable for a long period of time. It is a long run equilibrium price attained after all adjustments in the market forces have taken place.
Meaning and types of market


As defined earlier, a market is a mechanism that facilitates buyers and sellers to meet with the aim of exchanging a particular commodity at a price. In a market, there are commodities that are sold and bought. Thus the function of a market is to bring together sellers and buyers and enable the exchange of goods and services to take place.
5.1.2.1 Types of markets
Markets may be differentiated depending on the commodity that is sold. Therefore, we may have the following categories of markets.
(a) Commodity market
This is a market that is involved in the exchange of consumer goods. Producers of such goods meet with consumers and they negotiate the exchange. Some of the goods sold on a commodity market include foodstuff, clothes and shoes of all types, books and all stationery, furniture and kitchenware items such as cutlery.
Environment, Climate Change and Sustainability!
A clean environment enables sellers and buyers to exchange their commodities with ease. We should always remember to keep our environment clean. A dirty environment is a source of waterborne and airborne diseases. Sickness reduces the productivity of sellers and buyers. In addition, money budgeted for basic needs will be converted to buying medicine and general care of the sick.
(b) Capital market
This is a market that deals with the buying and selling of financial products. The commodities sold on a capital market are basically financial products usually called securities. They include shares, debentures, private and government bonds. Capital markets help firms to raise investment capital that is essential for expansion of the firms’ activities. Transactions on a capital market are done through intermediaries called agents, brokers or dealers. An example of a capital market is Rwanda Stock Exchange.
(c) Factor market
In a factor market, the commodities traded are factors of production. Buyers and sellers meet to negotiate exchange of factors of production at a factor price. Factor prices are payments or rewards for factors of production like rent or wage.
(d) Foreign exchange market
In this era of globalisation, regional integration and free trade, there is global movement of people, goods and services worldwide. This calls for transactions that involve currencies of different countries. Currency or foreign exchange market is a market where currencies are traded. The major players in this market are banks, importers and exporters, currency centres and forex bureaus.
(e) Free market
This is a market where the forces of demand and supply operate freely without any interference in determining the resource allocation. There are no controls enforced by other forces like the government. Free market prices for goods and services are set freely by consent between sellers and buyers without any interference by a government, price-setting monopoly, or other authority.
(f) Open market
An open market is an economic system where the economic actors are left to trade without persistent external constraints. In this market, buyers and sellers enjoy free access as the entry and exit is only regulated by competition. This is made possible by having reduced or non-existent state regulation on the market. In this market, the scope of government regulation is low or less stringent. In an open market, the presence or absence of the government regulation does not get in the way of free trade and trading operations of the market. However, the reality is that there are few markets that can be left to operate in such an ideal manner, since the government plays a role in the regulation of virtually all markets. This is because every market is subject to certain legal restriction and expectations by the government. These legal regulations are responsible for controlling contractual agreements, financial obligations and guide transactions within a market system.
Conspicuous features of an open market
- Absence of government regulations
- Little or no licensing requirements
- Absence of taxes, subsidies and customs
- There is no unionization or structured state control
- No barriers to entry and exit of the market
5.1.3 Price determination in the market
- Commodity market
- Capital market
- Factor market
- Foreign exchange market
(b) Discuss the ways that may have been used by the parties involved in the above markets to arrive at the price they sold or bought at.
In a market, there are different ways through which prices are determined. Prices may be determined by producers, or through negotiations between buyers and sellers, or by the government. The following are the ways through which prices are determined:
- Demand and supply: The interaction between the forces of demand and supply determine the price in the market. When demand exceeds supply, there is a rise in the price level. When supply exceeds demand, there is a fall in the price level. When the market forces of demand and supply are allowed to interact without interference, equilibrium is attained in the market where quantity demanded is equal to quantity supplied.
- Sales auction (bidding): This is where there is one seller and many buyers competing for the available commodity. Each buyer offers the price he or she is willing to pay for the commodity. The one offering the highest price (normally called the highest bidder) takes the commodity. Such a method is usually used in awarding contracts in the construction industry.
- Price legislation: This is where the government fixes the price. The government can either fix the maximum price or minimum price. In many cases the government fixes or sets the maximum or highest price. It becomes illegal for one to buy or sell above the legislated price.
- Haggling/bargaining: This is a negotiation between the buyer and the seller. The seller demands for a higher price while the buyer offers a lower price. Each of them keeps adjusting until they reach a price upon which they both agree to exchange.
- Resale price maintenance: This is where the producer fixes the price. Examples of goods whose price is fixed by the producer include newspapers, magazines and airtime cards. Most of these goods have the price branded on them.
- Treaties (agreements): These are agreements between buyers and sellers or sellers alone on prices at which they should buy or sell a particular commodity. This is usually done to avoid sellers selling at very low prices to counter the competition.
- Price leadership (Imperfect collusion): This is where the biggest and low cost firm in the industry sets the price for a commodity for other firms in the industry to follow. Such a firm (also called price leader) may be the oldest firm (barometric price leader). Such firms enjoy large economies of scale. They have a wide experience in the market, thus are market leaders.
- Cartel arrangements (perfect collusion): This is where firms in the industry, usually producing a homogeneous product, come together in an arrangement to fix a price for their commodity. The major reason behind such an arrangement is to avoid stiff price competition that may lead to losses by increasing costs on advertising. An example of a cartel is the Organisation of the Petroleum Exporting Countries (OPEC).
5.1.4 Factors determining price in the market
Activity 5.6
In groups of five, read the following passage and answer the questions that follow.
In the past years, the number of trucks carrying fuel from the port of Mombasa in the Republic of Kenya into Rwanda reduced. It was said that the cause of this was some barrier along the route that disrupted production of crude oil in producer countries like Libya and countries in the Middle East. At pump stations countrywide, there was scarcity of fuel.
If the government had not acted quickly to address the situation, pump prices would have shoot up tremendously.
- Discuss the effect of scarcity of fuel on:
- The pump price of fuel.
- The price of commodities in the markets countrywide.
- The amount of goods and services that people can be able to purchase.
- Read the last sentence again in the above text. Explain ways in which the government may have used ‘to address the situation’.
- From your group discussions, make a class presentation.
Discovery
The following are the factors that determine the price of a commodity in the market:
- Cost of production
- Level of competition in the market
- Government policy
Facts
- Cost of production: Producers incur expenses during the production process. They pay workers (human labour), buy raw material, incur insurance and security costs, pay for power and rent. Such expenses constitute costs of production. The producer’s aim is to recover the amount spent during production and earn some profit after the sale of the product. The pricing decision must take into account the cost of producing each unit of output (average cost).
- Level of competition in the market: In a market where there are many producers of a similar product, competition is normally high. Many producers opt for a price reduction so a to sell their commodities easily and faster. This may be in the form of a discount, buying more goods for a less price, or offering free gifts upon purchase of a certain amount. Thus through price reduction of the selling price of a commodity, customers are be motivated to purchase their goods. Producers also use other forms of non-price competition like advertising, offering after sales services and even free transport to the customers’ premises.
- Government policy: The government through price legislation influences the level of commodity prices. This is especially so when the commodity is an essential but scarce or strategic to the economy. Prices for such commodities like fuel, water and power (electricity) are usually under the control of the government.
- Demand and supply of the commodity: In taking decisions on price for a commodity, the producer considers the numbers and capacity of his or her customers, and the amount of output that has been produced. When demand for the product seems higher than the output, the price is slightly raised. If the output is more than the demand, then in order to capture the market, the price is slightly reduced.
- The type of product: Manufactured or processed commodities have a higher price than unprocessed commodities. Similarly, branded commodities are usually priced higher than unbranded products.
5.2 DEMAND
Demand refers to the desire and willingness backed by the ability to purchase a particular good or service at a given time. It implies that the buyer has a need that can be satisfied by the commodity in question, and he is able to pay the price at which that commodity is selling.
Facts
Quantity demanded is the amount of the commodity that a buyer is willing and able to purchase at a given price over a given period of time. Buyers shall be willing to purchase different amounts of a commodity at different prices.
Effective demand is the desire backed by the ability to purchase a given commodity at a given price and the actual buying of the commodity. Effective demand means that the consumer wants the commodity, has the required amount of money to buy it, the commodity exists in the market, and the consumer actually buys the commodity.
Market demand
This refers to the total demand for all consumers of a particular commodity in the market at a particular time.
Facts
An economy is composed of different sectors: the household sector, the business sector, the government sector and the foreign sector. All these sectors purchase commodities for various purposes. Aggregate demand therefore is the summation of the demand of all purchasing units in all sectors of the economy.
Aggregate demand = C + I + G + (X-M)
Where,
C = Consumer expenditure (total consumption by households on consumer goods and services.
I = Private investment expenditure by firms (expenditure on capital goods/services).
G = Government expenditure (total purchases by the government).
X = Exports (foreign expenditure on locally produced goods and services).
M = Imports (local expenditure on foreign goods and services).
Government expenditure includes all expenses the government incurs on health, education, transport, law, defence and security sectors.
General price level
Discovery
I have realised that the following factors determine the demand for good or commodity.
- Price of the commodity
- Income of the consumer
- Price of other commodities
- Weather
- Government policy
- Tastes and preferences
- Population
- Past levels of income
- Future price expectations
Facts
- Price of the commodity: Price changes in the market influence the amount of a commodity that buyers can purchase. When the price of the commodity increases, buyers’ ability to purchase reduces. This in turn reduces the quantity demanded. When its price reduces, the quantity demanded increases. This is because the ability of the buyer increases.
How changes in income influence quantity demanded
Activity 5.10 Case study
Mutoni works in a tea company and earns 100,000 FRW per month. At this level of income, she has the following monthly budget.
One kilogramme of salt, one kilogramme of meat, 2 litres of milk, 1 kilogramme of sugar, 2 loaves of bread and her normal rent. On the other days, she consumes beans.
In your groups, discuss how Mutoni’s consumption of the above commodities may change if her salary was raised to 500,000 FRW per month.
What will happen if her salary was reduced to 500,00 FRW per month? Advise Mutoni concerning her expenditure and savings.
- Income of the consumer: Income of the consumer influences the amount of a commodity that can be purchased at a time. Assuming that the price of the commodity in the market remains constant, increase in the consumer’s income raises his or her ability to purchase more of the commodity. Similarly, a fall in income reduces the ability of the consumer to purchase the commodity. However, the nature of the commodity and the buyer’s consumption preference has an effect on it.
Thus, increase in the income of the consumer increases the quantity of goods demanded by the consumer and vice versa. This applies to normal goods. In cases where increase in the income of the consumer reduces quantity of goods demanded and vice versa, such goods are called inferior goods. If increase (or decrease) in income of the consumer does not largely affect quantity of goods demanded, such goods are called necessities.
How change in prices of other related commodities influence quantity demanded of a commodity
Activity 5.11
Read through the following statements.
- The price of Colgate remained constant at 1000 FRW while that of Close-up decreased from 1200 FRW to 800 FRW.
- The prices of cars doubled while that of fuel remained constant,
- The price of STI drugs remained constant but that of vacuum flasks increased.
In your groups, study the above cases and discuss what would be their effect on the market for the 2nd commodity in each case.
Make class presentations of your discoveries.
3. Price of other commodities
Goods or commodities that serve the same purpose are termed as substitutes. For instance, Close-up and Colgate are substitutes. Increase in the price of one of the substitutes (such as Colgate in the above example) will lead to increase in quantity demanded of other substitute goods (such as Close-up). Similarly, decrease in the price of one of the substitutes will lead to increase in the quantity demanded for that good and decrease in demand for other substitute goods.
Goods or commodities that are used together at the same time like a car and fuel are called complimentary goods. Increase in the prices of complementary goods reduces the quantity demanded of the other good and vice versa.
There are commodities however such as beans and electric tubes that are not related at all in consumption. Increase in the price of one such commodity does not affect quantity demanded of other unrelated commodities.
4. Seasons
Certain goods are demanded more during certain weather conditions. For instance demand for gumboots and raincoats increases during the rainy season. Demand for examination success cards and Christmas cards go with their respective seasons too.
How the government influences quantity demanded of a commodity
Activity 5.12
In your groups, discuss how the government influences;
(a) The amount of computers the public can purchase from the market. (b) Family planning kits and contraceptives the public can use.
5. Government policy
The government influences quantity demanded of a commodity through taxation, offering subsidies and price legislation. Taxes, both direct and indirect reduces quantity demanded of a commodity. Direct taxes reduce consumers’ disposable incomes while indirect taxes increase the costs of production and prices of goods and services. Subsidisation of consumers by the government increases quantity demanded of a commodity by making the commodities cheap. Subsidisation of producers reduces their costs of production, which keeps producers’ prices low. Minimum price legislation reduces quantity demanded because the price is fixed above the equilibrium price. Maximum price legislation increases quantity demanded because the price is fixed below the equilibrium price.
6. Tastes and preferences
Changes in fashion, education, religion, habit and general lifestyle affects the consumption patterns of the population. This in turn influences demand for a particular commodity. For instance, if a large proportion of the population converts to Islam, demand for pork reduces.
7. Population
This affects aggregate demand by increasing consumption. As the population of the country increases, total consumption is also affected. Demand in an area increases if that area receives immigrants. Similarly, if people move out of an area (migrate) demand of goods for that area will go down.
8. Past levels of income
The higher the past level of income, the higher the demand and vice versa. This is because the consumer will be used to high spending.
9. Future price expectations
When prices are expected to increase in the future, quantity demanded increases in the current period. This is because buyers tend to make more purchases and stock for fear of paying higher prices in the days to come. This however depends on the nature of the commodity in question. Similarly if there is an anticipation of decrease in prices of commodities in future, then the current demand for such commodities will reduce.
Facts
The law of demand states that “the higher the price of a commodity, the lower its quantity demanded and the lower the price, the higher its quantity demanded, ceteris paribus.” Ceteris paribus simply means holding all other factors (except price) that affect demand constant. The law of demand assumes the changes or the effect of other factors. When the price of the commodity increases, buyers purchase less of the commodity. When the price reduces, buyers shall be willing and able to purchase more of the same commodity.
Ceteris paribus helps to make economic analysis accurate and derivation of economic laws and principles easy. In the demand theory, when the other factors that may influence quantity demanded are assumed constant, then quantity demanded relies on price.
Facts
A demand schedule is a table showing different quantities of a commodity that can be purchased at different prices per period of time. It can be illustrated as shown above.
Recall
Prepare demand schedules showing the different sizes and amounts per size using the following information. The first one has been done for you.
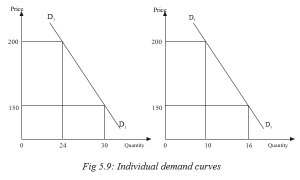
An individual demand curve shows a graph of price of a given commodity against the quantities purchased by a given consumer. It shows the consumption of a single consumer in the market. This means each individual consumer has his or her own demand schedule and demand curve.
Individual A’s demand curve Individual B’s demand curve
A market demand schedule is a table showing the various quantities that individuals can purchase at given prices. The table in Activity 5.16 is an example of a market demand schedule.
A market demand curve shows a summation or summary of quantity demanded by all individual households in the market for a particular commodity. It is a summation of different individual demand curves. A market demand curve is more elastic than an individual demand curve. From the table in Activity 5.16 above, we can derive the following market demand curve.
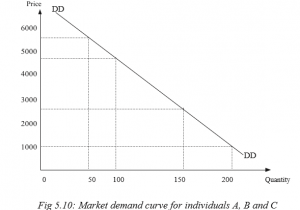
Fig 5.10: Market demand curve for individuals A, B and C
Market demand curve is obtained by plotting a graph of price against the total quantity demanded. Total quantity demanded is the sum or total of individual quantities at given prices.
5.2.7.1 The demand function
This is a technical statement that displays the relationship between the quantity demanded of a commodity and the factors that influence its quantity demanded. Thus,
Qdx = f (Px, Y, Pn, S, G, T, …)
Where
Qdx = Quantity demanded of commodity X.
PX = Price of commodity X.
Y = Income of consumers.
Pn-1 = Price of other commodities.
S = Seasons.
G = Government policy.
T = Tastes and preference.
… = Others
In summary, the demand function has the quantity demanded on one side and all the factors that affect demand (price of the commodity, income of consumers, price of substitute and complementary goods, seasons, government policy, changes in tastes, preferences and fashion) on the other side.
Slope of the demand curve
5.2.8.1 The law of diminishing marginal utility and the slope of the demand curve
3rd
4th
5th
Attempt the following questions:
- Which bottle of soda took less time to finish and why?
- Can you explain the difference in the time spent while taking each bottle?
- Which bottle did you enjoy most? Why?
- Which bottle did you enjoy less? Why?
- If you were asked to pay differently for the bottles, which one would you have paid highly and which one would you have paid less. Explain your answer.
- Redraw this table and attach a price to each of the bottles consumed in your table.
- Draw a graph to represent the information in the table above.
- Comment on the shape of your curve.
- Compare your curve with the one you drew in Activity 1.15 and derive a conclusion.
Discovery
A normal demand curve slopes downwards from left to right. This curve shows or satisfies the law of demand. It shows that at high prices, quantity demanded reduces and at low prices, quantity demanded increases. When the price of a commodity increases, buyers purchase less of that commodity and vice versa.
Facts
In the above activity, the consumer consumes more and more of the commodity at the beginning than as they proceed on. With time, the satisfaction derived from each extra unit consumed reduces. If the consumer were to be allowed to price the commodity, then the quantities consumed at the beginning could be priced higher than the quantities consumed later. This is because the consumer derived more satisfaction at the beginning than towards the end. All these explain the law of diminishing marginal utility.
This law states that as an individual consumes more of the quantity of a commodity, the marginal utility got from consuming an extra unit of a commodity keeps on decreasing. Marginal utility refers to the extra satisfaction a consumer gets from consuming an extra unit of a given commodity. In Economics, satisfaction is also called utility. In Activity 5.17 above, the first bottle of soda consumed has more utility or satisfaction to the consumer than the extra bottles. Hence the consumer will be willing to pay a high price at the beginning because the marginal utility will be high and a lower price for each extra unit consumed. As quantity increases, satisfaction derived from each unit consumed reduces. Marginal utility therefore determines the price of the commodity.
5.2.8.2 Reasons for a normal demand curve
Activity 5.18
Akanyana is an employee of Inyange Industries Ltd. She earns 200,000
FRW per month. Assume she spends all her income on cloth. One piece of cloth costs 10,000 FRW.
- Determine how many pieces she will purchase at this price.
- How many pieces will she purchase if the price of cloth decreased to 5000FRW per piece?
- What will happen if the price increased to 25,000 FRW per piece? Find out what will happen if the price remains constant but the income increases to 300,000 FRW.
Facts
- Change in the real income of the buyer: Assuming the money income of the consumer remains constant, when the price increases, the amount of goods that one’s income can purchase reduce. At higher prices, the ability of the buyer to purchase commodities reduces. The ability however increases at lower prices.
- Presence of substitutes: When the price of a commodity increases, and that of its substitute remains constant, consumers substitute goods whose prices have increased with those whose prices have remained constant (substitution effect). So less of the commodity will be
- Consumption behaviour of low-income earners: Low-income earners usually buy less when the price is high and buy more when the price is low. This is because the income is not enough to cover the amount of a commodity they would wish to purchase especially when prices increase.
5.2.9 Types of demand
Activity 5.19
- The price of commodity X decreased from 3,500 FRW per unit to 1,000 FRW per unit leading to a decrease in quantity demanded of commodity Z from 80kgs to 30kgs.
How is the demand for X related to the demand for Y?
Give examples of such commodities.
- The price of commodity Y doubled leading to a decrease in the quantity demanded of commodity W.
How is the demand for Y related to the demand for W. Give examples of such commodities.
Discovery
The following are the main types of demand.
- Independent demand
- Joint/complementary demand
- Competitive demand
- Composite demand
- Derived demand
Facts
1. Independent demand
There are commodities whose demand is not influenced by the demand for other commodities. Consumption of one commodity is not related to the consumption of another. The demand for these commodities is not related at all. A change in demand for one commodity does not affect the demand for the other. Such commodities are said to have independent demand. An example is sugar and a mattress. The two goods are not related at all, neither are their functions.
2. Joint/complementary demand
This is demand for commodities that are used together. Increase in demand for one commodity leads to increase in demand for another. Examples of such commodities include cars and fuel, leather shoes and shoe polish, guns and bullets. For instance, when the price of cars reduces, many people will buy cars. As quantity demanded of cars increase, more of fuel (petrol) will also be demanded. Such commodities that are consumed together are called complements. Their demand is thus called joint or complementary demand.
3. Competitive demand
These are commodities that serve the same purpose. Examples include airtime cards from companies such as Airtel and TIGO, or newspapers from companies such as New Times Rwanda or Inyarwanda. Increase in demand for one of the commodities reduces the demand for the other. MTN voice and data communication service can for instance, be substituted with similar services from Airtel and TIGO. If MTN increases the price of its services, it is likely to lose customers to Airtel and TIGO. As a result quantity demanded of MTN services will reduce.
4. Composite demand
Some commodities are used in different ways. For instance, electricity can be used for lighting, cooking, industrial purposes and ironing. Demand for electricity is a combination of all these uses. Thus composite demand is demand for a commodity that has many uses such that demand for such a commodity sums up all the uses it servers.
5. Derived demand
The demand for factors of production comes as a result of demand for the goods and services that these factors help to produce. For instance, when demand for sugar increases, it will require Kabuye Sugar Works (KSW), the producers of sugar, to increase production. This makes KSW Ltd to demand for more factors. Derived demand therefore is the demand for a commodity not for its own sake but because of demand for another commodity (demand for factors of production).
5.2.10 Abnormal demand curves
Activity 5.20
Use the information in the table below to illustrate a demand curve. Price of commodity X in FRW Quantity demanded of commodity X in Kgs
5000 25
6000 25
7000 25
8000 25
Answer the following questions:
- Comparing your curve with the demand curve in activity 5.15, what do you notice on your curve?
- Does your curve respect the law of demand? Give reasons for your answer.
- Discuss the market conditions that may lead to the shape of your curve.
- Can you identify other conditions that may make a demand curve violate the law of demand?
- Illustrate other kinds of demand curves that do not follow the law of demand.
Discovery
In the above activity, the curve does not comply or rhyme with other curves that obey the law of demand. The graph does not respect the law of demand. Further research shows that the following market conditions or conditions may lead to such graphs and other unique graphs that do not obey the law of demand.
- When there is a depression.
- When there are goods of ostentation (luxuries).
- When consumers expect prices to change in future.
- When there are giffen goods.
- When consumers are ignorant of the market conditions.
- If commodity is a necessity.
Facts
1. When there is a depression
An economic depression is a downturn in economic conditions of a country or region. This happens when the level of economic activities slows down, incomes reach their minimal levels, unemployment is high, aggregate demand is low and the volume of production is at its lowest. During such periods, even if the price for a particular commodity reduces, its quantity demanded may not increase. This is because consumers’ capacity to purchase is limited.
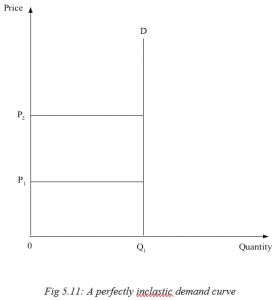
At price OP1, quantity demanded is Q1. When the price increases from OP1 to OP2, quantity demanded remains constant at OQ1 . This contradicts the law of demand, thereby creating an abnormal demand curve.
2. When there are goods of ostentation (luxuries)
These are goods that have a conspicuous consumption. They are consumed to emphasise or determine the level or status of the consumer. When their prices increase, the consumer buys more of them in order to illustrate his or her status in society. When the price reduces, the consumer abandons them to buy something else which is expensive. Demand for expensive I Pads, smart phones, jewelleries and expensive cars like Range Rovers demonstrate this effect. This violates the law of demand.
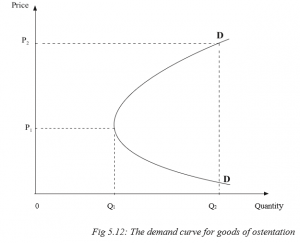
At price OP1, a lower quantity OQ1 of the luxurious commodity is purchased. At a higher price OP2, more quantity OQ2 is demanded. The demand curve for goods of ostentation is abnormal at higher prices.
3. When consumers expect prices to change in future
When prices of commodities are expected to increase further in future, the consumer will buy more of the commodities even when there is an increase in the current price of the goods. This is because the consumer fears to buy the same commodities at much higher prices in future. Similarly, when prices are expected to decrease further in the coming days, consumers buy less in the current period waiting for prices to reduce further.
4. When there are giffen goods
Giffen goods are those goods where less is purchased at low prices and more is purchased at higher prices. The consumption behaviour of lowincome earners presents us with a Giffen paradox. These goods take a large portion of their income. An example is the cheap or easily accessible foodstuffs. At very low prices, low-income earners are able to make their usual purchases and remain with some income. The remaining balance can afford the consumers to purchase another commodity they could not think of. As a result, consumers will buy less of what they usually buy as its price falls. They spend the remaining portion of their income on the other commodities they could not afford before. When prices of such commodities increase, low-income earners forget about the other commodities, and buy more of the giffen good.
Price
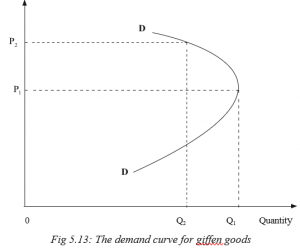
At price OP1, the consumer buys quantity OQ1. When the price increases to OP2, quantity demanded reduces to OQ2. This is because as the price reduces, consumers buy less of the giffen good in order to remain with some more income to purchase another commodity that they would not afford before. The demand curve for giffen goods is abnormal at lower prices.
5. When consumers are ignorant of the market conditions
When consumers are ignorant of the price, quality, packing and labelling of the commodity and other market conditions, demand curve may be abnormal. An increase in price of a commodity may be taken to mean increase in quality, making the consumer to buy more of it. A consumer who is not aware of the existence of substitute goods may be forced to purchase a good at a high price irrespective of the existence of a substitute, which is cheap.
6. If the commodity is a necessity
The demand for such commodities is perfectly inelastic. An example of such goods is medicine. Its demand remains high despite the increase in its price. For instance, a patient shall be willing and ready to pay any price for the subscribed medicine as long as he or she has the ability to pay.
Check your pocket!
At times we are forced by situations or circumstances to buy things just for the sake. It is not a crime for you not to have some luxuries. Therefore, do not be influenced by your peers in purchasing the commodities. We are not equal financially.
5.2.11 Change in demand (shifts in the demand curve)
Change in demand. This refers to increase or decrease in the amount of a commodity demanded at a particular time at a constant price. The price of the commodity does not change, but because of changes in the other factors that influence demand, the quantity demanded either increases or reduces. In a change in demand, the price of the commodity remains constant, the demand curve shifts either to the right (indicating an increase in demand) or to the left (indicating a decrease in demand), quantity demanded changes.
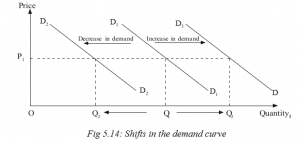
At price OP1, quantity demanded is OQ1. The price remains constant, but quantity demanded either decreases to to OQ2 and the demand curve also shifts to D2 , or it increases to OQ3 and the demand curve shifts to D3.
A change in demand may be an increase in demand. In such a case the demand curve shifts to the right. It may also be a decrease in demand where the demand curve shifts to the left.
5.2.11.1 Increase in demand
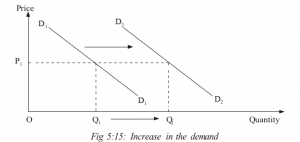
At price P1, quantity demanded is Q1. This price remains constant at P1 even when quantity demanded increases to Q2. This is an increase in demand. It may be due to increase in the size of the population, increase in consumers’ income, government subsidising consumers, reduction in both direct and indirect taxes, reduction in the price of a complementary good, increase in the price of a substitute good, favourable changes in the buyers’ tastes and preferences, or a favourable change in seasons.
5.2.11.2 Decrease in demand
Activity 5.24
The price of Jeans trousers remained constant in the market but the quantity demanded reduced by a half. Using figures generated by your group, illustrate this on a curve and determine the factors responsible.
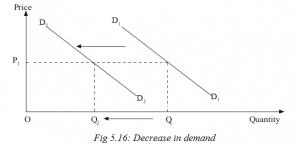
At price OP1, Quantity OQ1 is demanded. The price remains constant even when quantity demanded reduces to OQ2.
5.2.12 Change in quantity demanded
Activity 5.25
The price of commodity X increased from OP1 to OP2. As a result, there was a decrease in its quantity demanded from OQ1 to OQ2. Illustrate this on a curve.
Change in quantity demanded refers to an increase or a decrease in quantity demanded of a commodity as a result of changes in its price. Change in quantity demanded leads to change in prices as well. These changes result into a change in the demand curve. Movement along the same demand curve either downwards to the right, indicates an increase in price. Movement along the same demand curve either upwards or to the left, shows a decrease in the price of the commodity.
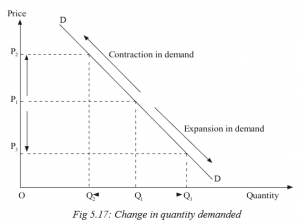
A change in price from OP1 to OP2 leads to a reduction in quantity demanded from OQ1 to OQ2. The reverse is also true.
Similarly, a change in price from OP1 to OP3 leads to an increase in the quantity demanded from OQ1 to OQ3.
All these show movement along the demand curve.
Contraction in demand is as a result of decrease in quantity demanded due to increase in price.
Expansion in demand is as a result of increase in quantity demanded due to decrease in price.
In summary we can say that:
- Movement along the demand curve is ONLY affected by change in price of the commodity.
- Shift in the demand curve is caused by all factors affecting demand EXCEPT price.
TYPES OF DEMAND
Independent demand.
Complementary demand.
Competitive demand.
Composite demand. Derived demand.
Unit Assessment 5
- Define the following terms as used in Economics.
- Demand
- Quantity demanded
- Effective demand
- Market demand
- (i) What do you understand by the term price?
- Explain the different methods of price determination in a market.
- Distinguish between capital market and commodity market.
- (i) State the law of demand.
- Explain the factors that influence the level of demand for a commodity in a market.
- The price of commodity Z reduced from 26,000 FRW to 15,000 FRW. This resulted into an increase in its quantity demanded from 60kgs to 134 kgs. Illustrate this information on a demand curve. What appropriate term can you use to refer to the above case?
- (i) Distinguish between giffen goods and goods of ostentation.
| Price of commodity Z (FRW) | Quantity demanded. (Kgs) |
| 1000 | 5 |
| 2500 | 10 |
| 4000 | 20 |
| 5700 | 15 |
| 7000 | 12 |
| 10000 | 6 |
Use the figures in the table above to illustrate a demand curve. For which kind of goods does your curve represent?