
INTRODUCTION
A firm should be managed effectively and efficiently. This implies that the firm should be able to achieve its objectives by minimizing the use of resources. Thus managing implies coordination and control of the efforts of the firm for achieving the organizational objectives. The process of managing is facilitated when management charts its future course of action in advance, and takes decisions in a professional manner, utilizing the individual and group efforts in a coordinated and rational manner. One systematic approach for attaining effective management performance is financial planning and budgeting. Financial planning indicates a firm’s growth, performance, investments and requirements of funds during a given period of time, usually three to five years. It involves the preparation of projected or pro forma profit and loss account, balance sheet and funds flow statement. Financial planning and profit planning help a firm’s financial manager to regulate flows of funds which is his primary concern.
FINANCIAL PLANNING
Growth in sales is an important objective of most firms. An increase in a firm’s market share will lead to higher growth. The firm would need assets to sustain the higher growth in sales. It may have to invest in additional plant and machinery to increase its production capacity. Also, it would need additional current assets to produce and sell more goods or services. The firm would have to acquire raw materials and convert them into finished goods after incurring manufacturing expenses. It may have to sell goods on credit because of the industry norms or to push up sales. This gives rise to debtors or accounts receivables. The suppliers of raw materials may extend credit to the firm. The firm may use its internally generated funds to finance current and fixed assets. When the firm grows at a high rate, internal funds may not be sufficient. Thus the firm would have to raise external funds either by issuing equity or debt or both. Financial planning is the process of analysing a firm’s investment options and estimating the funds requirement and deciding the sources of funds.
In summary, the financing planning process involves the following facets:
- Evaluating the current financial condition of the firm
- Analysing the future growth prospects and options
- Appraising the investment options to achieve the stated growth objective
- Projecting the future growth and profitability
- Estimating funds requirement and considering alternative financing options
- Comparing and choosing from alternative growth plans and financing options
- Measuring actual performance with the planned performance
Financial Forecasting and Modelling
Financial forecasting is an integral part of financial planning. It uses past data to estimate the future financial requirements. A financial planning model establishes the relationship between financial variables and targets, and facilitates the financial forecasting and planning process. A model makes it easy for the financial managers to prepare financial forecasts. It makes financial forecasting automatic and saves the financial managers’ time and efforts performing a tedious activity. Financial planning models help in examining the consequences of alternative financial strategies.
A financial planning model has the following three components:
- Inputs The model builder starts with the firm’s current financial statements and the future growth prospects. The firm’s growth prospects depend on the market growth rate, firm’s market share and intensity of competition. The growth objective is determined by the management team consisting of marketing, manufacturing and finance executives.
- Model The model defines the relations between financial variables and develops appropriate equations. For example, net working capital and fixed assets investment may be related to sales. As sales change, they may change in direct proportion to sales. Hence the model will specify working capital and fixed assets as ratio of sales. Similarly, given the payout policy of the firm, dividend may be specified as a ratio of profit after tax.
- Output Applying the model equations to the inputs, output in the form of projected or pro forma financial statements are obtained. The output shows the investment and funds requirement, given the sales growth objective and relationships between the financial variables.
Long-term Financial Plan
Large companies generally prepare financial plan for a long period, say, five years. Small companies may choose a shorter period, say, one year. The financial plan of large companies may be highly detailed document containing financial plans for different strategic business units (SBUs) and divisions. In practice, long-term financial forecasts are prepared by relating the items of profit and loss account and balance sheet to sales. This is called the percentage to sales method. We shall consider case of Bharat Machinery Limited to illustrate the technique of long-term financial forecasting.
Bharat Machinery Limited (BML) is a large machine tools and machinery manufacturing company. The company has been growing at a high rate. Because of the long production cycles of a number of its products, it carries large inventory. BML has its customers both in the public and private sectors. It faces a problem of realizing its credit sales on time from the public sector customers. In the past, the company has generally resorted to borrowings to meet its funds requirements. Tables 21.1 and 21.2 contain BML’s profit and loss statements and balance sheets for the years 2010 to 2014.
Table 21.1: Bharat Machinery Limited
P&L Statement for the year ending 31 March
(` crore)
| 2010 | 2011 | 2012 | 2013 | 2014 | |
| Net sales | 139.0 | 152.0 | 183.0 | 206.2 | 238.3 |
| Cost of goods sold
Gross profit |
81.2 | 87.7 | 104.5 | 123.7 | 138.7 |
| 57.8 | 64.3 | 78.5 | 82.7 | 99.6 | |
| Administrative expenses | 10.3 | 11.6 | 12.9 | 16.8 | 19.3 |
| Selling expenses | 20.1 | 21.1 | 23.2 | 25.0 | 27.1 |
| Other expenses | 11.6 | 12.9 | 13.4 | 15.5 | 19.1 |
| Non-manufacturing expenses
PBIT |
42.0 | 45.6 | 49.5 | 57.3 | 65.5 |
| 15.8 | 18.7 | 28.8 | 25.4 | ||
| 34.1 Interest | 9.8 | 11.1 | 16.0 | 17.8 | 18.6 |
| PBT | 6.0 | 7.6 | 12.8 | 7.6 | 15.5 |
| Tax
PAT |
2.8 | 3.6 | 6.2 | 3.9 | 8.2 |
| 3.2 | 4.0 | 6.6 | 3.7 | 7.3 | |
| Dividends Retained earnings |
1.5 | 1.5 | 3.0 | 3.0 | 3.0 |
| 1.7 | 2.5 | 3.3 | 0.7 | 4.3 |
Table 21.2: Bharat Machinery Limited
Balance Sheets as on year ended 31 March
(` crore)
| 2010 | 2011 | 2012 | 2013 | 2014 | |
| SOURCES OF FUNDS
Net Worth Share capital |
40.0 | 40.0 | 40.0 | 40.0 | 40.0 |
| Reserves
Net worth |
12.1 | 14.6 | 17.9 | 18.6 | 22.9 |
| 52.1 | 54.6 | 57.9 | 58.6 | 62.9 | |
| Borrowings
Capital employed USES OF FUNDS Net Fixed Assets Gross block |
67.0 | 71.8 | 96.0 | 110.8 | 114.8 |
| 119.1 | 126.4 | 153.9 | 169.4 | 177.7 | |
| 86.1 | 92.3 | 99.3 | 115.8 | 141.5 | |
| Less: Accumulated dep.
Net block |
30.2 | 34.3 | 38.7 | 45.9 | 54.1 |
| 55.9 | 58.0 | 60.6 | 69.9 | 87.4 | |
| Capital works-in-progress
Net fixed assets Current Assets Inventory |
3.4 | 4.6 | 10.3 | 17.3 | 7.0 |
| 59.3 | 62.6 | 70.9 | 87.2 | 94.4 | |
| 97.4 | 110.3 | 122.5 | 119.4 | 122.7 | |
| Debtors | 47.4 | 67.8 | 108.3 | 126.3 | 127.9 |
| Cash and bank | 5.4 | 2.8 | 3.9 | 6.4 | 11.6 |
| Others | 17.0 | 14.4 | 17.0 | 22.2 | 23.5 |
| Current assets | 167.2 | 195.3 | 251.7 | 274.3 | 285.7 |
| Less: Current liabilities Net Current Assets Net Assets |
107.4 | 133.5 | 168.7 | 192.1 | 202.4 |
| 59.8 | 61.8 | 83.0 | 82.2 | 83.3 | |
| 119.1 | 124.4 | 153.9 | 169.4 | 177.7 |
How has BML financed its operations in the past? How has it performed? If BML grows as in the past, what would be its funds requirements?
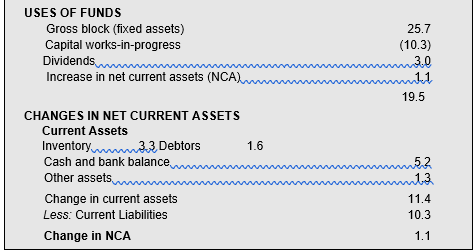
We can prepare funds flow statement for the company to see how it financed its activities in the year ending on 31 March 2014 (Table 21.3).
We can calculate BML’s financial ratios to analyse its past performance. Table 21.4 shows the relationships of a number of profit and loss account and balance sheet items to sales and also provides an analysis of BML’s profitability during the years 2010 to 2014.
Table 21.3: Bharat Machinery Limited
Funds Flow Statement for year ending on 31-3-2014
| (` crore) | |
| SOURCES OF FUNDS
Profit after-tax |
7.3 |
| Depreciation | 8.2 |
| Funds from operations | 15.5 |
| Borrowings | 4.0
19.5 |
(Contd…)
(Contd…)
BML’s sales have been growing at about 15 per cent. The company improved its assets utilization from 1.17 times to 1.34 times in 2014. Its profit margin (PBIT/NS) ranged between 11.4 per cent and 15.7 per cent. The company’s net margin (PAT/NS) showed more fluctuation because of a high proportion of interest. BML earned an average net margin of 2.7 per cent during 2010 to 2014. On an average, the company distributed a little more than fifty per cent of its profits as dividend to the shareholders. BML’s net worth did not increase rapidly because of low margin and high payout. As
Table 21.4: Bharat Machinery Limited: Financial Ratios
| 2010 | 2011 | 2012 | 2013 | 2014 | Average | |
| PERCENTAGE OF SALES
Profit and Loss Items Cost of goods sold |
58.4 | 57.7 | 57.2 | 60.0 | 58.2 | 58.3 |
| Administrative expenses | 7.4 | 7.6 | 7.0 | 8.1 | 8.1 | 7.7 |
| Selling expenses | 14.5 | 13.9 | 12.7 | 12.1 | 11.4 | 12.9 |
| Other expenses | 8.3 | 8.5 | 7.3 | 7.5 | 8.0 | 7.9 |
| Interest | 7.1 | 7.3 | 8.7 | 8.6 | 7.8 | 7.9 |
| PAT | 2.3 | 2.6 | 3.6 | 1.8 | 3.1 | 2.7 |
| Balance Sheet Items Net fixed assets | 42.7 | 41.2 | 38.7 | 42.3 | 39.6 | 40.9 |
| Inventory | 70.1 | 72.6 | 66.9 | 57.9 | 51.5 | 63.8 |
| Debtors | 34.1 | 44.6 | 59.2 | 61.3 | 53.7 | 50.6 |
| Cash and bank balance | 3.9 | 1.8 | 2.1 | 3.1 | 4.9 | 3.2 |
| Other current assets | 12.2 | 9.5 | 9.3 | 10.8 | 9.9 | 10.3 |
| Current assets | 120.3 | 128.5 | 137.5 | 133.0 | 119.9 | 127.8 |
| Current liabilities | 77.3 | 87.8 | 92.2 | 93.2 | 84.9 | 87.1 |
| Net current assets | 43.0 | 40.7 | 45.4 | 39.9 | 35.0 | 70.8 |
| Net assets | 85.7 | 81.8 | 84.1 | 82.2 | 74.6 | 81.7 |
| PROFITABILITY ANALYSIS Assets turnover: NS/NA |
1.17 | 1.22 | 1.19 | 1.22 | 1.34 | 1.23 |
| Profit margin: PBIT/NS (%) | 11.4 | 12.3 | 15.7 | 12.3 | 14.3 | 13.2 |
| Return on investment: PBIT/NA (%) | 13.3 | 15.0 | 18.7 | 15.0 | 19.2 | 16.2 |
| Leverage factor: PAT/PBIT (%) | 20.3 | 21.4 | 22.9 | 14.6 | 21.4 | 20.1 |
| Debt ratio: NA/NW (i.e., 1+D/E) | 2.29 | 2.28 | 2.66 | 2.89 | 2.83 | 2.59 |
| Return on equity: PAT/NW (%) | 6.1 | 7.3 | 11.4 | 6.3 | 11.6 | 8.5 |
| Retention ratio: RE/PAT (%) | 53.1 | 62.5 | 54.5 | 18.9 | 58.9 | 49.6 |
| Growth in equity: RE/NW (%) | 3.3 | 4.6 | 6.2 | 1.2 | 6.8 | 4.4 |
| Growth in sales (%) | — | 9.4 | 20.4 | 12.7 | 15.6 | 14.5 |
a consequence, the company depended on borrowings to meet its requirement of funds, and debtequity ratio increased from 1.29 in 2010 to 1.83 in 2014. BML has high levels of inventory and debtors. It improved its utilization of current assets in the year 2013. Because of the better utilization of fixed assets and improvement in the turnover of current assets, net assets as a percentage of sales declined to about 75 per cent (from 86 per cent in 2010) in 2014. The company can improve its assets turnover and profitability by bringing down the collection period and inventory holding period.
Can we estimate BML’s future requirement of funds if we assume the past performance to continue? We may notice that net margin, except in 2013, showed a gradual improvement. The company’s performance improved in 2014 because it could affect cost control and better management of assets. Sales grew at 15.6 per cent in 2014, while the average growth rate has been 14.5 per cent. If the company is able to maintain its operating efficiency and financial policies, we can make the following assumptions:
- Sales growth 15 per cent
- Net profit margin 3 per cent
- Net assets to sales ratio 75 per cent (i.e., NFA to sales 40 per cent and NCA to sales 35 per cent)
- Tax rate 50 per cent
- Dividend 10 per cent of paid-up capital.
Table 21.5 provides financial forecasts for BML during the next five years on the basis of assumptions made above. Taking the 2014 sales of `238.3 crore as the basis, sales for 2015 is calculated as: `238.3 × 1.15 = `274 crore. Similar calculations have been made for other years. It may be noted that projected sales have been used for estimating items of profit and loss account and balance sheet.
The funds flow statement in Table 21.5 shows the differences in the balance sheet items. For simplicity, adjustment of depreciation is not made. We may note that as BML’s sales increase, its requirement for funds increases. Total funds required for financing net fixed assets and net current assets during 2015 to 2019 are: `181.8 crore. Given BML’s policy of paying 10 per cent dividend (`4 crore each year), retained earnings provide `35.5 crore. The company will have to raise the balance amount, `146.3 crore, either by issuing equity or debt. If BML does not want to finance its assets by issue of equity, it will have to borrow funds. BML’s forecasted ROE and debt–equity ratio will be as follows:
| 2015 | 2016 | 2017 | 2018 | 2019 | ||
| ROE % | 12.2 | 13.1 | 13.7 | 14.1 | 14.6 | |
| D/E ratio | 2.06 | 2.26 | 2.42 | 2.55 | 2.65 |
Table 21.5: Bharat Machinery Limited
Financial Forecasts
(` crore)
| 2015 | 2016 | 2017 | 2018 | 2019 | ||
| PROFIT AND LOSS ACCOUNT
Net sales |
274.0 | 315.2 | 362.4 | 416.8 | 479.3 | |
| Cost of goods sold
Gross profit |
159.5 | 183.4 | 210.9 | 242.6 | 279.0 | |
| 114.5 | 131.8 | 151.5 | 174.2 | 200.3 | ||
| Non-manufacturing exps. | 75.1 | 86.4 | 49.3 | 114.2 | 131.3 | |
(Contd…)
(Contd…)
| PBIT | 39.4 | 45.4 | 52.2 | 60.0 | 69.0 |
| Interest
PBT |
23.0 | 26.4 | 30.4 | 35.1 | 40.1 |
| 16.4 | 19.0 | 21.8 | 24.9 | 28.9 | |
| Tax
PAT Dividend |
8.2 | 9.5 | 10.9 | 12.4 | 14.5 |
| 8.2 | 9.5 | 10.9 | 12.5 | 14.4 | |
| 4.0 | 4.0 | 4.0 | 4.0 | 4.0 | |
| Retained earnings | 4.2 | 5.5 | 6.9 | 8.5 | 10.4 |
| BALANCE SHEET
Share capital |
40.0 | 40.0 | 40.0 | 40.0 | 40.0 |
| Reserves
Net worth |
27.1 | 32.6 | 39.5 | 48.0 | 58.4 |
| 67.1 | 72.6 | 79.5 | 88.0 | 98.4 | |
| Borrowings
Capital employed Net fixed assets |
138.4 | 163.8 | 192.3 | 224.7 | 261.1 |
| 205.5 | 236.4 | 271.8 | 312.7 | 359.5 | |
| 109.6 | 126.1 | 145.0 | 166.7 | 191.7 | |
| Net current assets Net assets FUNDS FLOW STATEMENT Retained earnings |
95.9 | 110.3 | 126.8 | 146.0 | 167.8 |
| 205.5 | 236.4 | 271.8 | 312.7 | 359.5 | |
| 4.2 | 5.5 | 6.9 | 8.5 | 10.4 | |
| Funds needed
Sources Net fixed assets |
23.6 | 25.4 | 28.5 | 32.4 | 36.4 |
| 27.8 | 30.9 | 35.4 | 40.9 | 46.8 | |
| 15.2 | 16.5 | 18.9 | 21.7 | 25.0 | |
| Net current assets
Uses |
12.6 | 14.4 | 16.5 | 19.2 | 21.8 |
| 27.8 | 30.9 | 35.4 | 40.9 | 46.8 |
Sensitivity Analysis
What will happen to BML’s financial plan if all or some of the assumptions do not hold? It is assumed that sales will grow at 15 per cent per annum. Historically, the company has grown in some years at a rate less than 15 per cent. Can BML maintain its profit margin at 3 per cent? The 5-year average is 2.7 per cent. The margin has been as low as 1.8 per cent in 2013. One could also doubt the assumption of asset ratio of 75 per cent. Except in the most recent year (2014), net assets to sales ratio has varied from 82 per cent to 87 per cent. If BML cannot improve its profitability and assets utilization, should it continue paying dividend? If it cuts or discontinues payment of dividend, what will be the reaction of shareholders?
The financial manager of BML can answer these and similar questions, if he/she performs a sensitivity analysis to examine the effect of changing assumptions on the firm’s funds requirement. He/she can vary one variable at a time, and see its effect. For example, the effect of the following possibilities may be analyzed: (a) sales growth 12 per cent, (b) profit margin 2.5 per cent and (c) net assets to sales ratio 82 per cent (net fixed assets to sales 41 per cent and net current assets to sales 41 per cent.) The financial manager can as well think of possible scenarios where the effect of combinations of variables may be analysed. For example, two possible scenarios could be (i) sale growth 15%, profit margin 2.5 per cent and assets ratio 82 per cent, and (ii) sales growth 12 per cent, profit margin 2.5 per cent and assets ratio 82 per cent. Table 21.6 shows the results of changes in individual variables and possible scenarios.
Table 21.6: Bharat Machinery Limited
Financial Forecasts: Sensitivity Analysis
(` crore)
| Scenarios | |||||
| Growth 15% | Growth 15% | ||||
| Asset | Margin 2.5% | Margin 2.5% | |||
| Growth | Margin | ratio | Asset ratio | Asset ratio | |
| 12% | 2.5% | 82% | 82% | 82% | |
| NFA | 73.6 | 97.3 | 102.1 | 102.1 | 77.8 |
| NCA | 63.7 | 84.5 | 113.2 | 113.2 | 88.9 |
| Total | 137.3 | 181.8 | 215.3 | 215.3 | 166.7 |
| RE | 36.9 | 26.2 | 35.4 | 26.2 | 22.4 |
| Funds needed
Total |
106.4 | 155.6 | 179.9 | 189.1 | 144.3 |
| 143.3 | 181.8 | 215.3 | 215.3 | 166.7 | |
It may be observed from Table 21.6 that BML’s funds requirement is quite sensitive to sales growth and assets utilization. The burden of raising external funds is maximum when the company grows at 15 per cent, margin is 2.5% and asset ratio is 82%. If BML is not in a position to raise large amounts of external funds, it may have to slow down its growth and considerably improve the efficiency of assets utilization. The company may also have to reconsider its decision of paying 10 per cent dividend. Financial planning starts where financial forecasting ends. Forecasting provides a basis for planning; it is not planning.
Steps in Financial Planning
We emphasize again that financial forecasting is the basis for financial planning. Forecasts are merely estimates based on the past data. Historical performance may not occur in the future. Planning means what a company would like to happen in the future, and includes necessary action plans for realizing the predetermined intensions. After analysing the historical performance of BML, the management can ask the following questions: (1) Should BML remain satisfied with a 3 per cent profit margin? (2) How can it reduce its costs? (3) How can the company reduce its inventory holding and collect period? (4) What are the steps necessary to improve the efficiency in the use of fixed assets? (5) How much dividend should BML pay? (6) How much should it borrow? (7) What is the prudent debt–equity mix for the company? (8) Should it raise funds by using equity capital? (9) If funds are not available, should the company slow down its growth? (10) What would be the implications of the slowing down of growth? Financial planning helps to answer these and many other questions.
The following steps are involved in financial planning:
- Past performance Analysis of the firm’s past performance to ascertain the relationships between financial variables and the firm’s financial strengths and weaknesses.
- Operating characteristics Analysis of the firm’s operating characteristics—product, market, competition, production and marketing policies, control systems, operating risk, etc.—to decide about its growth objective.
- Corporate strategy and investment needs Determining the firm’s investment needs and choices, given its growth objective and overall strategy.
- Cash flow from operations Forecasting the firm’s revenues and expenses and need for funds based on its investment and dividend policies.
- Financing alternatives Analysing financial alternatives within its financial policy and deciding the appropriate means of raising funds.
- Consequences of financial plans Analysing the consequences of its financial plans for the long-term health and survival to firm.
- Consistency Evaluating the consistency of financial policies with each other and with the corporate strategy.
Financial planning involves the questions of a firm’s long-term growth and profitability, and investment and financing decisions. It focuses on aggregative capital expenditure programmes and debt–equity mix rather than the individual projects and sources of finance. Financial planning also involves an interface between the corporate policy and financial planning and the trade-off between financial policy variables.
Check Your Concepts
- What is meant by long-term financial plan? What purpose does it serve?
- What are the methods of developing a long-term financial plan?
- What is the role of sensitivity analysis in financial planning?
- State the steps involved in financial planning.
PLANNING FOR SUSTAINABLE GROWTH
Strategic financial planning stresses a balanced relationship between financial goals. It asks the question: What growth rate is sustainable given a company’s established financial policies? Financial planning model involves considerations of growth, investment and financing. A simple way of ascertaining the growth potential of a company, given its current financial conditions, is to examine the interaction between four financial policy goals expressed as ratios:
- target sales growth
- target return on investment (net assets)
- target dividend payout and
- target debt–equity (capital structure)
Thus, there are demand-related financial goals—driven by the company’s strategic goal of sales growth (requiring funds for investment in fixed and current assets) and supply-related financial goals—driven by the company’s desire to earn superior return, pay dividends to shareholders and enhance funds by incurring debt supported by its internal funds.1
Growth Potential of a Single-product Company
A simple way of ascertaining the growth potential of a company is to model the interaction between four financial goals expressed as ratios—two operating ratios: net assets to sales (NA/S) and net margin, i.e., net profit to sales (PAT/S) and two financial policy ratios: retention ratio, i.e., retained profits/PAT and leverage or debt–equity ratio, i.e., D/E. Sustainable growth may be defined as the annual percentage growth in sales that is consistent with the firm’s financial policies (assuming no issue of fresh equity).2 The following model can be used to determine the sustainable growth (gs) in sales:
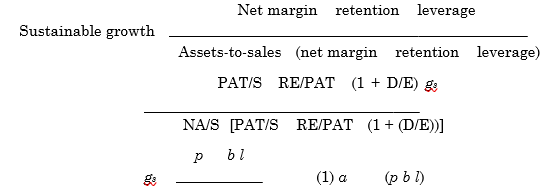
where p = net margin = PAT/sales, b = retention ratio = retained earnings (RE)/net profit (PAT) or one minus payout ratio, i.e., (1– payout), l = leverage = net assets (or capital employed) to equity (net worth) = (1 + D/E), and a = asset–sales ratio = net assets sales.
The net assets to sales ratio determines the requirement of funds for investing in assets to support a given level of sales. The requirement for funds would increase with expanding sales. The net profit minus the dividends is an internal source of funds. Thus, the product of net profit to sales ratio and retained profit to net profit (net margin × retention ratio) gives an idea of the funds available internally to support the growth of the firm. Retained earnings increase the debt-raising capacity of the firm. Thus, given the target capital structure, the total funds would be equal to retained earnings plus debt supported by the retained earnings [viz., pb (1 + l)]. Net assets or capital employed (viz., debt plus equity) to equity is a leverage measure, and is equal to one plus debt–equity ratio.
| ILLUSTRATION 21.1: Sustainable Growth Calculations | ||||||||||||||||||||||||||||
| Consider the financial data of East & West Hotel for the current year given in Table 21.7 to understand the concept of substantial growth as shown in Equation (1).
Table 21.7: East & West Hotel’s Financial Data
|
| Consider the financial data of East & West Hotel for the current year given in Table 21.7 to understand the concept of substantial growth as shown in Equation (1). Table 21.7: East & West Hotel’s Financial Data
|
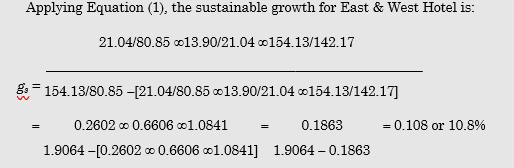
Thus, if East & West maintains its operating efficiency (viz., net profit margin, 26.0%) at the current year level and given its retention policy (retention ratio, 66.1%) and debt–equity policy (debt–equity ratio, 0.08 : 1), it can grow only at 10.8% without raising external equity.
East & West has achieved only 10.8 per cent growth rate in spite of a high net margin of 26.0 per cent, before-tax RONA of 18 per cent and ROE of 15 per cent because it has hardly used any debt; its D/E ratio is 0.08 : 1. Assume that East & West wants to grow at 15 per cent in the future but without changing its retention and debt–equity ratios. How much should be its profit margin to obtain a 15 per cent growth? It is calculated as follows:
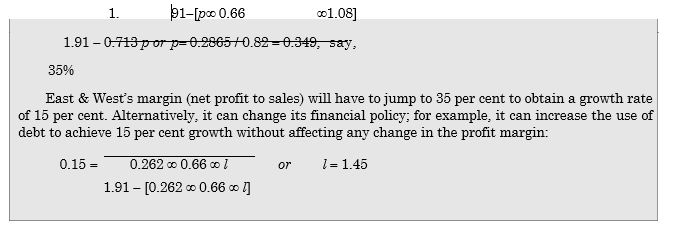
The debt–equity ratio will have to increase to 0.45 : 1. The company can think other possible tradeoffs between its financial goals to achieve its desired growth rate.
In the above analysis, we assume that the relation between assets and sales is constant, i.e., inflation does not exist. The sustainable growth model as given by Equation (1) can be modified to incorporate impact of inflation and other factors.3 It can be easily seen that the company can affect a change in the sustainable growth rate if it changes its retention policy or debt policy or both. A cost reduction strategy resulting into higher net profits would also lead to higher growth.
| Summary | |
| ÿ Financial planning of a company has close links with strategic planning. The company’s strategy establishes an effective and efficient match between its resources, opportunities and risks. It provides a mechanism of integrating goals of multiple stakeholders. Financial plan should be developed within the overall context of the strategic planning. ÿ Financial forecasting is an integral part of financial planning. Forecasting uses past data to estimate the future financial requirements. A simple approach to financial forecasting is to relate the items of profit and loss account and balance sheet to sales. Financial planning is more than forecasting. It is a process of identifying a f irm’s investments and f inancing needs, given its growth objectives. It involves trade‐off between various investment and financing options. A financial plan may be prepared for a period of three or five years. ÿ Financial modelling facilitates financial forecasting. It makes forecasting easy. A financial model has three components: input—current financial statement and growth forecasts; model—a system of equations based on the relations between financial variables; output—projected financial statements. ÿ Financial models of a large company can be very complicated when more details are considered. In practice, companies focus on the most crucial decisions and variables and keep the model simple. |
|
Review Questions
- What is a financing planning? How does it differ from financial forecasting?
- Explain the steps involved in preparing a financial plan. What are the merits of financial planning?
- Explain the concept of sustainable growth. How is sustainable growth of a single-product company calculated? How is the sustainable growth calculation different for a multi-product company?
Quiz Exercises
- A company’s return on equity is expected to be 20 per cent. The payout policy of the company is to distribute 40 per cent of profits. What is the expected growth of the company?
- A company has the following information: ROI 20 per cent; debt–equity ratio 2 : 1; tax rate 30 per cent and interest rate 12 per cent. Calculate the company’s ROE.
- A company has the following information: ROI 20 per cent; debt–equity ratio 2 : 1; payout ratio 60 per cent; tax rate 30 per cent and interest rate 12 per cent. What is the company’s sustainable growth rate?
- A company has the following information: ROI 18 per cent; debt–equity ratio 1 : 1; payout ratio 50 per cent; tax rate 50 per cent and interest rate 10 per cent. The company wants to maintain a growth of 10 per cent. Is this rate sustainable?
- A company has a debt ratio of 40 per cent. Its payout ratio is 50 per cent. Management wants a growth rate of 20 per cent per annum in the future. Is this rate sustainable? After-tax interest rate is 5 per cent.