Individual supply refers to the quantity of a given commodity that a producer is willing and able to sell at a given price over a specific time period.
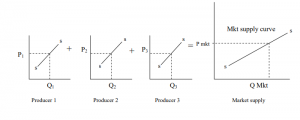
Market supply refers to horizontal summation of individuals producers/firms supply in the market. The supply schedule and the supply curve demonstrate the relationship between market prices and quantities that suppliers are willing to offer for sale. Supply differs from “existing stock” or the amount available because it is concerned with amounts actually brought to the market. The basic law of supply states that, “a greater quantity will be supplied at a higher price than at a lower price”. An individual producer’s supply
schedule shows alternative quantities of a given commodity that a producer is willing and able to sell various alternative prices for that commodity ceteris paribus (other things remaining constant).
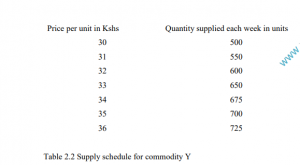
This can be represented by the use of a graph referred to as a supply curve as shown in
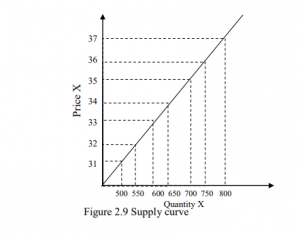
A supply curve show the relationship between the price of the commodity and the quantity supplied. The relationship is a direct one as the supply curve slopes upwards from left to right. The direct relationship is a graphical representation of the law of supply which states that other things remaining constant a greater quantity will be supplied at higher prices and vice versa.
Determinants of Supply
The supply of a good is influenced by the following factors
- price of the commodity in the market
- the price of other related goods
- cost of production
- state of technology
- objective of the firm
- future expectations of price changes
- climate
- government policy and taxes
Price of the good as the price of a given commodity say X rises, with the costs and the prices of all other goods remaining unchanged, the production of commodity X becomes more profitable. The existing firms are therefore likely to expand their profit and new
firms are to be attracted into the industry. It should be noted however, that not just the current rise but also expectations concerning the future increases prices may motivate producers. The total supply of goods is expected to increase as the prices rise.
Prices of other related goods changes in the prices of other commodities may affect the supply of a commodity whose price does not change. Substitutes; two goods X and Y are said to be substitutes in production if the supply of good X is inversely/negatively related to the price of Y. For instance barley and wheat or tea and coffee. If a firm producing both tea and coffee notices that the price of tea is
rising may decide to allocate more resources to tea at the expense of coffee. The supply of coffee will therefore fall as the price of tea increases. However, the movement of resource from one use to the other is dependent on the mobility of factors of production.
Complimentary goods; two goods X and Y are said to be compliments if an increase in the price of X causes an increase in the supply of Y such as a vehicle and petrol. Jointly supplied goods; two goods X and Y are said to be jointly supplied if an increase in the price of X causes an increase in the price of Y such as petrol and paraffin. If the demand for petrol increases the supply of petrol will rise and at the same time the supply of paraffin will increase.
N/B The extent to which firms can move from one industry to another in search of higher profits depends on occupational and geographical mobility of the factors of production.
Prices of factors of production as the prices of factors of production used intensively by producers of a certain commodity rise, so do the firm costs. This will cause the supply to fall since some firms will eventually leave the industry. Similarly, if the price of one
factor of production, say land, increases, some firms may move out of the production of land intensive products into the production of goods that are intensive in other factors of production which are relatively cheaper. Finally other less efficient firms will make
losses and eventually leave the market.
The state of technology is a society‟s pool of knowledge concerning industrial activities and its improvements. Technological improvements or progress such as improvements in machine performance, management and organization or an improvement in quality of raw materials leads to lower costs through increased productivity and increases the profit margin in every unit sold. This leads to increase in supply. Future expectations of price change Supply of a good is not only influenced by the current prices but future expected price as well. For example, if the price of a good is expected to rise the firm may decide to reduce the amount of supply in the current period. This is to enable them pile stock which they can offer for sale when prices increase in the future. This is known as hoarding.
Government policies through tax imposition on goods increases the cost of production hence decline in production and supply
Through subsidies -a grant to citizens of a country which lowers the cost of production hence encourages production and increases in supply. Through price control can either by price minimization where prices are fixed above equilibrium encouraging producers to produce more hence increase in supply. It may be undertaken through price maximization where prices are fixed below equilibrium
discouraging production hence decline in supply. Though quotas where the government puts restriction or limit production of various
goods which leads to decline in supply.
Weather /climate the supply of agricultural products is considerably affected by changes in weather conditions. Output in agriculture is subject to variations in weather from year to the next. An excellent growing season associated with favorable weather conditions
will result in a bumper harvest leading to an increase in supply. An unfavorable season that results in a poor harvest may be viewed as an increase in the average costs of production because a given expenditure on inputs yields a lower input than it would in a
good/ favorable season. A bad harvest is represented by a leftward shift of the supply curve.
Objectives of the firm a business may pursue several objectives such as sales maximization, market leadership, quality leadership, survival, profit maximization, social responsibility. Firms with sales maximization as an objective aim at supplying greater
quantities of its product than a firm aiming at profit maximization where the later supplies less quantities but at a higher price in order to maximize the profit. Incidence of strikes lead to a reduction in supply of a product. The supply of manufactured goods is particularly likely to be affected by industrial disputes because of generally stronger unions in the industrial sector.
Market supply
The market supply curve represents the alternative amount of a good supplied per period of time at various alternative prices by all the producers of goods in the market. The market supply of goods therefore will be influenced by all the factors that determine individual producer supply and all the number of producers of goods in the market. This concept is illustrated in Figure 2.10 It therefore follows that the market supply curve will have a gently slope than individual supply curves. Figure 2.10 Derivation of market supply curve
Movement Along and Shift in Supply Curve
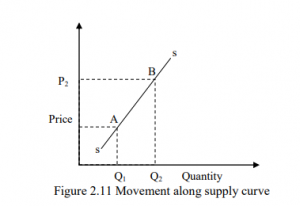
The relationship between price of a commodity and quantity supplied give rise to a supply curve. Any changes in the price of a good causes change in the quantity supplied. This can be traced by the movement along supply curve as shown in Figure 2.11 The movement from point A to B is caused by changes in price from P1 to P2 which bring fourth the movement along the supply curve.
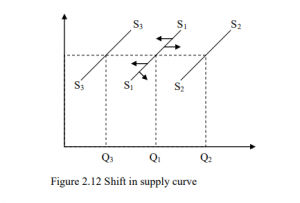
A shift of supply curve is caused by a change in any other factors affecting supply other than the price of the goods. This shift indicates changes in supply as a result of e.g. advances in technology which makes it cheaper to produce goods and services and therefore their supply will increase. Similarly incase of increase in cost of production will lead to a fall in quantity supplies as shown in Figure 2.12. A shift to the right from S1S1 to S3S3 shows a fall in supply.
