
Demand refers to the quantity of a commodity that consumers are willing and able to purchase at any given price over a given period of time. It is important to realize that demand is not the same thing as want, need or desire. Only when want is supported by
the ability and willingness to pay the price does it become an effective demand and have an influence on the market price. Hence demand in economics means effective demand. It is different from desire in that it has to be supported by the ability to purchase the
product/service.
The price of a commodity is most important factor/determinant of demand. All factors affecting demand other than the price are referred to as conditions for demand. While analyzing the relationship between price and quantity of demand economists assume that
all factors affecting demand remain constant. An individual demand for a given good can be presented in a form of a demand schedule. A demand schedule is a table showing quantity of a commodity that could be purchased at various prices. The Table 2.1 shows an individuals demand for commodity X.
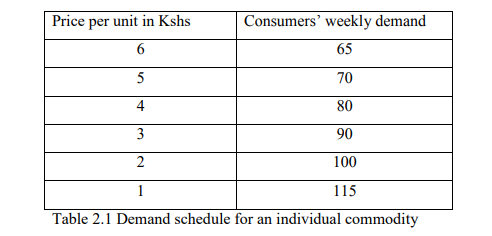
From the table, 65 units of commodity X will be demanded per week if the price is Kshs 6 per unit.
A demand schedule can be represented in the form of a graph known as a demand curve. Figure 2.1 shows the demand curve for commodity X. The curve shows graphically the relationship between quantity demanded and the price of the commodity. A demand
curve has a negative slope. It slopes downwards from left to right showing that as the price of a commodity falls demand increases. The inverse relationship between the price of a commodity and the quantity demanded is what is referred as the law of demand.
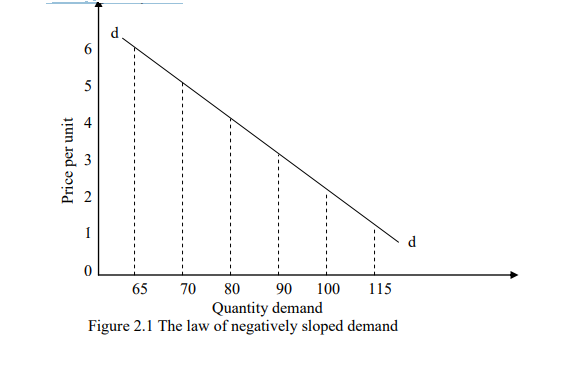
This law states that, “ceteris paribus (other things remaining constant), the lower the price of a commodity the greater the quantity demanded by the individual and vice versa”.
Exceptions to the Law of Demand
There are some demand curves that slopes upwards from left to right showing that as the prices of a product rise more is demanded and vice versa. This type of demand curve is known as regressive, exceptional or abnormal demand curve and occurs in the following
situations:
- When there is fear of a more drastic price changes in the future. This will causes consumers to increase there quantity demanded to avoid paying a higher price in the future. This situation is often found in the stock exchange where there is often an increase in the demand of shares of a company if its shares are expected to increase.
- In the case of giffen goods. This refers to basic foodstuffs that constitute a high proportion of the budget of low income families. When the price of a giffen good rises, the proportion of the total income of individuals who consumes these giffen goods rises and since such consumers are worse off in real terms, they can no longer afford to consume other more expensive commodities like meat and fruits. To make up for the goods they can no longer afford to buy, they are more likely to purchase more of basic
foodstuffs; conversely when the price of basic foodstuffs falls. They become better of in real terms and are likely to buy more or relatively more expensive foodstuffs and less basic foodstuffs.
Goods of ostentation (Veblen goods). These are commodities whose prices falls in the upper price ranges and that have a snob appeal. The wealthy are usually concerned about status. Believing that only goods at high prices are worth buying and worth the effect of
distinguishing them from other consumers. In the case of such commodities, a firm increasing its prices may find that the sales of its product increase and at lower prices less of the commodity may be bought as the commodity is rejected as being substandard.
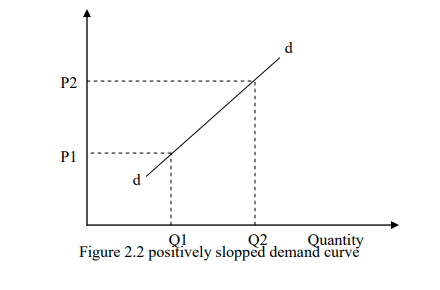
Consumers often in making comparisons between similar products with different prices opt for relatively more expensive product believing it to be better. As prices increase demand increases this is referred to as sonob effect. Examples of goods of ostentation are
expensive perfume, jewellery, cars clothes, etc. The demand curve will be positively slopping as indicated in Figure 2.2.
The Determinants of Demand
The demand of the product can be considered from the standpoint of either individual demand or market demand. Demand for any commodity can be considered from two points of view:
1.Individual demand is the amount the individual is willing and able to buy at a given price and over a given period of time. Factors affecting individual demand are;
- Price of the product
- Price of other related goods
- Consumer’s income
- Consumer’s tastes and preferences
- Future expectation in price changes
- Advertising
- Other factors such as subsidies, climate change etc.
The price of the product. When deciding whether or not to buy a particular product, an individual will compare the price of the product and the amount of utility or satisfaction expected to be received from the product. If the price is considered worth the anticipated utility the individual will buy the product and if not will not buy. A decrease in the price of a product will probably increase individual’s demand for it since the amount of utility obtained is likely to be worth the lower price.
Conversely a rise in the price of a product will probably result in a fall in demand, as the amount of utility received is less likely to
be worth the higher price to be paid. An example of this phenomenon is the hotel industry in Kenya. There is usually an increase in domestic tourism during the low season when many Kenyans consider the lower hotel prices to be worth the level of satisfaction they
are receiving. During the high season when the hotel prices are high, many do not consider the satisfaction they are receiving to be worth.
If the amount a consumer is willing and able to purchase due to change in the price, a change in the quantity demanded is said to take place. If on the other hand the amount the consumer is willing and able to purchase changes because of a change in the price of a
given commodity leads to a change in the quantity demanded will be undertaken later in utility analysis and indifference curve analysis.
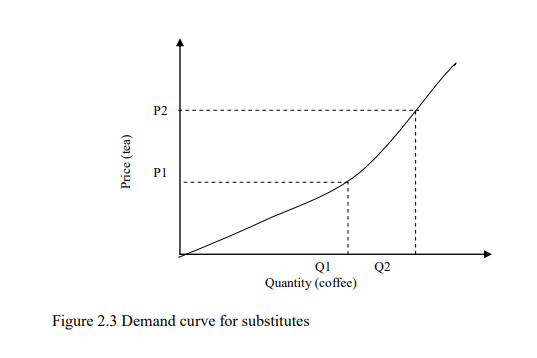
The prices of related goods. The demand for all goods is interrelated in that they are competing for consumer‟s limited income. Two peculiar interrelationships can be; Substitutes goods such as tea and coffee butter and margarine, beef and mutton, a bus
ride and a matatu ride, a mango and an orange, CDs and cassettes. Two goods, X and Y are said to be substitutes if a rise in the price of one commodity, say Y, leads to a rise in the demand of the other commodity X. If the price of tea increases consumers will find coffee relatively cheaper to tea as a result demand for coffee increases. Substitutes are commodities that can be used in place of other goods. This phenomenon is illustrated in Figure 2.3. The graph shows the relationship between the prices of tea over the quantity for coffee. If the price of tea increases from P1 to P2 the quantity of coffee demanded increases from Q1 to Q2.
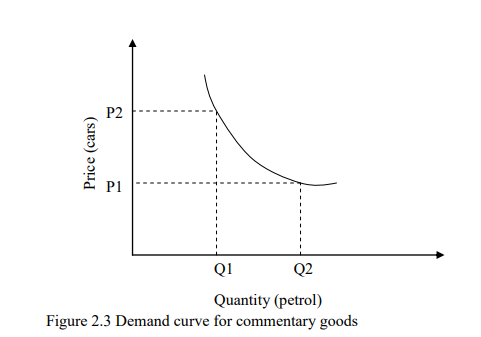
Compliments goods such as shoe and polish, pen and ink cars and petrol, computers and software, bread and margarine, hamburgers and chips, tapes and tape recorders. Demand for some commodities can also be affected by changes in the prices of the complementary.
if a rise in the price of one of the goods, say A leads to the fall in the demand of another food, say B. Complimentary goods are usually jointly demanded in the sense that the use of one requires or is enhanced by the use of the other. Figure 2.4 illustrates the
relationship between complementary goods graphically. For example if the price of cars is lowered demand for petrol increases because more cars will be bought/demanded. The curve shows the relationship between the price and of a car and quantity demanded for petrol. If the price of cars falls from P2 to P1 the quantity demanded for petrol increases from Q1 to Q2.
Changes in disposal real income. An individual’s level of income has an important effect on the level of demand for most products. If income increases demand for the better quality goods and services increases. This relationship however, depends on the type of
goods and level of consumers‟ income. The three types of are goods; Normal gods these are goods whose demand increases as income increases. The demand for normal goods increases continuously with increase in income. It tends to become gently as people reach the desired level of satisfaction.
Inferior goods refer to goods for consumers with low income levels such that as income increases its demand falls. At low level of income, these individuals will tend to consume large amount of these goods but as income increases they buy other goods which they
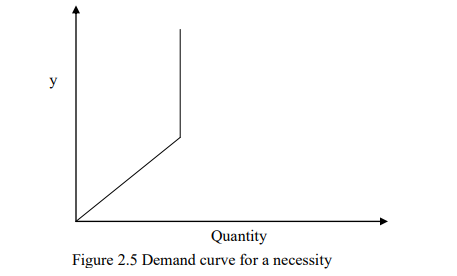
consider superior thus demanding less of the inferior goods. At very low level of income an inferior good behave like a normal good only to behave inferior as income increases. Necessities these are goods which consumers cannot do without such as salt, match boxes
among others. Their income demand curve tends to remain constant other than at the lowest levels of income as indicated in Figure 2.5
Changes in consumer tastes, preferences and fashion Personal tastes play an important role in governing the consumer’s demand for certain goods. For example, preferring to consume imported commodities despite them being extremely expensive. Prevailing fashions are an important determinant of tastes. The demand for clothing for example, particularly is susceptible to changes in fashion.
Level of advertising is also an important determinant of demand. In highly competitive markets, a successful advertising campaign will increase the demand of a particular product while at the same time decreasing the demand for competing products. Increase
in advertising will increase demand in the following ways;
- it helps inform about the product of a firm
- Can introduce new products to the market.
- Induce individuals to frequently use the product/service
Factors affecting advertising policies
- cost of advertising
- mode of advertising
- impact of advertising on the demand of the product
- The target group (old, young)
- number of competitors and quality of their products
- The market share of the firm and the degree of competition
- Future expectations in price changes
- Government policies and taxes
- Appropriate time to make advertisements
- Cultural background
- Language
The availability of credit consumers. This factor especially affects the demand for durable consumer goods which are often purchased on credit. For example a decrease in availability of credit or the introduction of more stringent credit terms is likely to lead to a reduction in the demand of some durable consumer goods. The government policy The government may influence the demand of a given commodity through legislation. For example making it mandatory for everyone to wear seatbelts. The consumers inevitably get to purchase more seatbelts as a result.
Subsidies it‟s the opposite of taxation. When the government grants subsidies prices of goods falls leading to increase in demand and vice versa. Climate change demand of various goods varies depending on weather. For instance there is high demand for woolen clothes during rainy reasons
2. Market factors affecting individual demand
It’s a horizontal demand sum of the demands for individual consumers. It refers to quantity demanded in the market at each price by individual consumers. For this reason all the factors affecting individual demand will affect market demand. The market demand for a commodity can be derived graphically as in Figure 2.6.
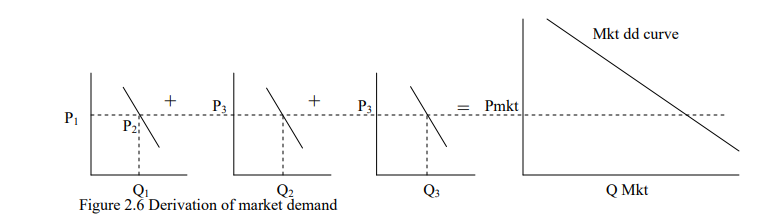
Where P1, P2 and P3 are individual prices Q1, Q2 and Q3 are individual quanties demanded. Pmk is the market price qmk is market quantity demanded.
Other factors affecting market demand
Change in population market demand is influenced by the size of the population, the composition of the population in terms of age sex as well as geographical distributions. Distribution of income more evenly distribution of income may increase demand for normal goods while at the same time it may lower the demand for luxuries.
Movement Along and Shift in Demand Curve
Demand is a multi- variant function in the sense that it is influenced by so many factors such as the price of the commodity, the price of other related commodities, consumer incomes etc. The price of the commodity is the most important determinant of demand
and its relationship with the quantity demanded give rise to a demand curve. Movement along demand curve is demonstrated by a change in the price of a good as shown in Figure 2.7 by movement from one point to another on the same demand curve.
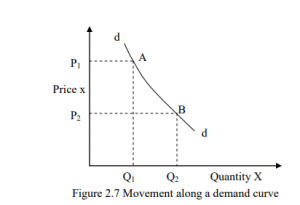
A change in price of a good from P1 to P2 causes a movement from point A to B along the demand curve. This movement along demand curve shows a change in quantity demanded which is an increase or a fall in the quantity demanded. A shift in the demand
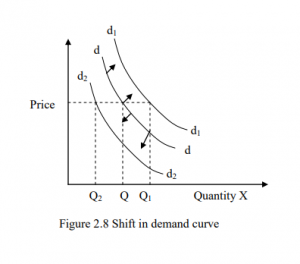
curve is caused as a result of a change in any factor affecting demand other than price such as changes in consumer income tastes and preferences.
For this reason all other factors affecting demand other than price of the product are also referred to as shifting factors as illustrated in Figure 2.8 Any change in the shifting factors will cause changes in demand (an increase or a fall in demand). A shift to the right (dd to d1d1) shows an increase in demand while a shift from (dd to d2d2) shows a decrease in demand.
Terms used in demand
- Joint demand it is the demand whereby two commodities are always demanded together. One good cannot be demanded in the absence of the other such as car and petrol.
- Competitive/rival goods it is the demand for goods which are substitutes such tea and coffee.
- Derived demand where goods are demanded in order to provide goods such as cotton is required to produce cotton wool
- Composite demand (several uses) where some goods are used for different purposes such as steel for cars machine etc