Equilibrium in economics refers to a situation in which the forces determine the behavior of variables are in balance and therefore exert no pressure on these variables to change.
In equilibrium the actions of all economic agents are mutually consistent. Market equilibrium occurs when the quantity of a commodity demanded in the market per unit equals the quantity of the commodity supplied to the market over the same period of
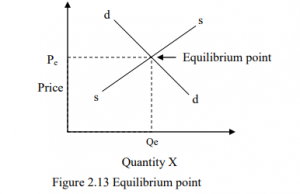
time. Geometrically, equilibrium occurs at the intersection point of the commodity’s market demand and market supply curve. The price and quantity at the equilibrium are known as the equilibrium price and equilibrium quantity respectively. The price Pe is also
referred to as market clearing point. At this equilibrium point the amount that producers are wiling and able to supply in the market is just equal to the amount that consumers are wiling and able to demand.
Both consumers and producers are satisfied and there is no pressure on prices to change and thus the market for goods is said to be at equilibrium. This is illustrated in Figure 2.13 Equilibrium point
Equilibrium can be defined as a state of rest or balance in which no economic forces are being generated to change the situation. These economic forces are excess demand and supply and are illustrated in Figure 2.14. At P1, the quantity demanded by consumers is
Q1 units but producers are willing to supply at price a quantity of Q2 units. Therefore there is an excess supply equal to (Q2 –Q1). Excess supply refers to a situation where quantity demanded is less than quantity supplied at prevailing market price. Producers
may therefore react to the excess supply by lowering prices of their products so as to sale the unsold stocks. Excess supply is referred to as a buyer‟s market since suppliers may be obliged to lower their prices in order to dispose of excess output a situation which is
favorable to buyers.
Excess supply represents an economic force that exerts downward pressure on prices. At P2 the quantity demanded is Q2 but producers are wiling to supply Q1 units of goods. Therefore, there will be excess demand equal to (Q2-Q1). This situation of excess demand is referred to as sellers market because competition among buyers will force up the price due to the existing shortage Excess supply is a situation where quantity demanded is greater than quantity supplied at prevailing market prices.
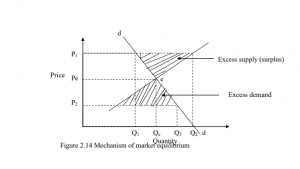
In this case, the price of goods will rise because of competition among buyers. Excess demand represents an economic force on prices which exerts upward pressure. Prices P1 and P2 are disequilibrium prices and market is said to be at disequilibrium. Therefore, the
general rule for equilibrium is that demand should equal supply represented by Qe and Pe.
Mathematics Derivation of Equilibrium
You are given two functions; the demand function and the supply function as follows:
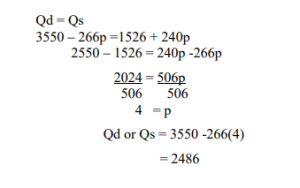
Demand function Qd = 3550 – 266p
Supply function Qs = 1526 + 240p
Required:
Determine the equilibrium market price and quantity.
Solution
Types of Equilibrium
The are three types of equilibrium; stable, unstable and neutral.
- Stable equilibrium If there is a force that distracts market equilibrium then there will adjustment that brings back the prices and quantity demand to the initial equilibrium. This is well explained in the previous section.
- Unstable equilibrium equilibrium is said to be equilibrium if there is divergence from the equilibrium set by forces which push the prices further away from the equilibrium prices. For example, in case of a giffen good which assumes a demand curve which is positive as indicated in Figure 2.15
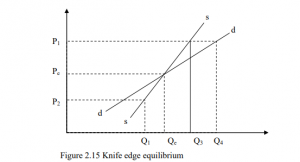
At P1 there is excess demand and this will exert an upward pressure on the prevailing market thus push it further away from the equilibrium. At p2 there is excess demand and this will exert an upward pressure on the prevailing market prices thus pushing it
further away from the equilibrium. This type of equilibrium is known as knife edge equilibrium. A small in price will send the system further away from the equilibrium.
3.Neutral equilibrium occurs when initial equilibrium is disturbed and forces of disturbances leads to a new equilibrium point. It may occur due to a shift of either demand or supply or through the effect of taxes.
The effect of a shift of demand and supply on market equilibrium.
Shift in demand
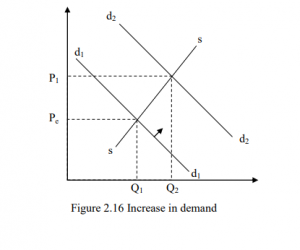
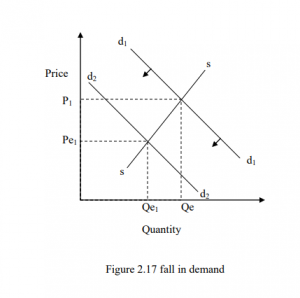
Increase in demand. Consider Figure 2.16 which illustrates the effect of an increase on demand on market equilibrium. An increase in demand is represented by a shift of the demand curve from d1d1 to d2d2. The immediate effect will be shortage and this will force prices to rise leading to increase in quantity supplied until equilibrium is reestablished at Pe. Fall in demand Consider Figure 2.17 which illustrates the effect of a fall in demand on the market equilibrium.
A fall in demand is represented by a shift of demand curve to the left from d1d1 to d2d2. The immediate effect will be a surplus and this will force the producers to lower the price in an attempt to get rid of excess stock. This fall in price will led to decline in quantity supplied until a new equilibrium is established at Pe1; Qe1
Shift in supply
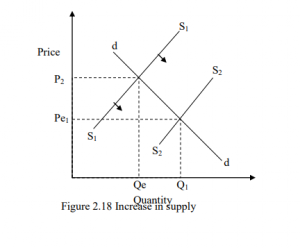
Increase in supply Consider Figure 2.18 which illustrates the effect of an increase of supply on the market equilibrium. An increase in supply is represented by a shift of supply curve to the right from S1S1 to S2S2. The immediate effect will be surplus and this will force the producer to lower their prices in order to get rid of excess stock. This fall will lead to an increase in quantity demanded until a new equilibrium is established at Pe
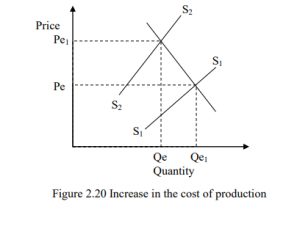
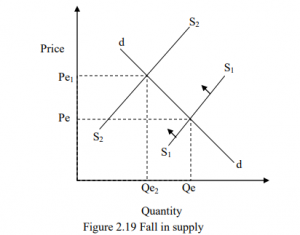
A fall in supply Consider the Figure 2.19 which illustrates the effect of a fall in supply on the market equilibrium. A fall in supply is represented by a shift of supply curve to the left from S1S1 to S2S2. The immediate effect will be shortage and thus will force
the prices to go up leading to a fall in quantity demanded until a new equilibrium is established at Pe1, Qe2.
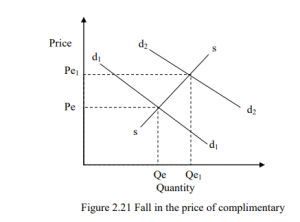
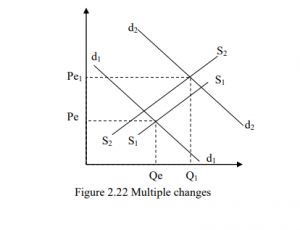
Multiple Changes Consider Figures 2.20 to 2.22 which shows a simultaneous increase in cost of production and a fall in the price of a complimentary good. An increase in cost of production will lead to a fall in supply. This is represented by a shift of supply curve to the left. A fall in the price of a complimentary good will lead to an increase in demand. This is represented by a shift of demand to the right.