
GENERAL
Accounting ratios provide a useful basis on which to review a company’s performance from its accounts. The essence of the approach is to measure company performance by a criterion, which takes account of the profit generated by the company, and the resources utilised to generate that profit. This criterion is called return on capital which is referred to as the primary ratio. In essence, it is the return, which the shareholders earn for every RWF1 invested by them in the company for the time being. The ratio is compared from one period to the next. In order to establish the reasons for changes in the ratio i.e. improvement or deterioration in return on capital, the ratio is broken down into its component elements. The component elements are also ratios and are referred to as secondary ratios.
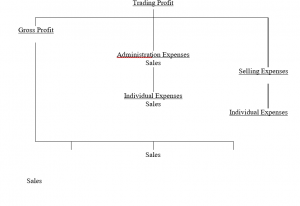
The relationship between the primary ratio, return on capital, and the secondary ratios of which it is composed can be seen from the following ratio pyramid.
Ratio on
Return on Capital
Ratios on Ratios on Ratios
Profitability Activity on
Gearing
The mathematical relationship can be simply expressed as can be seen from the following:
Profitability x Activity x Gearing
Profit Sales Total Assets Capital
Sales x Total x Capital x Shareholders’ Employed
Assets Employed Funds
A movement in any one of these four components will affect the return on shareholders’ funds. A fall in any one of the ratios will yield a lower return on shareholders’ funds. Correspondingly if any one of the ratios increases, there will be an increase in return to the shareholders.
In addition to the categories of ratios referred to above, there are also ratios of liquidity which are used to gauge the solvency of the enterprise. Ratios, therefore, come under the following headings:
- Ratios of Return on Capital
- Ratios of Profitability
- Ratios of Activity
- Ratios of Gearing
- Ratios of Liquidity
RATIOS ON RETURN ON CAPITAL
The ratio that the shareholders are concerned with is: –
Net Profit Before
Taxation
Average Shareholders’
Funds
Average shareholders’ funds would be the average amounts of the shareholders’ funds during the year, usually a simple average of the amounts shown by the opening and closing Statement of Financial Positions. This is the return to the shareholders, which is derived by the business.
Another way of measuring return on capital is: –
Net Profit Before Interest and
Taxation
Average Capital Employed
Average capital employed is again the average of the opening and the closing Statement of Financial Positions figures for capital employed. Capital employed, however, includes both shareholders’ funds and long-term liabilities. This ratio shows the average return generated by the company on all long term capital used by it. As such, it is of less significance to the shareholder. It is useful to management in assessing the overall performance of the company in utilising all of its long-term capital.
RATIOS ON PROFITABILITY
These ratios measure the profitability of the company’s sales. They state the average amount of profit or the amount of specific expenses included per RWF1 of sales by the company. The following are the ratios commonly computed and their interrelationship.
| Ratios of Profitability – commonly computed | |
| (a) | Cost of goods sold to Sales (Key ratio) |
| (b) | Net profit to Sales (Key ratio) |
| (c) | Production materials to Sales |
| (d) | Direct Labour to Sales |
| (e)
|
Overhead costs to Sales |
Ratios of Profitability – Inter-relationship
Gross Profit to Sales
This ratio is invariable expressed as a percentage. It reveals the gross profit as a percentage of the sales value. The figure obtained should be uniform for all firms in the same industry whether they are the largest or the smallest.
Any significant deviation or change in the ratio may be due to:
- Manipulation of Inventory, purchase or sales figures
- Changes in price policy
- Changes in the purchases or sales mix
- Changes in the cost of raw materials without a corresponding change in sales prices
Businesses with a faster Inventory turnover usually have a low gross profit margin e.g. a supermarket. On the other hand the lower the Inventory turnover the higher the gross profit margin e.g. a furniture retailer.
Net Profit to Sales
The profit margin indicates the extent to which the business is protected against potential losses arising from increased costs or falling prices.
A low ratio indicates that a firm’s selling prices are too low or that its costs are too high or both. However, the ratio may be lowered by a high charge for depreciation on Non-Current Assets and raised by a low charge for depreciation.
Profit Margin on Sales
Profit Before Interest and Taxation
Sales
Production Materials to Sales
Production Materials
Costs
Sales
Direct Labour to Sales
Direct Labour
Sales
Other ratios, which may prove useful in the analysis of Operating Statements, include administration/sales, showing the percentage of administrative costs to sales; selling and distribution costs/sales showing the percentage of sales costs to sales. Care should be taken with the latter ratio, as high selling and distributive costs may be incurred in a new product launch.
Questions prompted by the use of Profitability Ratios:
- Manipulation of Inventories, purchases and sales figures
- Changes in product mix
- Changes in pricing policy
- Changes in costs of raw materials
- The velocity of Inventory turnover
- The incidence of costs including depreciation in earning profits (g) The margin of safety
The proportions of materials, direct labour, administrative cost to sales
RATIOS OF ACTIVITY
Ratios of activity measure the extent of use made of the assets of the company measured in terms of turnover generated per RWF1 of asset used. Turnover is related to total assets and to each category of asset individually to establish by comparison from year to year if the efficiency of usage of any asset is declining. The following is the inter-relationship between the ratios: –
The following should be noted about the individual ratios.
Sales/Non-Current Assets
This ratio is not of great value because the numerator and denominator are very often not comparable.
Non-Current assets are stated at their cost, perhaps many years prior to the Statement of Financial Position date. Sales, however, are valued at prices prevailing in the current year and hence the two values are incomparable. Furthermore, non-Current assets will decline in value due to depreciation without any reduction in the capacity of the plant and equipment. However, the reduction in value of the denominator increases the ratio and gives a false impression of higher utilisation of non-current assets. For this reason, a ratio-measured in terms of tonnage produced per unit of plant capacity tends to be more meaningful than the sales to non-current assets ratio.
Sales/Inventory
There are three main ways of presenting the relationship of sales to Inventories
| (a) Cost of Sales (Cost of Goods Sold)
Average Inventory |
This relationship expresses the frequency with which the average level of inventory investment was ‘recouped’ or ‘turned over’ through operations. Presumably, the higher the turnover, the better the performance by the firm, for it has managed to operate with a relatively small average commitment of funds. This, in turn, may indicate that the inventory must be relatively ‘current’ and useful, and contains little unusable inventory. On the other hand, a high turnover could mean Inventory shortages and incomplete satisfaction of customer desires. The final judgement will depend upon the industry, company and the method of valuing inventory and any observable trends.
| (b) Sales
Closing Inventory |
The ratio is a cruder standard for the same purposes as (a). The most important shortcoming is in the use of the ending inventory figure, which may not be representative of the level of inventory throughout the year. Furthermore, the investment in inventory corresponds in terms of value to the cost of goods sold, whereas sales contain the mark-up for other costs and profit over and above the recorded cost of the goods as carried in inventory. Thus, the relationship is not entirely that of comparable figures. Finally, comparability between companies may be impaired through differences in the gross margin taken on sales, which is more adequately represented by cost of goods sold. The Sales/Inventory ratio can also be broken down into:- (a) Sales/Raw Materials Inventories
- Sales/Work-in-Progress
- Sales/Finished Goods Inventory
Sales/Trade Receivables
The result is expressed in terms of “days’ sales represented by Trade Receivables” or, more commonly, as the “collection period”. This measure can be compared to the credit terms granted to customers in the industry in question and a major deviation from this norm toward slower collections will be a warning signal, especially if there is a trend over a number of periods. The promptness with which accounts are collected is an indicator of the managerial effectiveness of the credit department, as well as a reflection of the quality of the Trade Receivables. Extremely close adherence to credit terms could, on the other hand, mean that the credit policies of the company are unduly strict and profits from sales to somewhat slower customers are being lost. The ratio can be computed as follows:
| Trade
Receivables Credit Sales |
x 365 Days |
As pointed out before, the collection period is a rough measure of the overall quality of the Trade Receivables and of the credit policies of a business, but is subject to distortion, especially if sales fluctuate widely in a given period. Also, a business selling both for cash and on account presents a problem, since a separation of credit sales must be made. For a more exact picture, a detailed “ageing” of Trade Receivables can be prepared, through a classification of accounts into groups by dates of sale, in monthly or other relevant time intervals (depending on the credit terms) to see which portion is current and which is overdue. A ratio analysis of overdue accounts in proportion to outstanding accounts from selected or all periods can then be made. This information is not always available to the outsider, however.
RATIOS OF LEVERAGE/GEARING
- These ratios measure the extent to which the company has managed to finance its assets from sources of finance other than the shareholders and in particular from:
- Trade Payables
And
- Long term loan capital
The inter-relationship between the ratios can be seen to be as follows: –
Total Assets
Shareholders’ Funds
=
Total Assets Capital
Capital X Shareholders’Employed
Employed Funds
Short Term Long Term
Gearing(Trade (GearingLoan
Payables) Capital)
Capital employed is the total long-term finance of the business from shareholders and by way of loan capital. If total assets exceed capital employed, Trade Payables must finance them. A measure of the extent of the financing by Trade Payables is got from the total assets to Capital Employed ratio. It should be remembered that this form of finance is free since no interest would normally be paid to Trade Payables on their outstanding balances (as would be paid on Loan Capital finance).
This ratio of capital employed to shareholders funds indicates the proportion of the long-term capital of the business provided by shareholders.
Another important ratio of gearing is the average period of credit received from Trade Payables.
Average Period of Credit Received
| Trade Payables
Credit Purchases |
x 365
Days |
From the point of view of the creditor of a business, as well as the financial analyst, it is often desirable to apply a test to Trade Payables similar to the one for Trade Receivables. The basis of this measure is a comparison of the creditor balance with the purchases for the period. Again, a detailed ageing of the accounts would yield the most exact picture of the way in which the business handles its obligations to Trade Payables, that is, how promptly its bills are paid. In the absence of such data, the rougher measure must suffice. This ratio can be compared to the credit terms extended by the suppliers of the business to see if any abuses of these terms are made, and trends may be significant.
However, this ratio is seldom available to outsiders, since the amount of purchases are not commonly made public. In the case of a manufacturing firm, purchases may be approximated by taking the material cost from the Manufacturing Account, if available and adjusting for the change in the raw materials content of Inventories. Lacking such detail, some analysts take cost of goods sold, if available, and adjust for the change in Inventories. The latter measure is a very crude approximation, since usually cost of goods sold contains many cash charges, such as labour, repairs and so forth. It can be used without difficulty in the case of a wholesales or retailer, however. Another difficulty lies in the fact that Trade Payables often include debts incurred for purposes other than raw material purchases and such debts may vary greatly from time to time. Consequently, the ratio, if obtained, is usually less reliable than the Trade Receivables measure.
Finally, the remaining gearing ratio to be considered is the coverage of fixed interest charges. This ratio tells the number of times by which profit before interest would have to fall before the company is unable to pay its interest on loan capital. It is computed as follows:
| Profit Before
Interest Total Interest Payable |
RATIOS OF LIQUIDITY
There are two key ratios of liquidity:
- The Current Ratio
- The Acid Test Ratio
The Current Ratio
| Current Assets
Current Liabilities |
The current ratio is one of the most commonly used indices of financial strength, although it is a rather crude measure. The basic question underlying this ratio is the ability of the business to meet its current obligations with a margin of safety to allow for a possible shrinkage of value in its various current assets, such as Inventories and Trade Receivables. This test, applied at a single point in time, implies a liquidation approach rather than a judgement on the going concern, for it does not explicitly take into account the revolving nature of current assets and current liabilities.
The general impression regarding this measure is that the higher the ratio the better. In fact, there are many instances where financial managers try to improve the current ratio of periodic Statement of Financial Positions by paying off with cash as many of their current obligations as possible on the day prior to the Statement of Financial Position date. If the company has a current ratio of better than 1:1, this process will raise the current ratio, since the same amount will be deducted from both sides of the ratio. The process will worsen the picture if the ratio is less than 1:1. From the point of view of the Trade Payables, this may be true. From the standpoint of prudent management, there may be serious doubts about the wisdom of an excessive build-up, especially of redundant cash lying idle, or worse, a build-up of Inventories out of proportion to the needs of the business. Another distorting factor is the seasonal character of some businesses, which can be reflected to a great extent in a fluctuating current ratio. In the interpretation of this ratio thought should, therefore, be given to the components (for example, cash, Trade Receivables, Inventories, Trade Payables, and so forth) forming the ratio, the character of the business and the industry, as well as future expectations.
A general popular rule of thumb for the current ratio is considered to be a 2:1 relationship. Used without caution and discrimination, however, such a vague overall standard is rather dangerous. A 2:1 current ratio or even a 10:1 current ratio does not of itself guarantee reserve strength to meet current obligations, or the ability to turn current assets (especially Inventories) into cash as needed liquidity. Much depends on the quality and character of the current assets. Furthermore, the type of industry involved plays a major role in the need for more or less current financial strength and liquidity. For instance, a public utility with a preponderance of Non-Current Assets and a steady cash flow faces a need for current payment much different from those of wholesalers whose primary investment is in Inventory and Trade Receivables subject to changes in value. A manufacturer has financial problems different from those of a rental store, because of differences in the character of investments and operations.
A figure related to the current ratio is the item “net current assets” or “net working capital”.
This is simply the difference between current assets and current liabilities. The analyst (especially the credit analyst) looks upon this figure, and its movements over several periods, as an indicator of reserve strength to weather adversities. Bank loans are often tied to a minimum requirement for working capital (i.e. restrictive covenants).
The Liquidity Ratio or “Acid Test”
| Trade Receivables, Cash, Marketable
Securities |
Current Assets – Closing
Inventory |
|
| Current Liabilities | Current Liabilities |
This ratio arises from the same basic desire to measure a business’ ability to meet its current obligations through the use of its current assets as does the current ratio. It is, however, a far more severe test since it is an attempt is eliminate some of the disadvantages of the current ratio by concentrating on strictly liquid assets whose value is fairly certain. By excluding investors from consideration, the questions asked in fact become: “If the business were to stop selling today, what are its chances for paying off its current obligations with the readily convertible funds on hand?” The acid test thus again backs away from the assumption of a going concern, by not considering future funds flows of the business.
A rule of thumb of 1:1 is commonly applied here with a little more justification, since a preselection of presumable liquid assets has been made. A result far below 1:1 can be a warning signal, but a blind application of this rule should be avoided.
LIMITATIONS OF RATIO ANALYSIS
There are a number of points, which should be borne in mind when using ratio analyses in interpreting accounting information.
- The source information on which ratios are based is usually the final accounts of a business comprising of the Statement of Comprehensive Income and the Statement of Financial Position of the concern in question. The Statement of Financial Position is a position of the firm at a specific point in time. If the Statement of Financial Position has been drawn up one month earlier or later it would perhaps have shown a completely different picture especially the Current Asset/Current Liability situation. The Statement of Financial Position is a static piece of accounting information and therefore any ratio based wholly or partly on Statement of Financial Position figures must suffer from the same defect. In addition seasonal variations must also be considered.
- The revenue accounts of a business i.e. the Statement of Comprehensive Income show a cumulative or dynamic situation. In other words, the underlying trends of the concern would be equally well shown by revenue accounts drawn up for periods of less than one year bearing in mind seasonal variation. Therefore, more reliability may be placed on those ratios computed wholly from revenue account figures.
- A ratio by itself may be almost worthless, a standard will, therefore, have to be established, this may be found either from a firm at a similar stage of development in the same industry, or from previous years accounts of the same firm.. As sources of information, these have their limitations as they are based on published accounts.
- Ratio analysis does not provide the answers to business problems. It is a tool, which enables the financial manager or investigator to ask the right questions.
SUMMARY
The prime objectives of analysis and interpretation of accounting information is to ascertain: (i) The operating performance of the firm in terms of how well the business is utilising its assets
- Whether there is excessive investment in Non-Current Assets
- If the business is adequately financed
- The Inventories position of the firm and find out if it carries excessive or obsolete Inventories
- The liquidity position of the concern
- Whether its profit margin are in line with comparable businesses
In other words, the objective of ratio analysis is to discover the reality behind the situation.
CHECKLIST
Introduction
The purpose of this checklist is to illustrate in a logical sequence the main points, which should be highlighted when analysing and interpreting financial information. It may be used in a general situation where an overall analysis is required or in a specialised situation where only particular information is needed by making reference to specific sections.
SECTION 1
Liquidity
- Current Ratio
The ability of the firm to meet its current obligations.
1.5 to 1 leaves a reasonable margin: greater than 2 indicate idle assets.
Less than 1 indicates inability to satisfy current obligation out of current assets.
- Liquidity Ratio 1 to 1.1 is ideal
Compare with Current ratio to show incidence of Inventory as a current asset.
General – Large Trade Receivables/Trade Payables, little cash or large overdraft may indicate overtrading.
Overtrading – A firm is said to be ‘overtrading’ when it conducts a volume of trade far in excess of that justified by the proprietors “own funds”, so that the substantial circulating assets needed to support the high level of trade are unduly dependent on outside finance.
- Trade Receivables Ratio
- The question of Credit Control
- Incidence of Bad Debts
- Suggest preparation of age Analysis of Trade Receivables
- Examine the mix of cash to credit sales
- Trade Payables Ratio –
- Easing or tightening of credit by suppliers
- Mix of cash to credit purchases
Express (iii) and (iv) above in terms of days. Take a year as being 365 days. In practice, it is customary to take the figure for Trade Receivables or Trade Payables at the year end and express the Trade Receivables/Trade Payables Ratios by the number of months’ sales or purchases the figure represents.
General – Trade Payables Ratio should exceed Trade Receivables Ratio so as to take maximum advantage of finance provided. However, take note nature of business e.g. in supermarket business, there are cash sales and, therefore, no Trade Receivables while in the professional business, there are few Trade Payables, but normally a high debtor’s figure.
- Inventories
- Over/undervaluation
- Obsolete or slow moving Inventory
- Second quality/sub-standard goods
- Too much/too little to support level of business activity
- Poor Inventory control
Definitions
Solvency A business is said to be SOLVENT when it can meet its CURRENT AND FIXED LIABILITIES out of its TOTAL ASSETS
Liquid A business is said to be LIQUID when it can meet its CURRENT LIABILITIES
out of its CURRENT ASSETS
SECTION 2
Efficiency
- Return on Capital Employed
- Compute in terms of MARKET VALUE of assets
- Prime yardstick for measuring EFFICIENCY of business
- Net Asset Turnover
- Utilisation of assets, but note incidence of costs to achieve this objective
- Compute in conjunction with Profit/Sales Ratio to achieve (i) above
- Fixed Asset Turnover
- High Ratio – Greater efficiency in fixed asset utilisation
- Low Ratio – Poor efficiency. Remedy dispose of idle assets
- Sales to Net Current Assets
The amount of capital required achieving an additional RWF1 of sales, given no shortage of capacity
SECTION 3
Profitability
| (i) Gross Profit to Sales | |
| (a) Use of comparison with previous years and other firms in the same industry | |
| (b) Deviations
– Manipulations in Inventory, purchases, sales – Changes in purchases/sales mix – Changes in raw materials costs with a corresponding – Change in sales prices |
|
| – Poor cut-off | |
| (ii) | Profit Margin on Sales |
| (a) Compute with Net Asset Turnover above | |
|
|
(b) Selling price too low/costs too high |
| (iii) | Other ratios, which are Significant in Analysis of Operating Statements. |
| i.e. (i) Production Materials/Sales | |
| (ii) Direct Labour/Sales | |
|
|
(iii) Employee Ratio – Sales per employee |