SECTION A (32 marks)
Grower ALL the questions in this section in the spaces provided after each question.
I A supervisor in a factory recorded tlie following figures of lateness, in minutes, for 20 workers.
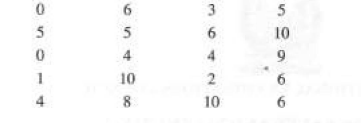
Construct a frequency distribution table for the above data, starting with the classes 0-2, 3-5 … (4 marks)
2. Outline three advantages of using observation method in the collection of data. (3 marks)
3 Distinguish between a diagpnul matrix and a scalar matrix, giving an example in each case, (4 marks)
4 A firm’s labour force is growing at the rate of 5 percent per annum. Currently the firm has 500 employees. Determine its expected labour force in live years’ time. (2 marks)
A farmer borrowed Ksh 560,000 from a bank, lie was required to repay the lean with simple interest for a period of 48 months. The repayment amount was Ksh 21,000 per month.
Determine the simple interest rate per annum. (4 marks)
6 The mean age of 15 teenagers an a self-awareness class was 19 years. On a du teenagers was absent, the rest gave their ages as follows; 21.19,20. 19, 18. 17. 20.18.21.17.
18, 16.22,20, Determine the age of the absent teenager. (2 marks)
An investor preparing to purchase a business. estimated the profits in the first year to be as
follows;
Profits (Ksh.'(MM)’s) Probability
500 0.15
400 0.15
100 0.7
Calculate the expected value of profits in the first year (2 marks)
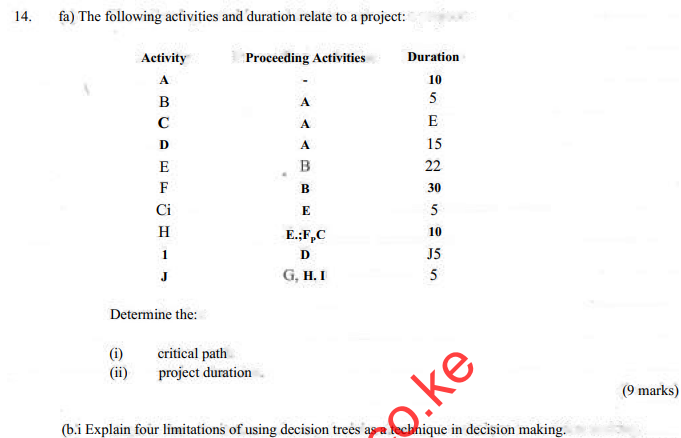
8. Stale three rules followed when drawing a network diagram
9. The prices of a certain commodity for a period of four months are given as follows:
Month Price Kshs.)
January 40
February 45
March 60
April « 55
Using January as the base period, calculate the price index for each month <4 marks)
10. Outline four components of a time series.
II, (a) Explain lour circumstances under which a researcher may prefer a sample to a census, in the collection of data, (H marks)
(b) 1 he distribution of profits uf SO companies are shown in the table below;
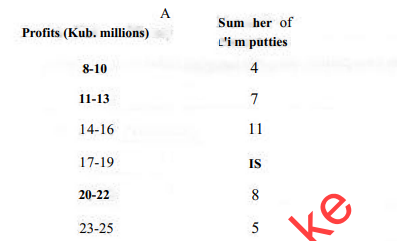
Calculate the:
(i) arithmetic mean
fii) variance.
(9 marks)
Sum her of l’i m putties
12. (a) Ina survey of 200 clients of an insurance company, it was found (hat:
90 had a life insurance policy
70 had a medical policy
7b had an educational policy
36 had life and education policies
30 had life and medical policies
40 had education and medical policies
N had life, education and medical policies
(i) Present the information above in form of a Venn diagram; di i Determine the number of clients who had:
I exactly one policy
II at least two policies
III none of the three policies.
13. (a) A firm has analysed (heir operating conditions and has developed the following functions:
Revenue • (TR) = 4U0Q – 4Q:
Cost (TC) Q:
+ 10Q ■ 30
Where Q is the number of units sold.
Determine the:
(i I Level of output (Q) that the Finn should sell in order to maximize profit,
(ii) Price that maximize profit;
(iii) Maximum profit (9 marks)
lb) Explain the meaning of each of the following terms as used in Financial Mathematics
(i) compounding
(ii) discounting
(iii) perpetuities
(iv) annuities.