
Population
Before the industrial revolution population growth was held in check by high mortality rates, which were accompanying high birth rates. The source of high mortality rates in a classical Malthusian perspective could have been the limitation in the amount of available
agricultural resources, either continuously, leading to poor nutrition (and therefore to higher morbidity and premature deaths), or episodically, through famines. But there were also other forces at play. First of all very high rates of child mortality, either through systematic infanticide (itself probably a function of available resources), especially of females, or as a consequences of neglect and of poor living, childbearing, and childrearing conditions
Second, possible neglect of the elders, the disabled and the infirm and the spread of epidemic diseases (which was favored by overcrowding and poor living conditions in the cities of agricultural societies),
Third endemic warfare, between tribes, nations or individuals, leading to direct deaths as well as to the misdirection and destruction of the resources otherwise available for survival. Still, following the improvements of agricultural technology in particular, there was some population growth at a very slow pace, slightly accelerating in time.
Later on, especially since the half of the nineteenth century, the decrease in mortality rates (a true “mortality revolution” “which has resulted in doubling or more of average life expectancy at birth” and has been the direct consequence of the diffusion of medical knowledge and discoveries that has followed with some delay the Industrial Revolution) has led to a much faster population growth, while the demographic consequences of two world wars and related upheavals are shown in a temporary decrease of growth rates.
The post World War II period has seen an unprecedented population explosion, with some signs of abating however following increasing living standards and progresses in the technology of birth control, In Malthus’ own words: “The positive checks to population are extremely various, and include every cause, whether arising from vice or misery, which in any degree contributes to shorten the natural duration of human life. Under this head, therefore, may be enumerated all unwholesome occupations, severe labour and exposure to the seasons, extreme poverty, bad nursing of children, great towns, excesses of all kinds, the whole train of
common diseases and epidemics, wars, plague, and famine.”
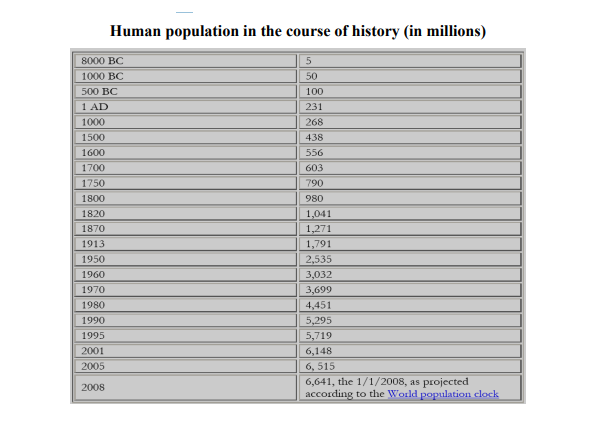
According to Ember (1978) about 60% of the societies of hunter gatherers of which there is documentation were recorded to be at war at least once every two years. As to preindustrial civilizations it is enough to recall world and European history (for instance, considering European history immediately preceding the Industrial Revolution, in the 16th century 95% of the time there were wars involving the major European powers, 94% in the 17th and 78% in the 18th century. The table below shows the trend in human population growth in the course of history.
Poverty
The concept of poverty is plagued by a conceptual complexity that can be best described as a series of fault lines. These are:
Individual or household measures- Early measurement of poverty (e.g. by Rowntree) was at the household level, and much still is. Other analysis disaggregates to the individual level, so as to capture intra-household factors and different types and causes of deprivation affecting men, women, children, old people, etc.
Private consumption only or private consumption plus publicly provided goodsPoverty can be defined in terms of private income or consumption (usually consumption rather than income, in order to allow for consumption smoothing over time, e.g. by managing
savings), or to include the value of goods and services provided publicly, the social wage
Monetary or monetary plus non-monetary components of poverty- So-called moneymetric measures are often used, because they are either regarded as sufficient on their own or seen as an adequate proxy for poverty. However, there is a clear fault line between definitions of poverty which are restricted to income (or consumption) and those which incorporate such factors as autonomy, self-esteem or participation.
In Maslow’s hierarchy of needs, these were seen as higher needs, which would become more important as basic needs for food, shelter, housing and safety were met. However, many current definitions deliberately blur the distinction between higher and lower needs.
Snapshot or timeline- Many surveys and poverty assessments report the incidence of poverty at a point in time. However, there is a long history of thinking about poverty in terms of life cycle experience (e.g. Chayanov’s pioneering work in the 1920s on the peasant
household), seasonal stress, and shocks (illness, drought, war). In both North and South, there has been increasing attention to understanding movement in and out of poverty, what Jenkins calls ‘bottom-end churning’. Panel surveys, which track a fixed group of individuals over time, provide data.
Actual or potential poverty– Some analysts include as poor those who are highly sensitive to shocks, or not resilient. Small-scale pastoralists exposed to the risk of drought are a common example: current income may be adequate, but vulnerability is high. Planning for these groups means understanding both short-term coping strategies, and also long-term adaptation to livelihood stress.
Stock or flow measures of poverty- The definition of poverty as income focuses on the flow of material goods and services. An alternative is to examine the stock of resources a household controls. This may be measured in terms of physical or monetary assets (land, jewellery, cash), or in terms of social capital (social contacts, networks, reciprocal relationships, community membership).
Sen analyzed the commodity bundles to which an individual was ‘entitled’: as Swift has emphasized, entitlements may derive not just from current income, but also from past investments, stores or social claims on others (including the State).
Input or output measures- Sen has reminded us that poverty measured as a shortfall in income essentially captures an input to an individual’s capability and functioning rather than a direct measure of well-being. Writing about poverty has often assumed, wrongly, an automatic link between income and participation, or functioning, in the life of a community.
Absolute or relative poverty- The World Bank currently uses a figure of $US1 per day for absolute extreme poverty and $US2 for poverty. The alternative has been to define poverty as relative deprivation, for example as half mean income, or as exclusion from participation in society. Thus the European Union has decided that ‘the poor shall be taken to mean persons, families and groups of persons whose resources (material, cultural, social) are so limited as to exclude them from the minimum acceptable way of life in the member state in which they live’.
Objective or subjective perceptions of poverty- The use of participatory methods has greatly encouraged an epistemology of poverty which relies on local understanding and perceptions. For example, exposure to domestic violence may be seen as important in one
community, dependency on traditional structures in another.
Is There a Right Answer to the Definition of Poverty?
Is there a single right definition of poverty? The answer is certainly ‘no’, but current thinking does allow some simplification. First, there is no philosophical disagreement with the statement that poverty needs to be understood first and foremost as a problem at the individual rather than the household level, though an understanding of an individual’s position within the household is essential to
understanding the dimensions as well as the causes of disadvantage.
Second, most observers would include income obtained from common property and state provided commodities, particularly social welfare payments, though not always health and education provision.
Third, there is again little dissent from the view that people move in and out of poverty, and that seasonal, cyclical or stochastic shocks are important. For example, the distinction between chronic and transitory food security is mirrored in writing about poverty.
Fourth, relative poverty and relative deprivation are accepted as relevant, at least in theory. In developing countries, most definitions of poverty still rely on calculation of the cost of a basket of basic needs, but distribution data are normally provided.
Beyond these areas of agreement, there are different views on whether assets, including social claims, should be counted in a poverty matrix, on the importance of vulnerability, and on the relative prioritization of monetary and non-monetary variables. The most radical proponents of a participatory approach would deny the validity of standardized, so-called objective measures of poverty, whether based on income or wealth. Chambers, for example, has argued that these approaches are reductionist. This can be problematic. Baulch has pointed out that there is an important trade-off between being able to identify the poor using local indicators, and being able to aggregate the results into meaningful, national or international figures: objective measures of poverty present
numerous problems in terms of identifying the poor, but succeed in providing the aggregate statistics policy maker’s desire.
Indicators of Poverty
There is nothing inherently wrong with setting targets and measuring progress towards them; nor with developing indicators useful for resource allocation. However, different models of poverty imply different indicators.
- Money metric models require information on income or consumption;
- vulnerability models use indicators of wealth and exposure to risk, as well as income;
- models concerned with capability and functioning present indicators of life expectancy or educational achievement;
- Models of well-being or social exclusion will include measures like the degree of social support.
It is frequent practice, however, to present a wider set of indicators than is immediately required. For example, World Bank poverty assessments, concentrating on money metric measures, will also provide evidence on health, education, physical isolation, and other socalled correlates of poverty. Some indicators are inherently more quantifiable than others, and more decomposable, in the sense that they can be subjected to statistical manipulation. Other measures of poverty are more qualitative and/or more location-specific, and cannot so easily be aggregated.
Inequality
While a considerable share of the world population still lives in poverty, world income and wealth are very unequally distributed. Recent research shows the extent of world inequality in the distribution of personal wealth: The 24 richer OECD countries own 83% of
world private wealth. The 64 poorest countries with 40% of world population own 2% of world personal wealth. In 2000 the 1% richest adults owned the 40% of overall private wealth the richest 10%, 85%; the poorest 50%, 1%.
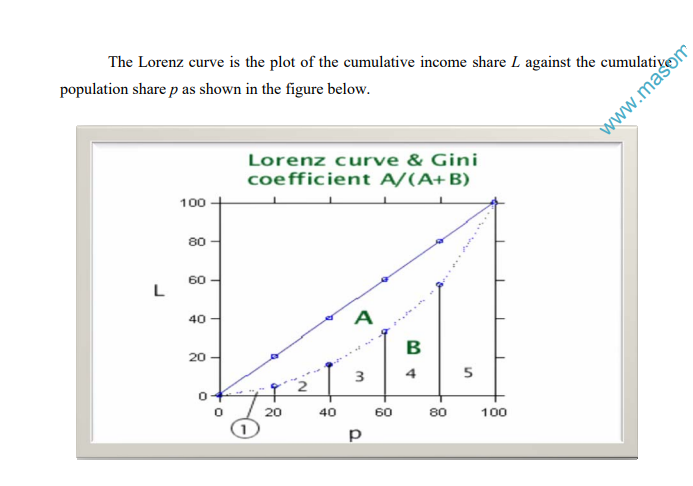
The Gini Coefficient and Lorenz curve
One common measure of inequality is the Gini coefficient. To calculate the gini coefficient, imagine that all income-receiving units (IRUs) such as households are ranked by income from the smallest to the largest, and calculate the cumulative share of income accruing to each category of the populations from poorest to richest, as in the following table of the 1983 U.S. family income distribution.
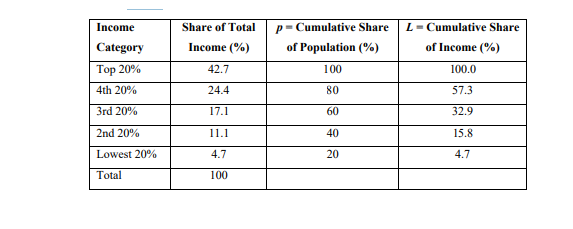
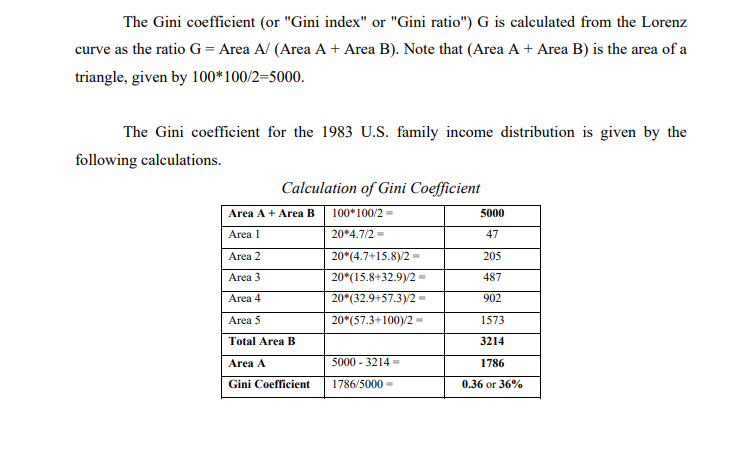
Thus the Gini coefficient in this example is 1786/5000 = 0.36 or 36%.
In the Lorenz curve the 45 degrees line represents a situation of perfect equality. In general, the closer the Lorenz curve is to the line of perfect equality, the less the inequality and the smaller the Gini coefficient. The Gini index of inequality of overall world wealth distribution (calculated using current exchange rates) is given as 89 Income is distributed less unequally than wealth, but still
in a markedly unequal way. According to most estimates the Gini coefficient of world income distribution is around 65% in the contemporary world. To make a comparison, the Gini index of the distribution of family incomes of Italy is reported as 36, that of the USA 45, that of Sweden 25.