
CHAPTER 5
INFORMATION SYSTEM PROJECT MANAGEMENT
Meaning and importance of information system project management
Project Management is a set of principles, methods and techniques for effective planning of objective-oriented work, thereby establishing a sound basis for effective scheduling, controlling and re-planning in the management of programs and projects.
In other words, it provides an organization with powerful tools that improve the organization’s ability to plan, organize, implement and control its activities and the ways it uses its people and resources.
A project is a non-repetitive one-of-a-kind activity normally with discrete time, financial and technical performance goals. Normally a complex effort, usually less than 3 years in duration and it is made up of interrelated tasks performed by various organizations.
The project management tools and principles provide the means for;
project breakdown into tasks and sub-tasks
finding interdependencies between the tasks
allocating resources, human and material and smoothing resources
estimation for total project duration and budget
monitoring more efficiently project progress
Project management ideas are equally applicable to small as well as very large projects (with small and large number of tasks). However, the formal tools used are more appropriate for rather large projects. Information system project management techniques
Project Management Tools
There are many tools available to assist with accomplishing the tasks and executing the responsibilities. Some require a computer with supporting software, while others can be used manually. Project managers should choose a project management tool that best suits their management style. No one tool addresses all project management needs. Program Evaluation Review Technique (PERT) and Gantt Charts are two of the most commonly used project management tools and are described below
PERT is a planning and control tool used for defining and controlling the tasks necessary to complete a project. PERT charts and Critical Path Method (CPM) charts are often used interchangeably; the only difference is how task times are computed. Both charts display the total project with all scheduled tasks shown in sequence. The displayed tasks show which ones are in parallel, those tasks that can be performed at the same time. A graphic representation called a “Project Network” or “CPM Diagram” is used to portray graphically the
interrelationships of the elements of a project and to show the order in which the activities must be performed.
PERT planning involves the following steps.
1. Identify the specific activities and milestones. The activities are the tasks of the project. The milestones are the events that mark the beginning and the end of one or more activities.
2. Determine the proper sequence of activities. This step may be combined with #1 above since the activity sequence is evident for some tasks. Other tasks may require some analysis to determine the exact order in which they should be performed.
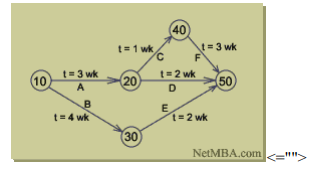
3. Construct a network diagram. Using the activity sequence information, a network diagram can be drawn showing the sequence of the successive and parallel activities. Arrowed lines represent the activities and circles or “bubbles” represent milestones.
4. Estimate the time required for each activity. Weeks are a commonly used unit of time for activity completion, but any consistent unit of time can be used. A distinguishing feature of PERT is it’s ability to deal with uncertainty in activity completion times. For each activity, the model usually includes three time estimates:
o Optimistic time – the shortest time in which the activity can be completed.
o Most likely time – the completion time having the highest probability.
o Pessimistic time – the longest time that an activity may take.
From this, the expected time for each activity can be calculated using the following weighted average:
Expected Time = (Optimistic + 4 x Most Likely + Pessimistic) / 6
This helps to bias time estimates away from the unrealistically short timescales normally assumed.
5. Determine the critical path. The critical path is determined by adding the times for the activities in each sequence and determining the longest path in the project. The critical path determines the total calendar time required for the project. The amount of time that a non-critical path activity can be delayed without delaying the project is referred to as slack time. If the critical path is not immediately obvious, it may be helpful to determine the following four times for each activity:
o ES – Earliest Start time
o EF – Earliest Finish time
o LS – Latest Start time
o LF – Latest Finish time
These times are calculated using the expected time for the relevant activities. The earliest start and finish times of each activity are determined by working forward through the network and determining the earliest time at which an activity can start and finish considering its predecessor activities. The latest start and finish times are the latest times that an activity can start and finish without delaying the project.
LS and LF are found by working backward through the network. The difference in the latest and earliest finish of each activity is that activity’s slack. The critical path then is the path through the network in which none of the activities have slack.
6. Update the PERT chart as the project progresses. As the project unfolds, the estimated times can be replaced with actual times. In cases where there are delays, additional resources may be needed to stay on schedule and the PERT chart may be modified to reflect the new situation. An example of a PERT chart is provided below:
Benefits to using a PERT chart or the Critical Path Method include.
Improved planning and scheduling of activities.
Improved forecasting of resource requirements.
Identification of repetitive planning patterns which can be followed in other projects, thus simplifying the planning process.
Ability to see and thus reschedule activities to reflect inter-project dependencies and resource limitations
following know priority rules.
It also provides the following: expected project completion time, probability of completion before a specified date, the critical path activities that impact completion time, the activities that have slack time and that can lend resources to critical path activities, and activity start and end dates.
Gantt charts
Gantt charts are used to show calendar time task assignments in days, weeks or months. The tool uses graphic representations to show start, elapsed, and completion times of each task within a project. Gantt charts are ideal for tracking progress. The number of days actually required to complete a task that reaches a milestone can be compared with the planned or estimated number. The actual workdays, from actual start to actual finish, are plotted below the scheduled days. This information helps target potential timeline slippage or failure points. These charts serve as a valuable budgeting tool. Sign of a failing information system project
Lack of User Input
Incomplete Requirements & Specifications
Changing Requirements & Specifications
Lack of Executive Support
Technical Incompetence
Causes of information system project failure
• Lack of stakeholder/user input
• Incomplete and/or vaguely defined requirements or specifications
• Changing requirements or specifications
• Lack of executive support
• Insufficient planning
• Underestimated time and/or resources allocated for design, development, quality assurance, and/or quality
control
• Technological incompetence
• Insufficient resources
• Unrealistic expectations
• Unclear objectives
• Unrealistic timeframes
• New or untested technology
Explaining control measures and technique of a failing information system
project
Greater top management support
More commitment from users
More power and decisions making authority
Greater financial control and flexibility
Greater Control over staff resources
Commitment to requirements and scope once specified
More project management training
Commitment to a stable project management method
Alignment of IT project initiatives to business strategy
Greater understanding of project management on the part of top management, project boards and clients
Greater realism in setting targets. Several respondents railed against imposed rather than planned targets and
deadlines
Establishment of a supportive project/programme office.
Implementation failures and success
Many systems that are implemented normally fail. The problems causing implementation
failure fall into multiple categories.
This could be due to technical and non-technical resources.
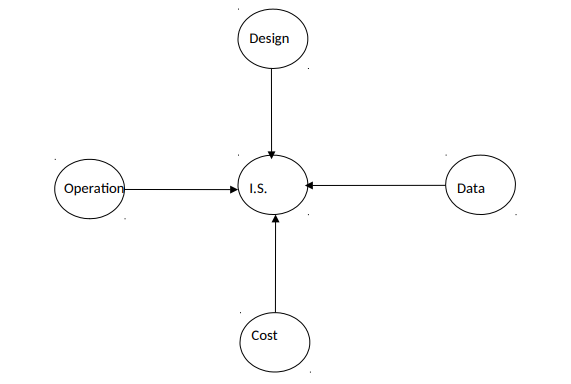
1. Design – The actual design of the system fails to capture essential business requirements or improve organizational performance. The system may be
designed with a poor user interface.
2. Data – The data is the system may have a high level of inaccuracy or inconsistency. The information is certain fields may be erroneous or ambiguous.
Design Operation I.S. Data Cost
3. Cost– Some systems operate quite smoothly, but their cost to implement and run on a production basis is way over the budget.
4. Operation – The system may not run well. The information isn’t provided in a timely and efficient manner due to the result of breakdowns etc. The following factor provides a measure of a system that is successful.
i. There is high level of system use
ii. User satisfaction with the system – this might include users opinion or accuracy, timeliness and relevance of information and on the quality of service and schedule of operations.
iii. Favorable attitude of users about I.S and the systems staffs.
iv. Achieved objectives, the extent to which the system meets is specified goals, improved organizational performance and decision making resulting from the use of the system.
v. Financial pay-offs of the organization i.e. by reducing cost or by increasing sales.
Causes of implementation success or failure
The outcomes of implementation can be determined by the following:-
1. The role of users is the implementation process.
2. The degree of management support for the implementation process.
3. The level of complexity and risks of the implementation progress.
4. The quality of management in the implementation process.
What can go wrong during implementation process?
a) Analysis:
1. Time, money and resources haven’t been allocated to researching the problem.
The problem remains poorly defined.
2. Little or no time is spent in preliminary planning.
3. The project team isn’t properly staffed.
4. The information system promises results that are impossible to deliver.
5. Requirements are delivered from inadequate documentation of existing systems or
incomplete findings from systems study activities.
6. Users refuse to spend any time helping the project team gather the required information.
7. Project analyst cannot interview users properly.
b) Design
1. Users have no responsibility towards the design of inputs, outputs and the
processes. The design is reflecting the bias of the technical staff
2. The system is designed only to serve current needs.
3. Drastic change is the clerical procedures or staffing with or without proper planning in the organization.
4. Financial specifications are inadequately documented.
c) Programming
1. Amount of time and money required for software development is underestimated.
2. Programmes supplied with incomplete specifications.
3. Not enough time is devoted to the development of the program logic.
4. Programs don’t take full advantage of structured design (they do spaghetti programming).
5. Programs adequately documented.
d) Testing
1. Amount of time and money required for proper testing is underestimated.
2. The project team doesn’t develop an organized test plan
3. Users aren’t sufficiently involved in testing (no-user acceptance testing).
4. The implementation team doesn’t develop appropriate acceptance tests for managerial review.
e) Conversion
1. Insufficient time and money are budgeted for conversion activity.
2. The system is made operated before its fully ready.
3. Not all stakeholders are involved .e. during training.
4. The system and users documentation is inadequate.
5. There is no performance evaluation and standards hence no framework for
measurement.
6. Insufficient information systems personnel are trained to support the system and
to make maintenance changes.