
IAS 34-INTERIM FINANCIAL REPORTING
OBJECTIVE
The objective of this Standard is to prescribe the minimum content of an interim financial report and to prescribe the principles for recognition and measurement in complete or condensed financial statements for an interim period.
SCOPE
This Standard does not mandate which entities should be required to publish interim financial reports, how frequently, or how soon after the end of an interim period.
Publicly traded entities are encouraged:
- To provide interim financial reports at least as of the end of the first half of their financial year; and
- To make their interim financial reports available not later than 60 days after the end of the interim period.
DEFINITIONS
Interim period is a financial reporting period shorter than a full financial year.
Interim financial report means a financial report containing either a complete set of financial statements (as described in IAS 1 Presentation of Financial Statements (as revised in 2007)) or a set of condensed financial statements (as described in this Standard) for an interim period.
Minimum components of an interim financial report
An interim financial report shall include, at a minimum, the following components:
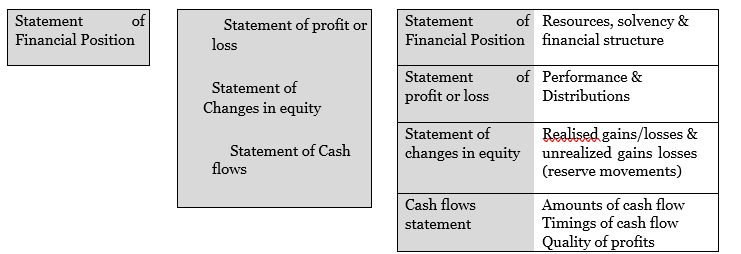
- a condensed statement of financial position;
- a condensed statement of profit or loss and other comprehensive income, presented as either;
- a condensed statement of changes in equity; (d) a condensed statement of cash flows; and (e) Selected explanatory notes.
FORM AND CONTENT OF INTERIM FINANCIAL STATEMENTS
The condensed statement of financial position should include, as a minimum, each of the major components of assets, liabilities and equity as were in the statement of financial position at the end of the previous financial year, thus providing a summary of the economic resources of the entity and its financial structure.
The condensed statement of profit or loss and other comprehensive income should include, as a minimum, each of the component items of income and expense as are shown in profit or loss for the previous financial year, together with the earnings per share and diluted earnings per share.
The condensed statement of cash flows should show, as a minimum, the three major sub-totals of cash flow as required in statements of cash flows by IAS 7, namely: cash flows from operating activities, cash flows from investing activities and cash flow from financing activities.
The condensed statement of changes in equity should include, as a minimum, each of the major components of equity as were contained in the statement of changes in equity for the previous financial year of the entity.
Significant events and transactions
An entity shall include in its interim financial report an explanation of events and transactions that are significant to an understanding of the changes in financial position and performance of the entity since the end of the last annual reporting period. Information disclosed in relation to those events and transactions shall update the relevant information presented in the most recent annual financial report.
The following is a list of events and transactions for which disclosures would be required if they are significant: the list is not exhaustive.
- Accounting policy changes
- Seasonality or cyclicality of operations
- Unusual and significant items
- Changes in estimates
- Issuances, repurchases, and repayments of debt and equity securities
- Dividends paid
- A few items of segment information (for those entities required by IFRS 8 to report segment information annually)
- Significant events after the end of the interim period
- Business combinations
- Long-term investments
- Restructurings and reversals of restructuring provisions
- Discontinued operations
- Changes in contingent liabilities and contingent assets
- Corrections of prior period errors
- Write-down of inventory to net realisable value
- Impairment loss on property, plant, and equipment; intangibles; or other assets, and reversal of such impairment loss
- Litigation settlements
- Any debt default or any breach of a debt covenant that has not been corrected subsequently
- Related party transactions
- Acquisitions and disposals of property, plant, and equipment
- Commitments to purchase property, plant, and equipment
Periods for which interim financial statements are required to be presented
Interim reports shall include interim financial statements (condensed or complete) for periods as follows:
- Statement of financial position as of the end of the current interim period and a comparative statement of financial position as of the end of the immediately preceding financial year.
- Statement of profit or loss and comprehensive income for the current interim period and cumulatively for the current financial year to date, with comparative statements of comprehensive income for the comparable interim periods (current and year-to-date) of the immediately preceding financial year.
- Statement of changes in equity cumulatively for the current financial year to date, with a comparative statement for the comparable year-to-date period of the immediately preceding financial year.
- Statement of cash flows cumulatively for the current financial year to date, with a comparative statement for the comparable year-to-date period of the immediately preceding financial year. If the company’s business is highly seasonal, IAS 34 encourages disclosure of financial information for the latest 12 months, and comparative information for the prior 12-month period, in addition to the interim period financial statements.
Materiality
In deciding how to recognise, measure, classify, or disclose an item for interim financial reporting purposes, materiality shall be assessed in relation to the interim period financial data.
In making assessments of materiality, it shall be recognised that interim measurements may rely on estimates to a greater extent than measurements of annual financial data.
RECOGNITION AND MEASUREMENT
Accounting Policies
The same accounting policies should be applied for interim reporting as are applied in the entity’s annual financial statements, except for accounting policy changes made after the date of the most recent annual financial statements that are to be reflected in the next annual financial statements.
Measurement
Measurements for interim reporting purposes should be made on a year-to-date basis, so that the frequency of the entity’s reporting does not affect the measurement of its annual results.
- Revenues received seasonally, cyclically, or occasionally within a financial year shall not be anticipated or deferred as of an interim date if anticipation or deferral would not be appropriate at the end of the entity‘s financial year.
Some entities consistently earn more revenues in certain interim periods of a financial year than in other interim periods, for example, seasonal revenues of retailers. Such revenues are recognised when they occur.
- Costs incurred unevenly during the financial year shall be anticipated or deferred for interim reporting purposes if, and only if, it is also appropriate to anticipate or defer that type of cost at the end of the financial year.
- Employer payroll taxes and insurance contributions on an annual basis
- Major planned periodic maintenance or overhaul expected to occur late in the year is not anticipated Year-end bonuses are anticipated for interim reporting purposes if, and only if:
- The bonus is a legal obligation, or past practice would make the bonus a constructive obligation and the
- Entity has no realistic alternative but to make the payments; and o A reliable estimate of the obligation can be made.
- Holiday pay: If an enforceable obligation on the employer, then any unpaid accumulated holiday pay may be accrued in the interim financial report.
- Intangible assets: Entities are required to apply the definition and recognition criteria for an intangible asset in the same way in an interim period as in an annual period.
- Other planned but irregularly occurring costs are generally are discretionary, even though they are planned and tend to recur from year to year.
- Depreciation and amortization are based only on assets owned during that interim period. They should not take into account asset acquisitions or disposals planned for later in the financial year. Use of estimates: All material relevant financial information being appropriately disclosed.
DISCLOSURE IN ANNUAL FINANCIAL STATEMENTS
If an estimate of an amount reported in an interim period is changed significantly during the financial interim period in the financial year but a separate financial report is not published for that period, the nature and amount of that change must be disclosed in the notes to the annual financial statements.
INTERPRETATION OF FINANCIAL STATEMENTS AND RATIO
ANALYSIS
Ratio analysis is a technique whereby complicated information is summarised to a common denominator so that a meaningful comparison of the company’s performance and financial position can be made.
Financial statements provide important financial information for people who do not have access to the internal accounts. For example, current and potential shareholders can see how much profit a company has made, the value of its assets, and the level of its cash reserves. Although these figures are useful they do not mean a great deal by themselves. If the user is to make any real sense of the figures in the financial statements, they need to be properly analysed using accounting ratios and then compared with either the previous year‘s ratios, or measured against averages for the industry.

The scenario of a performance appraisal question can take many forms.
Vertical or trend analysis
A company’s performance may be compared to its previous period’s performance. Past results may be adjusted for the effects of price changes. This is referred to as trend or vertical analysis. A weakness of this type of comparison is that there are no independent benchmarks to determine whether the chosen company’s current year results are good or bad. Just because a company’s results are better than its results in the previous financial period – it does not mean the results are good. It may be that its results in the prior year were particularly poor.
Horizontal analysis
To try to overcome the problem of vertical analysis, it is common to compare a company’s performance for a particular period with the performance of an equivalent company for the same period. This introduces an independent yardstick to the comparison. However, it is important to pick a similar sized company that operates in the same industry. Again, this type of analysis is not without criticism – it may be that the company selected as a comparator may have performed particularly well or particularly poorly. Industry average comparison
This type of analysis compares a company’s results (ratios) to a compilation of the average of many other similar types of company. Such schemes are often operated on a subscription basis whereby subscribing companies calculate specified ratios and submit them to the scheme. In return they receive the average of the same ratios from all equivalent companies in the scheme. This has the advantage of anonymity and avoids the bias of selecting a single company.
The context of the analysis needs to be kept in mind. A student may be asked to compare two companies as a basis for selecting one (presumably the better performing one) for an acquisition. Alternatively, a shareholder may be asking for advice on how their investment in a company has performed. A bank may be considering offering a loan to a company and requires advice. It may be that the chief executive asks for the chief accountant‘s opinion on your company’s results
WHAT IS THE OBJECTIVE OF FINANCIAL STATEMENTS?
To provide information about the financial position, performance and financial adaptability of an enterprise that is useful to a wide range of users for assessing the stewardship of management and for making economic decisions

Who are these users and what information do they want?
Shareholders (investment decisions) Profit and dividend prospects
Loan creditors (lending decisions) Creditworthiness and liquidity
Employees (safety of employment) Wage bargaining and future prospects
Suppliers (credit decisions) Ability to pay on time and short term liquidity
Note that most users will be interested in what has happened in the past, and what may happen in the future!

Calculating a ratio is easy, and usually is little more than dividing one number by another. Indeed, the calculations are so basic that they can be programmed into a spreadsheet. The real skill comes in interpreting the results and using that information. Saying
That a ratio has increased because the top line in the calculation has increased (or the bottom line decreased) is rather pointless: this is simply translating the calculation into words. Use the mnemonic RATIO to remind yourself to keep asking the following questions:
¤ Reason – why has this change occurred?
¤ Accident – is the change real or simply an accident of timing?
¤ Test – what can be done to test our conclusions? What other work should we do?
¤ Implications – what does this change mean? Liquidity crisis? Poor management etc?
¤ Other information – is this consistent with other information?
EXAM TECHNIQUE:
- RATIO ANALYSIS———–use appendices to show calculations / always show formula used
- COMMENTS (cause) & CONSEQUENCES (effect)
3 steps
- The gearing ratio has moved from……}
- The gearing ratio measures……………..} What is the overall picture?
- The move may be due to…………….}

INTERPRETATION OF RATIOS
Ratios can generally be broken down into several key areas: profitability, liquidity, gearing and investment.
PROFITABILITY
Profitability ratios, as their name suggests, measure the organisation‘s ability to deliver profits. Profit is necessary to give investors the return they require, and to provide funds for reinvestment in the business. Three ratios are commonly used.
Return on capital employed (ROCE)
Profit before interest and tax
Shareholders’ equity + debt
This ratio is generally considered to be the primary profitability ratio as it shows how well a business has generated profit from its long term financing. An increase in ROCE is generally considered to be an improvement.
So, Return on capital employed (sometimes known as return on investment or ROI) measures the return that is being earned on the capital invested in the business. It measures how efficiently and effectively management has deployed the resources available to it, irrespective of how those resources have been financed.
Candidates are sometimes confused about which profit and capital figures to use. What is important is to compare like with like. Operating profit (profit before interest) represents the profit available to pay interest to debt investors and dividends to shareholders. It is therefore compared with the long-term debt and equity capital invested in the business (non current liabilities + total equity). By similar logic, if we wished to calculate return on ordinary shareholders funds (the return to equity holders), we would use profit after interest and tax divided by total equity).
A return on capital is necessary to reward investors for the risks they are taking by investing in the company. As mentioned earlier, generally, the higher the ROCE figure, the better it is for investors. It should be compared with returns on offer to investors on alternative investments of a similar risk.
Movements in return on capital employed are best interpreted by examining profit margins and asset turnover in more detail (often referred to as the secondary ratios) as ROCE is made up of these component parts. For example, an improvement in ROCE could be due to an improvement in margins or more efficient use of assets.
Asset turnover
Revenue
Total assets – current liabilities
Asset turnover shows how efficiently management have utilised assets to generate revenue. When looking at the components of the ratio a change will be linked to either a movement in revenue, a movement in net assets, or both.
There are many factors that could both improve and deteriorate asset turnover. For example, a significant increase in sales revenue would contribute to an increase in asset turnover or, if the business enters into a sale and lease back agreement, then the asset base would become smaller, thus improving the result.
In other words, this ratio measures the ability of the organisation to generate sales from its capital employed. A possible variant is non-current asset turnover (revenue ÷ non-current assets). Generally the higher the better, but in later studies you will consider the problems caused by overtrading (operating a business at a level not sustainable by its capital employed). Commonly a high asset turnover is accompanied with a low return on sales and vice versa. Retailers generally have high asset turnovers accompanied by low margins: Jack Cohen, the founder of Tesco, famously used the motto ‘Pile it high and sell it cheap‘!
Profit margins
Gross profit
Revenue
The gross profit margin looks at the performance of the business at the direct trading level. Typically variations in this ratio are as a result of changes in the selling price/sales volume or changes in cost of sales. For example, cost of sales may include inventory write downs that may have occurred during the period due to damage or obsolescence, exchange rate fluctuations or import duties.
Gross margin on the other hand focuses on the organisation‘s trading activities. Once again, in simple terms, the higher the better, with poor performance often being explained by prices being too low or costs being too high.
Changes in the gross profit percentage ratio can be caused by a number of factors. For example, a decrease may indicate greater competition in the market and therefore lower selling prices and a lower gross profit or, alternatively, an increase in the cost of purchases. An increase in the gross profit percentage may indicate that the company is in a position to exploit the market and charge higher prices for its products or that it is able to source its purchases at a lower cost.
Operating profit
Revenue
The operating profit margin (or net profit margin) is generally calculated by comparing the profit before interest and tax of a business to revenue, but, beware in the exam as sometimes the examiner specifically requests the calculation to include profit before tax.
Analysing the operating profit margin enables you to determine how well the business has managed to control its indirect costs during the period. In the exam when interpreting operating profit margin it is advisable to link the result back to the gross profit margin. For example, if gross profit margin deteriorated in the year then it would be expected that operating margin would also fall.
However, if this is not the case, or the fall is not so severe, it may be due to good indirect cost control or perhaps there could be a one-off profit on disposal distorting the operating profit figure.
The relationship between the gross and the net profit percentage gives an indication of how well a company is managing its business expenses. If the net profit percentage has decreased over time while the gross profit percentage has remained the same, this might indicate a lack of internal control over expenses.
LIQUIDITY
This measures the ability of the organisation to meet its short-term financial obligations. Liquidity refers to the amount of cash a company can generate quickly to settle its debts. A reasonable level of liquidity is essential to the survival of a company, as poor cash control is one of the main reasons for business failure.
The two commonly used ratios are Current ratio and Quick ratio.
Current ratio
Current assets
Current liabilities
The current ratio compares liabilities that fall due within the year with cash balances, and assets that should turn into cash within the year. It assesses the company‘s ability to meet its short-term liabilities. The current ratio considers how well a business can cover the current liabilities with its current assets.
Therefore, this ratio compares a company‘s liquid assets (ie cash and those assets held which will soon be turned into cash) with short-term liabilities (payables/creditors due within one year). The higher the ratio the more liquid the company. As liquidity is vital, a higher current ratio is normally preferred to a lower one.
Traditionally textbooks tell us that this ratio should exceed 2.0:1 for a company to be able to safely meet its current liabilities should they fall due. However this ideal will vary from industry to industry. For example, a business in the service industry would have little or no inventory and therefore could have a current ratio of less than 1. This does not necessarily mean that it has liquidity problems so it is better to compare the result to previous years or industry averages. Many companies operate safely at below the 2:1 level.
A current ratio of less than one is often considered alarming as there might be going concern worries, but you have to look at the type of business before drawing conclusions. In a supermarket business, inventory will probably turn into cash in a stable and predictable manner, so there will always be a supply of cash available to pay the liabilities.
A very high current ratio is not necessarily good. It could indicate that a company is too liquid. Cash is often described as an ‘idle asset‗ because it earns no return, and carrying too much cash is considered wasteful. A high ratio could also indicate that the company is not making sufficient use of cheap shortterm finance and it ratio may suggest that funds are being tied up in cash or other liquid assets, and may not be earning the highest returns possible.
Quick ratio (sometimes referred to as acid test ratio)
Current assets – inventory
Current liabilities
A stricter test of liquidity is the acid test ratio (also known as the quick ratio) which excludes inventory/stock as a current asset. This approach can be justified because for many companies inventory/stock cannot be readily converted into cash. In a period of severe cash shortage, a company may be forced to sell its inventory/stock at a discount to ensure sales.
The quick ratio excludes inventory as it takes longer to turn into cash and therefore places emphasis on the business’s ‘quick assets’ and whether or not these are sufficient to cover the current liabilities. Here the ideal ratio is thought to be 1:1 but as with the current ratio, this will vary depending on the industry in which the business operates.
When assessing both the current and the quick ratios, look at the information provided within the question to consider whether or not the company is overdrawn at the year-end. The overdraft is an additional factor indicating potential liquidity problems and this form of finance is both expensive (higher rates of interest) and risky (repayable on demand).
In practice a company‘s current ratio and acid test should be considered alongside the company‘s operating cashflow. A healthy cashflow will often compensate for weak liquidity ratios.
Caution should always be exercised when trying to draw definite conclusions on the liquidity of a company, as both the current ratio and the acid test ratio use figures from the Statement of financial position. The Statement of financial position is only a ‗snapshot‘ of the financial position at the end of a specific period. It is possible that the Statement of financial position figures are not representative of the liquidity position during the year. This may be due to exceptional factors, or simply because the business is seasonal in nature and the Statement of financial position figures represent the cash position at just one particular point in the cycle.
Receivables collection period (in days)
Receivables x 365
Credit sales
The receivables/debtors collection period (in days or months) provides an indication of how successful (or efficient) the debt collection process has been. For liquidity purposes the faster money is collected the better. Therefore, it is preferable to have a short credit period for receivables as this will aid a business’s cash flow. However, some businesses base their strategy on long credit periods. When too high, it may be that some irrecoverable (bad) debts have not been provided for, or an indication of worsening credit control. It may also be deliberate, e.g. the company has decided to offer three-months’ credit in the current year, instead of two as in previous years. It may do this to try to stimulate higher sales and be more competitive than similar entities offering shorter credit periods.
If the receivables days are shorter compared to the prior period it could indicate better credit control or potential settlement discounts being offered to collect cash more quickly whereas an increase in credit periods could indicate a deterioration in credit control or potential bad debts. However, too much pressure on customers to pay quickly may damage a company‘s ability to generate sales.
Payables collection period (in days)
Payables x 365
Credit purchases*
*(or use cost of sales if purchases figure is not available)
Payable days measures the average amount of time taken to pay suppliers. Because the purchases figure is often not available to analysts external to the business, the cost of sales figure is often used to approximate purchases.
An increase in payables days could indicate that a business is having cash flow difficulties and is therefore delaying payments using suppliers as a free source of finance. If the payables‘ period is too long, it may be an indication of poor liquidity (perhaps at the overdraft limit), and there may be a danger of further or renewed credit being refused by suppliers. It is important that a business pays within the agreed credit period to avoid conflict with suppliers. If the payables days are reducing this indicates suppliers are being paid more quickly. This could be due to credit terms being tightened or taking advantage of early settlement discounts being offered.
Inventory days
Closing (or average) inventory x 365
Cost of sales
It measures how long a company carries inventory before it is sold. Therefore, the inventory/stock turnover period indicates the average number of days that inventory/stock is held for. A company needs to carefully plan and manage its inventory/stock levels. Ideally, it must avoid tying up too much capital in inventory/stock, yet the inventory/stock levels must always be sufficient to meet customer demand.
Generally the lower the number of days that inventory is held the better as holding inventory for long periods of time constrains cash flow and increases the risk associated with holding the inventory. The longer inventory is held the greater the risk that it could be subject to theft, damage or obsolescence. However, a business should always ensure that there is sufficient inventory to meet the demand of its customers. Too little inventory can result in production stoppages and dissatisfied customers.
If the holding period is long, it may be an indication of obsolete stock or poor sales achievement. Sales may have fallen (perhaps due to an economic recession), but the company has been slow to cut back on production, or an unnecessary build up of inventory levels.
A change in the inventory/stock turnover period can be a useful indicator of how well a company is doing. Inventory turnover can also be calculated using the following formula. It shows the above inventory days in terms of inventory turnover times.
Inventory turnover:
Cost of sales____________
(Average or closing) inventory
Liquidity problems may also be caused by ‘overtrading’. In some ways this is a symptom of the success of the business. It is usually a lack of adequate financing and may be solved by an injection of capital.
GEARING/ CAPITAL GEARING
Company directors often spend a great deal of time and money to make this ratio appear in line with acceptable levels.
Current and potential investors will be interested in a company‘s financing arrangements. The extent to which a company is financed by outside parties is referred to as gearing. The level of gearing in a company is an important factor in assessing risk. A company that has borrowed money obviously has a commitment to pay future interest charges and make capital repayments. This can be a financial burden and possibly increase the risk of insolvency. Most companies will be geared to some extent.
The gearing ratio measures the company‘s commitments to its long-term lenders against the long-term capital in the company. The level of gearing will be influenced by a number of factors, for example the attitude of the owners and managers to risk, the availability of equity funds, and the type of industry in which the company operates.
Its main importance is that as borrowings rise, risk increases (in many ways) and as such, further borrowing is difficult and expensive. Many companies have limits to the amount of borrowings they are permitted to have. These may be in the form of debt covenants imposed by lenders or they may be contained in a company’s Articles, such as a multiple of shareholders funds.
Measures of gearing
Gearing is basically a comparison of debt to equity. Preference shares are usually treated as debt for this purpose. There are two alternatives:
Debt or Debt
Equity Debt + equity
Also known as leverage. Capital gearing looks at the proportions of owner‘s capital and borrowed capital used to finance the business. Many different definitions exist; the two most commonly used ones are given above. When necessary in the exam, you will be told which definition to use.
A large proportion of borrowed capital is risky as interest and capital repayments are legal obligations and must be met if the company is to avoid insolvency. The payment of an annual equity dividend on the other hand is not a legal obligation. Despite its risks, borrowed capital is attractive to companies as lenders accept a lower rate of return than equity investors due to their secured positions. Also interest payments, unlike equity dividends, are corporation tax deductible.
Levels of capital gearing vary enormously between industries. Companies requiring high investment in tangible assets are commonly highly geared. Consequently, it is difficult to generalise about when capital gearing is too high. However, most accountants would agree that gearing is too high when the proportion of debt exceeds the proportion of equity.
The gearing ratio is of particular importance to a business as it indicates how risky a business is perceived to be based on its level of borrowing. As borrowing increases so does the risk as the business is now liable to not only repay the debt but meet any interest commitments under it. In addition, to raise further debt finance could potentially be more difficult and more expensive.
If a company has a high level of gearing it does not necessarily mean that it will face difficulties as a result of this. For example, if the business has a high level of security in the form of tangible non-current assets and can comfortably cover its interest payments () a high level of gearing should not give an investor cause for concern.
Interest cover
Interest cover = Profit before interest and tax
Interest
This is sometimes known as income gearing. It looks at how many times a company‘s operating profits exceed its interest payable. The higher the figure, the more likely a company is to be able to meet its interest payments. Anything in excess of four is usually considered to be safe.
As mentioned above, the interest cover ratio measures the amount of profit available to cover the interest payable by the company. The lower the level of interest cover the greater the risk to lenders that interest payments will not be met. If interest payments and capital repayments are not paid when they fall due there can be serious consequences for a company. In the event of a default, a lender may have the right to seize the assets on which the loan is secured and sell them to repay the amount outstanding. Where lenders do not have security on their loan, they could still apply to the courts for the winding up of a company so that assets can be liquidated and debts repaid.
INVESTMENT RATIOS
Earnings per share
Profit after tax and preference dividends
Number of equity shares in issue
The earnings per share ratio of a company represents the relationship between the earnings made during an accounting period (and available to shareholders) and the number of shares issued. For ordinary shareholders, the amount available will be represented by the net profit after tax (less any preference dividend where applicable).
Many investment analysts regard the earnings per share ratio as a fundamental measure of a company‘s performance. The trend in earnings per share over time is used to help assess the investment potential of a company‘s shares. However, an attempt should be made to take into account the effect of a company increasing its retained earnings. Most companies retain a significant proportion of the funds they generate, and hence their earnings per share will increase even if there is no increase in profitability.
In isolation, this ratio is meaningless for inter-company comparisons. Its major usefulness is as part of the P/E ratio, and as a measure of profit trends.
Price/earnings ratio
Market price of equity share
EPS
This is calculated by dividing a company’s market price by its EPS. Say the price of a company’s shares is $2.40, and its last reported EPS was 20c. It would have a P/E ratio of 12. The mechanics of the movement of a company’s P/E ratio are complex, but if this company’s EPS improved to 24c in the following year, it would not mean that its P/E ratio would be calculated as 10 ($2.40/24c). It is more likely that its share price would increase such that it maintained or even improved its P/E ratio. If the share price increased to say $2.88, the P/E ratio would remain at 12 ($2.88/24c). This demonstrates the real importance of EPS in the way it has a major influence on a company’s share price.
The price earnings ratio compares the benefits derived from owning a share with the cost of purchasing such a share. It provides a clear indication of the value placed by the capital market on those earnings and what it is prepared to pay for participation. It reflects the capital market assessment of both the amount and the risk of these earnings, albeit subject to overall market and economic considerations.
Earning yield
________EPS____________
Market price per equity share
This is a relatively ‘old’ ratio which has been superseded by the P/E ratio. It is in fact its reciprocal. Earnings yield is the EPS/share price x 100. In the above example, a P/E ratio of 12 would be equivalent to an earnings yield of 8.3%.
Dividend yield
Ordinary dividends appropriated in period
Market price of equity shares
This is similar to the above except that the dividend per share is substituted for the EPS. It is a crude measure of the return to shareholders, but it does ignore capital growth which is often much higher than the return for dividends.
The dividend yield compares the amount of dividend per share with the market price of a share, and provides a direct measure of the return on investment in the shares of a company. Investors are able to use this ratio to assess the relative merits of different investment opportunities.
Dividend cover
Profit after tax and preference dividends
Ordinary dividends appropriated in period
This is the number of times the current year’s dividend could have paid out of the current year’s profit available to ordinary shareholders. It is a measure of security. A high figure indicates high levels of security. In other words, profits in future years could fall substantially and the company would still be able to pay the current level of dividends. An alternative view of a high dividend cover is that it indicates that the company operates a low dividend distribution policy.
The dividend cover ratio focuses on the security of the current rates of dividends, and therefore provides a measure of the likelihood that those dividends will be maintained in the future. It does this by measuring the proportion represented by current rates of dividends of the profits from which such dividends can be declared without drawing on retained earnings. The higher the ratio, the more profits can decline without dividends being affected.
LIMITATIONS OF RATIO ANALYSIS
- It is an oversimplification of a harsh business world
- Ratios are based on highly subjective accounting figures
- Historical cost accounts do not take into account the impact of inflation
- Ratios do not make allowances for external factors: economic or political 5. Users are more interested in future prospects rather than past events
Specific problems IN FR Exam
When marking this style of question there are some common weaknesses that are identified by examiner, some of which are highlighted below:
- Limited knowledge of ratio calculations
- Appraisal not linked to scenario Poor understanding of the topic
- Limited understanding of what accounting information represents
- Lack of commercial awareness
- Discursive elements often not attempted Inability to come to a conclusion Poor English.
The majority of questions that feature performance appraisal have an accompanying scenario to the question requirement. A weak answer will make no attempt to refer to this information in the appraisal and, therefore, will often score few marks. It is important that you carefully consider this information and incorporate it into your appraisal because it has been provided for a reason. Do not simply list all the possibilities of why a ratio may have changed; link the reason to the scenario that you have been provided with.
Exam approach
In an exam there is a (time) limit to the amount of ratios that may be calculated. A structured approach is useful where the question does not specify which ratios to calculate:
- limit calculations to important areas and avoid duplication (eg inventory turnover and inventory holding periods)
- it is important to come to conclusions, as previously noted, candidates often get carried away with the ratio calculations and fail to comment on them
- often there are some ‘obvious’ conclusions that must be made (eg liquidity has deteriorated dramatically, or a large amount of additional non-current assets have been purchased without a proportionate increase in sales).