
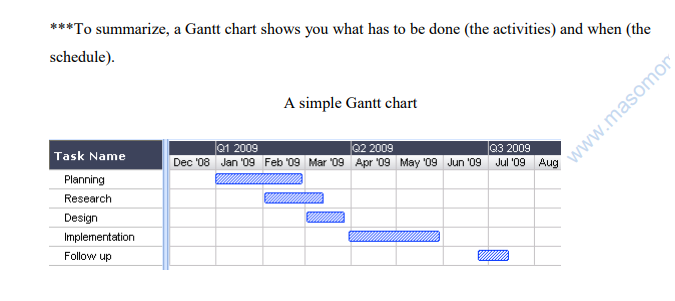
Gantt Charts outline all of the tasks involved in a project, and their order, shown against a timescale. This gives you an instant overview of a project, its associated tasks, and when these need to be finished.
It is one of the most popular and useful ways of showing activities (tasks or events) displayed against time. On the left of the chart is a list of the activities and along the top is a suitable time scale. Each activity is represented by a bar; the position and length of the bar reflects the start date, duration and end date of the activity. This allows you to see at a glance:
- What the various activities are
- When each activity begins and ends
- How long each activity is scheduled to last
- Where activities overlap with other activities, and by how much
- The start and end date of the whole project
Note:
In Gantt charts, there are three main relationships between sequential tasks:
- Finish to Start (FS) – FS tasks can’t start before a previous (and related) task is finished. However, they can start later.
- Start to Start (SS) – SS tasks can’t start until a preceding task starts. However, they can start later.
- Finish to Finish (FF) – FF tasks can’t end before a preceding task ends. However, they can end later.
Share this: