
Discovery
We have so far looked at demand and supply in the previous units. We looked at how quantity demanded and quantity supplied relate to price. We explained how each of the two changes and what happens to the curves
whenever there is a change in any of the two variables. In this unit, we shall see how interaction of demand and supply brings about a point of stability in the market where the two forces are equal. We shall also look at how a change in one or both of them affects the price in the market.
In Unit 5, we looked at how prices are determined in the market by the forces of demand and supply. Buyers meet with sellers in the market and each negotiates to satisfy his or her interest. Buyers want to maximise satisfaction at the lowest possible price. Sellers want to maximise profits by selling at the highest possible price. When the market forces are left to operate freely without any interference, there will be continuous adjustments until a point where stability is attained.
Equilibrium is a point of stability where the forces that exist tend to remain constant without any tendency to change. Equilibrium occurs when different forces acting on the centre tend to be equal. There is a balance between the two forces. In Economics, we may look at different kinds of equilibria. For instance, there is equilibrium price and equilibrium quantity, equilibrium level of national income, equilibrium of an industry, equilibrium of a firm and unemployment equilibrium.
Discovery
Equilibrium price is that price ruling in the market where quantity supplied is equal to quantity demanded. At that price, the amount of commodities brought to the market by suppliers is wholly bought by the buyers, leaving no excess or shortages in the market.
Equilibrium price and quantity occur when quantity demanded is equal to quantity supplied.
From the table in the activity above, as the price keeps increasing, buyers are willing to purchase less of the kilogrammes of meat. On the other hand, suppliers are ready to bring more and more to the market as the price increases. When the price reaches 2500 FRW for a kilogramme, the quantity demanded by buyers is equal to what is supplied by the sellers at 170 kilogrammes. At this point, the market is said to be in equilibrium.
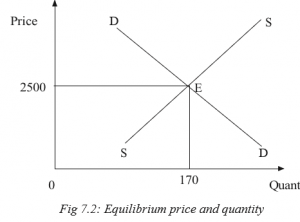
E = Equilibrium point where quantity demanded is equal to quantity supplied.
2500 = Equilibrium price.
170 = Equilibrium quantity.
At the equilibrium point (E), quantity demanded and quantity supplied are equal.
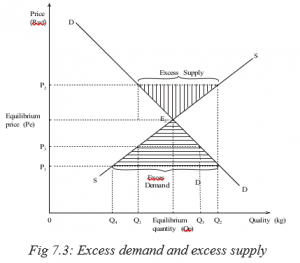
However, there could be disequilibrium where the two forces are not equal. Disequilibrium may be either a shortage (excess demand) or a surplus (excess supply).
When quantity demanded is greater than quantity supplied, then, there is a shortage of commodities in the market. In the figure 7.3, quantity demanded is Q2 but quantity supplied is Q4 at price P1. A shortage of commodities in the market implies that buyers will compete for the available few commodities. This scenario leads to an excess demand. They will be ready to pay a high price. This excess demand will lead to price increase.
When quantity supplied is greater than quantity demanded, there is a surplus of commodities in the market. In the figure 7.3, quantity demanded is Q1 while quantity supplied is Q2 at price P2. Suppliers have a lot of commodities to sell. Buyers are ready to purchase less quantities compared to what the sellers have to offer. This scenario leads to an excess supply. This excess supply of commodities will force the price to go down. Suppliers will be ready to reduce the price of their commodities so that they can attract buyers.
In the long-run, once excess demand and excess supply have been dealt with, the market will remain in a state of equilibrium
Increase in demand
Increase in demand shifts the demand curve to the right. It may be due to increase in the size of the population, increase in consumers income, government subsidising consumers, reduction in both direct and indirect taxes, reduction in the price of a complementary good, increase in the price of a substitute good, a favourable change in the buyers’ tastes and preferences, or a favourable change in seasons.
When the demand curve shifts to the right, the equilibrium is extended. This leads to an increase in the equilibrium price and equilibrium quantity.
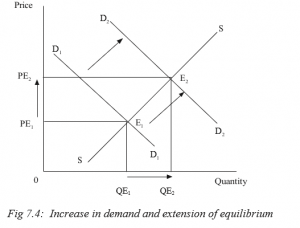
When demand increases, the demand curve shifts to the right from demand curve D1 to demand curve D2. The equilibrium point is extended from equilibrium point E1 to E2. This leads to an increase in equilibrium price from OPE1 to OPE2, and equilibrium quantity from OQE1 to OQE2.
7.3.2 Decrease in demand
A decrease in demand makes the demand curve to shift to the left. It may be due to decrease in the size of the population, decrease in consumers income, reduction in government subsidies to consumers, increase in both direct and indirect taxes, increase in the price of a complementary good, decrease in the price of a substitute good, unfavourable changes in the buyers’ tastes and preferences, or unfavourable change in seasons.
When the demand curve shifts to the left, the equilibrium is contracted. This leads to a decrease in the equilibrium price and the equilibrium quantity.
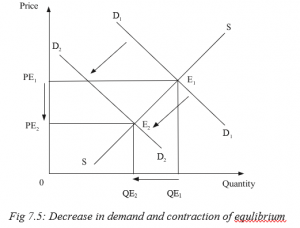
When demand decreases, the demand curve shifts to the left from demand curve D1 to demand curve D2. The equilibrium point is contracted from equilibrium point E1 to E2. This leads to decrease in equilibrium price from OPE1 to OPE2, and equilibrium quantity from OQE1 to OQE2.
7.3.3 Increase in supply
Increase in supply shifts the supply curve to the right. This will lead to increase in the equilibrium quantity and decrease in the equilibrium price.
An increase in supply of a commodity may be brought about by an increase in the number of producers, improvement in technology, entry of new firms into the industry, decrease in taxes on producers which reduces their production costs, favourable natural factors, increase in demand for the commodity, change in goals of the firm, decrease in prices of factors of production, or increase in price of jointly supplied commodities.
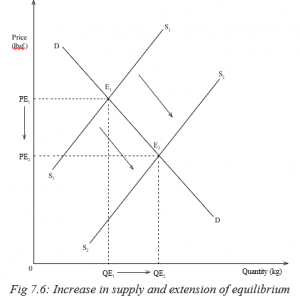
When supply increases, the supply curve shifts to the right from S1 to S2. Similarly, the equilibrium point is extended from E1 to E2. This leads to increase in equilibrium quantity from OQE1 to OQE2 and a decrease in equilibrium price from OPE1 to OPE2.
7.3.4 Decrease in supply
Decrease in supply shifts the supply curve to the left. The equilibrium point contracts to the left. This will lead to decrease in the equilibrium quantity and increase in the equilibrium price.
A decrease in supply of a commodity may be brought about by a decrease in the number of producers, decline in technology, exit of new firms from the industry, increase in taxes on producers which increases their production costs, unfavourable natural factors, decrease in demand for the commodity, change in goals of the firm, increase in prices of factors of production, or decrease in price of jointly supplied commodities.
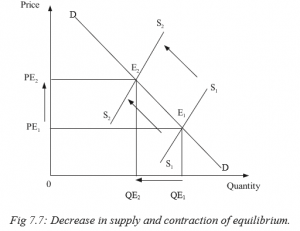
When supply decreases, the supply curve shifts to the left from S1 to S2. Similarly, the equilibrium point contracts from E1 to E2. This leads to a decrease in equilibrium quantity from OQE1 to OQE2 and an increase in equilibrium price from OPE1 to OPE2.
7.3.5 Change in demand and supply by the same margins
When both demand and supply change by the same margins and in the same direction, the equilibrium point changes. However the equilibrium price remains almost the same. The equilibrium quantity either increases or decreases.
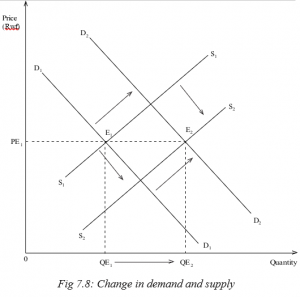
Due to the factors that influence both variables, the two may change by either increasing or decreasing. If the two change in the same direction and by the same degree, the equilibrium price remains constant.
When demand increases from D1 to D2 and supply changes from S1 to S2, the equilibrium point extends from E1 to E2. The equilibrium quantity increases from OQE1 to OQE2 but the equilibrium price remains constant at OPE1.
Recall
In a market place, different people with different backgrounds, behaviour, character, and interests meet as either buyers or sellers. In this era of HIV/ AIDS which advice can you give to such congregation as an Economics student?