

Assumed knowledge
2 builds on the following knowledge from other exams:
| PM | SBL | ||
| Risk and uncertainty including: | | Stakeholders | |
| | expected values (EVs) | | Porter’s 5 forces and PEST |
| | maximax | ||
| | maximin | ||
| | minimax regret | ||
2 Introduction
This focuses on Sections A and B of the syllabus. All organisations will be impacted by the environment in which they operate and it is imperative that they consider the effect that factors such as risk, government regulations and social/ethical issues will have on performance.
3 External analysis
3.1 Introduction
As mentioned above, it is important that an organisation considers the impact of external factors on its performance. The organisation can use two different models when considering this impact. Each model focuses on a different level in the external environment.

External analysis forms an important part of the ‘strategic analysis’ stage of the strategic planning process (as reviewed in 1).
3.2 PEST analysis
The PEST model looks at the macro-environment and its influence on organisational performance, using the following headings:
| Heading | Examples | |||
| Political factors | | Taxation policy | ||
| | Government stability | |||
| | Foreign trade regulations | |||
| | Taxation | |||
| | Employment law | |||
| | Monopoly legislation | |||
| | Environmental protection legislation | |||
| Economic factors | | Interest rates | ||
| | Inflation | |||
| | Unemployment | |||
| | Business cycles | |||
| Social factors | | Population demographics | ||
| | Social mobility | |||
| | Income distribution | |||
| | Lifestyle changes | |||
| 71 | ||||
| | Attitudes to work and leisure | |
| | Levels of education and consumerism | |
| | How to produce goods with minimal | |
| environmental damage | ||
| Technological factors | | Speed of technological transfer |
| | Rates of obsolescence | |
(Note: This model is sometimes referred to as PESTEL. The additional ‘E’ is for environmental factors (included as part of social factors in PEST) and the additional ‘L’ is for legal factors (included as part of political factors in PEST)).
The key issue in APM is to appreciate that, as well as being used for strategic analysis, this model can be used to identify key performance management issues. For example:
- PEST analysis can assist in the identification of relevant CSFs and the development of KPIs linked to these. For example, an organisation may decide to source supplies from politically stable countries or may adapt its product portfolio to reflect social factors such as a change in consumer tastes.
- Changes in the macro environment may result in the revision of KPIs and the targets based around these KPIs.
- Risk and uncertainty in the macro environment can be identified and monitored and action can be taken to manage it.
Illustration 1 – PEST and performance management
PEST can be used to identify key performance management issues:
Identifying CSFs and KPIs
Current trends have indicated that British consumers have moved towards ‘one -stop’ and ‘bulk’ shopping which is due to a variety of social changes. As a result, supermarkets such as Tesco have increased the amount of non-food items for sale. This may be seen as a CSF and necessary to meet the needs of the modern customer. Tesco may develop KPIs around this CSF, for example by measuring the number or proportion of non-food items for sale in each store.
Revising targets
Increasing public concern for the natural environment has resulted in many supermarkets setting targets for say, wastage, recycling and energy efficiency. These targets may need revising if the external environment changes. For example, in the UK it was recently reported that more than two thirds of the bagged salad sold by Tesco ends up being thrown away. As a result of this investigation, Tesco (and a number of other retailers) have put more stringent wastage targets in place, recognising that performance would deteriorate if no action was taken.
PEST analysis and performance measurement
Environmental legislation may have been identified as being particularly important to a chemicals producer, in which case it should set up a series of targets to measure compliance. For example:
- level of fines
- number of environmental prosecutions
- number of environmental enforcement actions
- number of ‘notifiable’ incidents (local legislation will define what is ‘notifiable’ and what is not)
- percentage of employees working within an ISO 14001 compliant Environmental Management System
- the firm’s rating in independent benchmarking such as the ‘Business in the Environment’ Index.
3.3 Porter’s 5 forces model
The level of competition in the industry can also affect an organisation’s performance. All businesses in a particular industry are likely to be subject to similar pressures that determine how attractive the sector is. Industry attractiveness depends on five factors or forces:

The stronger each of the five forces is, the lower the profitability of the industry.
Porter’s 5 forces
- Competitive rivalry: There will be a tough environment if there are many competitors but a much easier one if there is a monopoly.
- Buyer’s bargaining power: A few, large customers can exert powerful bargaining power. Many, small customers find it harder to apply pressure.
- Supplier’s bargaining power: A monopoly supplier of a vital component can apply great pressure. Any one of many suppliers of an ordinary component cannot.
- Threat from potential entrants: The key issue here is to assess barriers to entry. For example, high capital costs, know-how and regulation of all present barriers to entry which will help to reduce competition.
- Threat from substitutes: The level of the threat is determined by relative price/performance.
Porter’s 5 forces and performance management
Porter’s 5 forces model can be used for strategic analysis and can also be used to identify key performance management issues.
When conducting a 5 forces assessment an organisation should consider:
- how to measure the strength of the forces
- how reliable those measurements are
- how to manage the forces identified to optimise organisational performance. The organisation should:
– avoid business sectors which are unattractive because of the 5 forces
– try to mitigate the effects of the 5 forces. For example, supplier power is lessened if a long-term contract is negotiated or competition is reduced by taking over a rival.
- suitable performance indicators to monitor the forces.
It is important that an organisation considers its performance in the context of its industry. For example, rising supplier prices may initially be blamed on an inefficient purchasing function. However, on further investigation it may be found that the industry is supplied by a relatively small number of large suppliers who have the power to increase prices.
Illustration 2 – Supplier’s bargaining power
In 2016, the supermarket giant, Tesco, and the UK’s largest food manufacturer, Unilever, became locked in a battle over wholesale prices. A fall in the value of UK Sterling as a result of the UK’s decision in 2016 to leave the European Union left suppliers such as Unilever with higher costs for imported goods.
As a result, Unilever had wanted to raise its prices by 10%. However, Tesco refused to pay the additional amount resulting in Unilever exercising their power and halting supply. Unilever, recognising the importance of its income stream from Tesco, did eventually compromise ensuring much loved brands such as Persil washing powder and Marmite spread were fully available on Tesco’s shelves again.
As part of its strategic performance evaluation, a business could assess the strength of the forces it is facing using suitable metrics:
| Threat | Possible metrics | |
| Threat from potential entrants | | Brand value |
| | Customer loyalty | |
| | % of revenue protected by patents | |
| Competitive rivalry | | Market share |
| | Market growth | |
| | Market capacity | |
| Threat from substitutes | | Price of substitutes |
| | Quality/performance of substitutes | |
| Buyers’ bargaining power | | Number of buyers |
| | Size of buyers | |
| | Switching costs | |
| | Elasticity of demand | |
| Suppliers’ bargaining power | | Number of suppliers |
| | Size of suppliers | |
| | Switching costs | |
| | Quality/price of suppliers used. | |
Test your understanding 1
PEST and Porter’s 5 forces model
In the United Kingdom (UK), railways are facing major challenges. Customers are complaining about poor services. The government is reluctant to spend vast amounts of public money on developing the decaying infrastructure. The inflated costs of commuting by car, such as fuel and congestion charges, are increasing the number of people wanting to use the railways.
Required:
Use PEST and Porter’s 5 forces to identify the issues in the external environment and discuss the impact of these factors on the performance of the railways in the UK.
4 The impact of stakeholders
4.1 Introduction
A stakeholder of an organisation is anyone affected by the organisation.

The mission and objectives of an organisation need to be developed with the needs of the stakeholders in mind.
4.2 Stakeholders’ influence on business performance
- The interest and power of different stakeholder groups can affect an organisation’s performance. A stakeholder isn’t simply any party that is affected by the organisation but they can also have a huge influence on organisational performance. This is explored in more detail in the discussion of ‘stakeholder mapping’ below.
- In addition, the interests of different stakeholder groups might affect the areas of performance that are measured.
Illustration 3 – Stakeholders’ influence
The airline, Ryanair, has regular labour relations problems with pilots, cabin attendants and check -in staff. For example, in 2017 pilots at Ryanair threatened a mass strike (and possible desertion to a competitor airline) if there were not significant improvements in pay and conditions. Ryanair cannot operate without these staff so these employees have great power and have shown that they are happy to exercise that power.
Illustration 4 – Strategic planning and stakeholder needs
When planning, management has to take into account stakeholder requirements, power and ambition. For example, there is no point devising changes to production methodologies if:
- employees will not be prepared to adapt to them
- customers do not like the quality of what is offered
- suppliers cannot supply parts at the required frequency.
4.3 Stakeholder mapping
Mendelow’s matrix looks at the level of power and interest of different stakeholder groups.
Managers can make use of Mendelow’s matrix to help manage stakeholders’ conflicting demands and to establish its priorities in terms of managing stakeholders’ expectations.

Mendelow’s matrix
- Key players: These stakeholders are the major drivers of change and could stop management plans and hinder success if not satisfied. Their participation in the planning process is vital.
- Keep satisfied: These stakeholders have high power and need to be reassured of the outcome of the strategy well in advance to stop them from gaining interest and negatively impacting business performance.
- Keep informed: These stakeholders are interested in the strategy but lack power. Managers must justify their plans to these stakeholders. Otherwise they will gain power by joining forces with other stakeholders.
- Minimal effort: These stakeholders lack interest and power and are more likely than others to accept what they are told and follow instructions.
Test your understanding 2
Chatman Theatre is a charitable trust with the objective of making multicultural films and stage productions available to a regional audience. The organisation is not for profit. The aim is to bring diversity of films, plays and dance that would otherwise be inaccessible to a regional audience.
The theatre needs to have strict budget focus, since a charity can become bankrupt. In order to achieve the required income, relationships must be built with a range of stakeholders.
Required:
Identify a few key stakeholders and ideas that would assist in building relationships and hence improving performance.
4.4 Stakeholder conflict
Stakeholders’ requirements and aspirations often conflict:
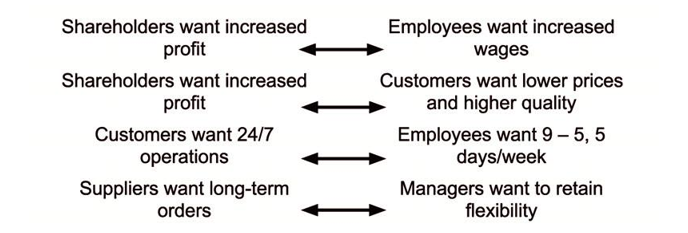
Unless these conflicts are managed, performance will be affected.
Resolving conflicting objectives (Cyert and March)
Management can seek to manage conflicting objectives through the following:
- Prioritisation
- Negotiation and ‘satisficing’
- Sequential attention
- Side payments
- Exercise of power.
Resolving conflicting (Cyert and March)
Prioritisation – this could follow from Mendelow’s matrix above.
Negotiation and ‘satisficing’ – finding the minimum acceptable outcome for each group to achieve a compromise.
Sequential attention – each period a different stakeholder group is focused upon, e.g. the workers’ canteen could be updated this year with the implication that employees should not expect any improvements in working conditions for the next few years.
Side payments – this can often involve benefiting a group without giving them what they actually want, e.g. the local community may be concerned with cuts in jobs and increased pollution but the firm seeks to placate them by building new sports facilities and sponsoring a local fete.
Exercise of power– when a deadlock is resolved by a senior figure forcing through a decision simply based on the power they possess.
Test your understanding 3
The trustees of a museum are faced with the following conflicting objectives:
- to educate the public
- to preserve antiquities for study and research.
Required:
Give two examples of policies that would be affected by the prioritisation of these objectives.
5 The impact of ethical issues
5.1 Ethics
- Ethics is a set of moral principles that guide behaviour, based on what is ‘felt’ to be right.
- Comprises principles and standards that govern business behaviour.
- Actions can be judged to be right or wrong, ethical or unethical by individuals inside or outside the organisation.
For example, is it ethical to:
- experiment on animals?
- drill for oil?
- build roads through the countryside?
- allow smoking in public areas?
- pay senior executives large increases in salary?
- train students to pass exams?
Illustration 5 – Nestle and Ethics
Nestle was criticised in the past for taking advantage of the poor and uneducated populations in developing countries in order to increase their own profits.
The company gave gifts and incentives to local health officials, as encouragement in promoting their baby milk formula and therefore discouraging breast feeding. Nestle employees were heard telling midwives that ‘all western women use formula to feed their babies, so that they grow up big and strong’.
Nestle didn’t educate mothers about sterilising bottles and therefore mothers mixed the formula with dirty water at the cost of many babies’ health. The free samples provided to mothers in hospitals and clinics soon dried up and mothers then had to pay almost western prices for the baby milk formula, a price that most families could not afford.
Ethics and performance management
Apart from any moral duty to be ethical, the prime purpose of a business is to maximise shareholder wealth and the chance of this happening is increased by the adoption of ethical behaviour.
Test your understanding 4
Required:
How can the adoption of ethical behaviour by an organisation help to assist to maximise shareholder wealth?
5.2 Corporate social responsibility
Corporate social responsibility (CSR) refers to the idea that a company should be sensitive to the needs of all stakeholders in its business operations and not just shareholders. As such, ethics is just one dimension of corporate social responsibility.
CSR and performance management
By aligning the company’s core values with the values of society, the company can improve its reputation and ensure it has a long term future.
Benefits of a CSR strategy
- Differentiation – the firm’s CSR strategy can act as a method of differentiation.
- High calibre staff will be attracted and retained due to the firm’s CSR policies.
- Brand strengthening – due to the firm’s honest approach.
- Lower costs – can be achieved in a number of ways, e.g. due to the use of less packaging or energy.
- The identification of new market opportunities and of changing social expectations.
- An overall increase in profitability as a result of the above – project.
- NPVs will increase due to increased sales, lower costs, an extended project life and a lower level of risk.
Test your understanding 5
Required:
Many commentators believe that CSR is a morally correct pursuit, but there are powerful arguments against it. Identify and discuss these arguments.
CSR and metrics
It is really important for the organisation to have some clear goals in mind with regards to its CSR strategy.
Remember, things that get measured get done more often than things that are not measured. Therefore, the company should measure the result of any CSR programme using appropriate metrics.
Test your understanding 6
RFG has set up manufacturing plants in many developing countries, some of which have much lower legislation standards regarding health and safety than RFG’s target markets. To improve its global reputation, the firm wishes to improve its performance for health and safety.
Required:
Suggest some metrics for measuring health and safety.
6 Political climate
6.1 Introduction
This area was introduced when we looked at PEST. However, it will now be explored in more detail
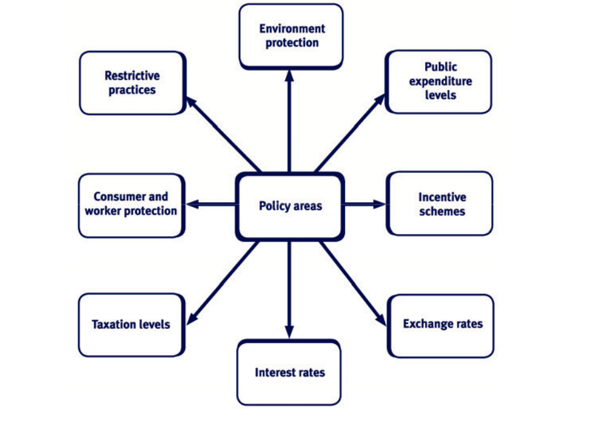
Test your understanding 7
Required:
Give some examples of areas of government policy that are likely to affect a multinational electronics company and how the impact will be felt?
Porter’s view
The influence of government on an industry
Porter identifies seven ways in which a government can affect the structure of an industry.
- Capacity expansion. The government can take actions to encourage firms or an industry as a whole to increase or cut capacity. Examples include capital allowances to encourage investment in equipment; regional incentives to encourage firms to locate new capacity in a particular area, and incentives to attract investment from overseas firms. The government is also (directly or indirectly) a supplier of infrastructure such as roads and railways, and this may influence expansion in a particular area.
- The government is a major customer of business in all areas of life and can influence demand by buying more or less. It can also influence demand by legislative measures. The tax system for cars is a good example: a change in the tax relief available for different engine sizes has a direct effect on the car manufacturers’ product and the relative numbers of each type produced. Regulations and controls in an industry will affect the growth and profits of the industry, for example minimum product quality standards.
- Divestment and exit. A firm may wish to sell off a business to a foreign competitor or close it down, but the government might prevent this action because it is not in the public interest (there could be examples in health, defence, transport, education, agriculture and so on).
- Emerging industries may be controlled by the government. For instance governments may control numbers of licences to create networks for next generation mobile phones.
- Entry barriers. Government policy may restrict investment or competition or make it harder by use of quotas and tariffs for overseas firms. This kind of protectionism is generally frowned upon by the World Trade Organisation, but there may be political and economic circumstances in which it becomes necessary.
- Competition policy. Governments might devise policies which are deliberately intended to keep an industry fragmented, preventing one or two producers from having too much market share.
- New product adoption. Governments regulate the adoption of new products (e.g. new drugs) in some industries. They may go so far as to ban the use of a new product if it is not considered safe (a new form of transport, say). Policies may influence the rate of adoption of new products, e.g. the UK government ‘switch off’ of the analogue television networks by 2012, effectively forcing users to buy digital cable or satellite services.
Legislation and regulation
Strategic planners cannot plan intelligently without a good working knowledge of the laws and regulations that affect their own companies and the businesses they operate in.
- There is an almost endless list of laws, or categories of legislation, that affect business enterprises in domestic, national or international dimensions. The main categories are listed below:
– local by-laws (for example planning permission, construction of roads, licences)
– labour legislation (such as safety at work, employee protection, redundancy payments)
– trade union legislation
– consumer protection legislation
– company legislation
– taxation legislation
– anti-trust (monopolies) legislation and rulings
– trade legislation (e.g. countries restricted for export) – business legislation (e.g. contract and agency law) – social legislation such as welfare benefits.
- At a more general level, laws are passed that enable government to levy taxes which will have an impact both on demand and the organisation’s profits.
- There are special regulatory regimes for particular industries or sectors, such as nuclear energy, transport, broadcasting or food.
- Legislation is becoming more complex, particularly for those companies that trade internationally where the interface, indeed probable conflict, between domestic laws, the host country’s laws, and probably also the laws of the trading block of nations the host country belongs to, provides an extremely complicated legal scenario.
Government and the public sector
In public sector organisations the government is the major stakeholder.
This can have a number of particular impacts:
- the motivation to meet customer needs may be reduced
- the consequences of failure to provide an appropriate level of service for the organisation and the individual are reduced
- being dependent on government policy also means that objectives may change rapidly as policy changes and this political dimension reduces the scope of management options and increases the time for decisions to be taken
- when the public sector companies are privatised they may still remain subject to elaborate regulatory regimes. The performance of the operations involved is monitored and measured using various indicators, with the possibility of fines for poor performance or price restrictions imposed by regulators.
Planning for political change
The problem facing strategic planners is how to plan for changes in the political environment. It is necessary to consider what type of political change could affect the enterprise rather than trying to estimate all the political changes that might occur, by:
- examining changes in social behaviour and values, economic activity, and problems arising from the physical infrastructure or environment which can be related to the trend of political actions
- monitoring indicators of possible or intended future government actions and policy. These indicators are obtained from:
– annual conferences of political parties
– public utterances of party leaders and seniors – international events
– directives from international trading groups – political commentators and analysts
– international summit meetings
– staged legislation
– efforts of public pressure groups (particularly with regard to local government policy)
– political manifestos.
6.2 The impact of fiscal policy and monetary policy
Fiscal and monetary policies are the tools used by governments to control their economies.
Fiscal policy
- Looks at the balance between government income (taxation + borrowing) and expenditure.
Monetary policy
- Is the process by which the government and central bank controls the supply, availability and cost of money.
| Fiscal policy | Monetary policy | ||
| Government adjusts: | Government adjusts: | ||
| | taxation | | money supply |
| | public borrowing | | interest rates |
| | public spending. | | exchange rates |
| | availability of credit. | ||
Fiscal and monetary policy – more details Fiscal policy

- To stimulate the economy, the government can spend more money. However, if the extra expenditure is met by raising taxes, the public will have less to spend and economic growth will be small. To really get things moving, the government needs to borrow and spend.
- The economy can also be stimulated by cutting tax and allowing individuals to spend more. If government expenditure is cut to match the tax cuts, there will be little stimulation, so government borrowing is needed to keep government spending high.
- Too much economic stimulation is likely to cause inflation as consumers compete for resources and services.
Monetary policy
Changes in monetary policy will influence the following factors:
- The availability and cost of finance. These in turn affect the level of investment and expenditure by firms.
- The level of consumer demand e.g. low interest rates will stimulate the economy as it is cheaper to borrow and savings do not earn a lot of interest. Similarly, the easy availability of credit also encourages borrowing and spending).
- The level of inflation.
- The level of exchange rates.
Impact of macroeconomics
In order for macroeconomic policy to work, its instruments must have an impact on economic activity. This means that it must affect the business sector. It does so in two broad forms.
| Macroeconomic policy | | The level of AD is central to the | ||||||
| will influence the level | determination of the level of | |||||||
| of aggregate demand | unemployment and the rate of inflation. | |||||||
| (AD) and thus activity | | If AD is too low, unemployment might | ||||||
| in the economy as a | ||||||||
| result; if AD is too high, inflation | ||||||||
| whole. | ||||||||
| induced by excess demand might | ||||||||
| (AD is the total demand | result. | |||||||
| for goods and services | | Changes in AD will affect all | ||||||
| in the economy.) | ||||||||
| businesses to varying degrees. Thus | ||||||||
| effective business planning requires | ||||||||
| that businesses can: | ||||||||
| – | predict the likely thrust of | |||||||
| macroeconomic policy in the | ||||||||
| short to medium-term | ||||||||
| – | predict the consequences for | |||||||
| sales growth of the overall stance | ||||||||
| of macroeconomic policy and any | ||||||||
| likely changes in it. | ||||||||
| | The more stable government policy is, | |||||||
| the easier it is for businesses to plan, | ||||||||
| especially in terms of investment, | ||||||||
| employment and future output | ||||||||
| capacity. | ||||||||
| Macroeconomic policy | | Macroeconomic policy may involve | ||||||
| may influence the | changes in exchange rates. This can | |||||||
| costs of the business | have the effect of raising the domestic | |||||||
| sector. | price of imported goods. Most | |||||||
| businesses use some imported goods | ||||||||
| in the production process; hence this | ||||||||
| leads to a rise in production costs. | ||||||||
| | Fiscal policy involves the use of | |||||||
| taxation: changes in tax rates or the | ||||||||
| structure of taxation will affect | ||||||||
| businesses. For example, a change in | ||||||||
| the employer’s national insurance | ||||||||
| contribution will have a direct effect on | ||||||||
| labour costs for all businesses. | ||||||||
| Changes in indirect taxes (for example, | ||||||||
| a rise in sales tax or excise duties) will | ||||||||
| either have to be absorbed or the | ||||||||
| business will have to attempt to pass | ||||||||
| on the tax to its customers. | ||||||||
| 87 | ||||||||
- Monetary policy involves changes in interest rates; these changes will directly affect firms in two ways:
– costs of servicing debts will change especially for highly geared firms
– the viability of investment will be affected since all models of investment appraisal include the rate of interest as one, if not the main, variable.
Test your understanding 8
Required:
A carpet retailer imports carpets and sells them domestically. The domestic currency does not have a fixed exchange rate with any other currency. What are the likely effects on this business of a rise in domestic interest rates?
Test your understanding 9
Suppose the two main political parties in a hypothetical country have the following priorities:
| Party A | Party B | ||||
| (currently in government) | (the opposition) | ||||
| Priorities | | Low unemployment | | Low inflation | |
| Policy | | Fiscal policy | | Monetary policy | |
| choices | | Increase government | | Increase interest rates | |
| spending to boost | to reduce inflation | ||||
| demand to create jobs | | Low taxes | |||
| | High government | ||||
| | Low levels of | ||||
| intervention in | |||||
| intervention | |||||
| business | |||||
Recent polls suggest that Party B could win the next election.
Required:
Comment on the implications of this for a major construction company based in the country concerned.
6.3 Supply-side policies
- Supply-side economists take the view that the supply of suitable, cost-effective and adequate materials, services and labour is vital to an economy.
- If these resources are made available, then they will be used to produce goods and services.
- The amounts paid to suppliers and employees will create the extra income necessary to buy the extra outputs.
- For example, improving education would increase the supply of educated workers in the workforce.
Supply side policies examples
Supply-side policies are therefore largely anti-regulation and anti-government interference. For example, supply-side economists would claim that:
- wage regulation prevents the labour market from achieving full employment
- government grants encourage weak businesses
- employment legislation limits risk taking and can lead to over manning of industries
- high taxes act as a disincentive to work and enterprise and lead ultimately to lower output, employment and wealth.
6.4 Green policies/externalities
A negative externality is the cost of production experienced by society but not by producers or consumers themselves, for example:
- production, e.g. river pollution from manufacturing
- consumption, e.g. car emissions causing air pollution.
As a result, the government may impose green policies, e.g. an increase in tax on fuel.
7 Risk and uncertainty
7.1 Introduction
Strategic planning deals with future events but these future events cannot always be accurately predicted. Planning must therefore take risk and uncertainty into account.
Risk is the variability of possible returns. There are a number of possible outcomes and the probability of each outcome is known.
Uncertainty also means that there are a number of possible outcomes.
However, the probability of each outcome is not known.
Exogenous variables are variables that do not originate from within the organisation itself and are not controllable by management,
e.g. government policy, weather conditions, state of the economy, competitors’ actions etc. Their existence means that strategic planning will always be subject to some risk and uncertainty.
All businesses face risk/uncertainty. Risk management is the process of understanding and managing the risks that an organisation is inevitably subject to.
The impact of exogenous variables
A hospital has developed a new surgical technique as a more expensive alternative to existing treatments. It is considering whether to begin to provide the treatment to all its patients, which would mean building a new facility. In order to inform the decision, the hospital is considering the likely effect of a number of variables.
- The likelihood that another alternative cheaper treatment, either a surgical technique or a drug regime, will be discovered.
- The likelihood that other hospitals will begin to offer similar services which will limit demand.
- Government policy – changes in the way that treatment is funded and therefore whether the costs of the treatment will be paid for.
7.2 Dealing with risk/uncertainty
A number of tools can be used to incorporate the impact of risk/uncertainty.
| Tool | Explanation | |||
| Scenario planning | Looks at a number of different but plausible future | |||
| situations. For example, Shell was the only major | ||||
| oil company to have prepared for the shock of the | ||||
| 1970s oil crisis through scenario planning and was | ||||
| able to respond faster than its competitors. | ||||
| Computer simulations | A modelling technique which shows the effect of | |||
| more than one variable changing at a time and | ||||
| gives management a view of the likely range and | ||||
| level of outcomes so that a more informed decision | ||||
| can be taken. | ||||
| Sensitivity analysis | Takes each uncertain factor in turn, and calculates | |||
| the change that would be necessary in that factor | ||||
| before the original decision is reversed. | ||||
| 90 | ||||
| Expected values (EVs) | Shows the weighted average of all possible |
| outcomes. | |
| Maximax, maximin and | Three different tools for incorporating |
| minimax regret | risk/uncertainty. The attitude of management |
| towards risk will determine which of the three tools | |
| is used. | |
EVs and maximin, maximax and minimax regret will be explored in more detail below:
7.3 Expected values (EVs)
The expected value is the average return that will be made if a decision is repeated again and again.
Each of the possible outcomes is weighted with their relative probability of occurring. It is the weighted arithmetic mean of the outcomes.
The formula for expected values is: EV = ∑px
where: x = the value of the possible outcome
p = the probability of the possible outcome.
Illustration 6 – Simple EV calculation
Returns from a new restaurant depend on whether a company decides to open in the same area. The following estimates are made:
| Competitor opens up | Probability | Project NPV | px | |||
| (p) | (x) | |||||
| Yes | 0.30 | ($10,000) | ($3,000) | |||
| No | 0.70 | $20,000 | $14,000 | |||
| ––––––– | ||||||
| $11,000 |
The EV = ∑px = $ 11,000. Since the expected value shows the long run average outcome of a decision which is repeated time and time again, it is a useful decision rule for a risk neutral decision maker. This is because a risk neutral decision maker neither seeks nor avoids risk; he is happy to accept the average outcome.
Pay-off (profit) tables
A pay-off (profit) table is useful for calculating EVs when there is a range of possible outcomes and a variety of possible responses.
Illustration 7 – Simple pay-off (profit) table
Geoffrey Ramsbottom runs a kitchen that provides food for various canteens throughout a large organisation. A particular salad generates a profit of $2 based on a selling price of $10 and a cost of $8. Daily demand is as follows:
| Demand | Probability |
| 40 salads | 0.10 |
| 50 salads | 0.20 |
| 60 salads | 0.40 |
| 70 salads | 0.30 |
| ––––– | |
| 1.00 |
Required:
The kitchen must prepare the salad in batches of 10. Its staff have asked you to help them decide how many salads it should supply per day.
Answer:
There are a range of possible outcomes (levels of demand) and a variety of possible responses (number of salads to supply) and therefore it is useful to construct a payoff table:
| Daily supply profit/(loss) outcome (x) | |||||
| Daily | Prob | 40 | 50 | 60 | 70 |
| demand | (p) | salads | salads | salads | salads |
| 40 salads | 0.10 | $80 (W1) | $0 | ($80) | ($160) |
| 50 salads | 0.20 | $80 | $100 | $20 | ($60) |
| 60 salads | 0.40 | $80 | $100 | $120 | $40 |
| 70 salads | 0.30 | $80 | $100 | $120 | $140 |
| ——— | ——— | ——— | ——— | ||
| EV = | $80 | $90 | $80 | $30 (W2) | |
| ——— | ——— | ——— | ——— | ||
Workings:
W1 Profit is calculated as follows = 40 salads × $2 = $80
W2 EV is calculated as follows = (0.10 × –$160) + (0.20 × –$60) + (0.40 × $40) + (0.30 × $140) = $30
Conclusion:
Therefore, based on EVs, daily supply should be 50 salads since this yields the highest expected value of $90.
In the illustration above, there was only one variable outcome, i.e. the level of demand. However, in some situations there may be more than one variable outcome, for example demand and inflation. In this case, a two way data table should be prepared before the EV is calculated.
Test your understanding 10
Confused Company is seeking to establish the likely profit to be generated for the forthcoming year. This is very much dependent upon the anticipated demand, and the impact of inflation upon the fixed costs of the business.
Probabilities have been estimated for both demand and inflation as shown below:
| Demand | Probability | Inflation | Probability |
| Strong | 0.20 | None | 0.30 |
| Normal | 0.50 | 2% | 0.50 |
| Weak | 0.30 | 4% | 0.20 |
A two way data table has been prepared which estimates the changes in net profit (in $) for a range of changes in demand and inflation:
| Inflation | |||||
| None | 1% | 2% | 3% | 4% | |
| Demand Strong | 95,000 | 85,000 | 75,000 | 65,000 | 55,000 |
| Normal | 60,000 | 50,000 | 40,000 | 30,000 | 20,000 |
| Weak | 25,000 | 15,000 | 5,000 | (5,000) | (15,000) |
Required:
Prepare a summary that shows:
- the range of possible net profit and loss outcomes
- the combined probability of each outcome
- the expected value of the profit for the year.
Management will be awarded a bonus if profit exceeds $50,000. What are the chances of this occurring?
Usefulness of EVs
Since the expected value shows the long-run average outcome of a decision which is repeated again and again, it is a useful decision tool for a risk neutral decision maker. This is because a risk neutral person neither seeks risk nor avoids it; they are happy to accept an average outcome. This technique would not be useful:
- for decisions which occur only once (the EV is the average and not an actual outcome)
- if the probabilities and/ or the values of the various outcomes are unknown or uncertain
- for a non-risk neutral decision maker.
7.4 Maximax, maximin and minimax regret
The maximax rule looks at the best possible outcome for each course of action and selects the alternative that maximises the maximum pay-off achievable.
The maximin rule looks at the worst possible outcome for each course of action and selects the alternative that maximises the minimum pay-off achievable.
The minimax regret looks at the maximum regret (opportunity cost) for each course of action and aims to choose the strategy that minimises the maximum regret.
Illustration 8 – Geoffrey Ramsbottom
Required:
Using the information from illustration 7 decide how many salads should be supplied per day using:
- the maximax rule
- the maximin rule
- the minimax regret rule.
Answer:
- Maximax
| Daily supply profit/(loss) outcome (x) | ||||||
| Daily | Prob (p) | 40 | 50 | 60 | 70 | |
| demand | salads | salads | salads | salads | ||
| 40 salads | 0.10 | $80 | $0 | ($80) | ($160) | |
| 50 salads | 0.20 | $80 | $100 | $20 | ($60) | |
| 60 salads | 0.40 | $80 | $100 | $120 | $40 | |
| 70 salads | 0.30 | $80 | $100 | $120 | $140 | |
| ——— | ——— | ——— | ——— | |||
| Maximum profit = | $80 | $100 | $120 | $140 | ||
| ——— | ——— | ——— | ——— | |||
The maximax rule involves selecting the alternative that maximises the maximum pay-off achievable. Looking at the table above, the maximum profit achievable is $140. This will be achieved if 70 salads are supplied.
- Maximin
| Daily supply profit/(loss) outcome (x) | ||||||
| Daily | Prob (p) | 40 | 50 | 60 | 70 | |
| demand | salads | salads | salads | salads | ||
| 40 salads | 0.10 | $80 | $0 | ($80) | ($160) | |
| 50 salads | 0.20 | $80 | $100 | $20 | ($60) | |
| 60 salads | 0.40 | $80 | $100 | $120 | $40 | |
| 70 salads | 0.30 | $80 | $100 | $120 | $140 | |
| ——— | ——— | ——— | ——— | |||
| Minimum profit = | $80 | $0 | ($80) | ($160) | ||
| ——— | ——— | ——— | ——— | |||
The maximin rule involves selecting the alternative that maximises the minimum pay-off achievable. Looking at the table above, the maximum of the minimum profits is $80. This will be achieved if 40 salads are supplied.
- Minimax regret
The minimax regret strategy is the one that minimises the maximum regret (opportunity cost). A regret table should be used:
| Daily supply regret (opportunity cost) | ||||
| Daily demand | 40 salads | 50 salads | 60 salads | 70 salads |
| 40 salads | Right | $80 (W1) | $160 (W1) | $240 (W1) |
| decision | ||||
| 50 salads | $20 | Right | $80 | $160 |
| decision | ||||
| 60 salads | $40 | $20 | Right | $80 |
| decision | ||||
| 70 salads | $60 | $40 | $20 | Right |
| decision | ||||
| —— | —— | —— | —— | |
| Maximum regret = | $60 | $80 | $160 | $240 |
| —— | —— | —— | —— | |
Therefore, to minimise the maximum regret, 40 salads should be supplied.
(W1): If daily demand is 40 salads, it would be the right decision for the business to supply 40 salads since the profit of supplying 40 salads is the highest, i.e. $80.
- If the business decided instead to supply 50 salads, the regret (opportunity cost) would be the $80 it could have made supplying 40 salads minus the $0 it did make supplying the 50 salads = $80.
- If the business decided instead to supply 60 salads, the regret (opportunity cost) would be the $80 it could have made supplying
40 salads minus the $80 loss it did make supplying the 60 salads = $160.
- If the business decided instead to supply 70 salads, the regret (opportunity cost) would be the $80 it could have made supplying
40 salads minus the $160 loss it did make supplying the 70 salads = $240.
Usefulness of maximin, maximax and minimax regret
With maximin the decision maker chooses the outcome which is guaranteed to minimise his losses. In the process, he loses out on the opportunity to make big profits. It is often seen as a pessimistic approach to decision making (assuming the worst outcome will occur) and is used by decision makers who are risk averse. It may be viewed as being an overly pessimistic approach.
With maximax the decision maker chooses the outcome which is guaranteed to maximise his profit. In this process he risks making a lower profit. It is often seen as an optimistic approach to decision making (assuming the best outcome will occur) and is used by decision makers who are risk seeking. It may be viewed as being an overly optimistic approach.
With minimax regret the decision maker chooses the outcome which minimises the maximum regret. In the process, he risks making a lower profit. It is often seen as a technique for a ‘sore loser’ who does not want to make the wrong decision.
Each of the above techniques can be used for one-off or repeated decisions. Question practice
It is useful to take the time to look at scenario-based questions that are in a similar style as the exam questions. Make sure that you attempt the question below and carry out a detailed review of the recommended answer.
Test your understanding 11
Cement Co is a listed company specialising in the manufacture of cement, a product used in the building industry. The company has been a major player in the construction sector of European country, Q, since its formation in 1987. It is passionate about customer care and proud of its active approach to safety and sustainability (recognising the need to minimise any adverse environmental impact of its operations).
The company operates in a very traditional industry but profits can be volatile. Q’s economy has been in recession for the last three years and this has had a direct impact on Cement Co’s profitability. Shareholders are concerned about this fall in profit and have expressed their desire for a secure return. Competitors, keen to find ways of increasing profit and market share, in these difficult economic circumstances, have started to increase the level of investment in research and development, ensuring their products anticipate and meet the needs of its customers.
When Q entered recession, many workers left the country in search of more lucrative and secure work. This has had a significant impact on Cement Co which is now facing labour shortages and increased labour costs. At the same time, suppliers have also increased their prices putting further pressure on Cement Co’s margins.
The company has found that when weather conditions are good, the demand for cement increases since more building work is able to take place. Last year, the weather was so good, and the demand for cement was so great, that Cement Co was unable to meet demand. Cement Co is now trying to work out the level of cement production for the coming year in order to maximise profits. The company doesn’t want to miss out on the opportunity to earn large profits by running out of cement again. However, it doesn’t want to be left with large quantities of the product unsold at the end of the year, since it deteriorates quickly and then has to be disposed of. The company has received the following estimates about the probable weather conditions and corresponding demand levels for the coming year:
| Weather | Probability | Demand |
| Good | 25% | 350,000 bags |
| Average | 45% | 280,000 bags |
| Poor | 30% | 200,000 bags |
Each bag of cement sells for $9 and costs $4 to make. If cement is unsold at the end of the year, it has to be disposed of at a cost of $0.50 per bag.
Cement Co has decided to produce at one of the three levels of production to match forecast demand. It now has to decide which level of cement production to select.
As an incentive to increase profitability a new bonus scheme has just been introduced for a select group of Cement Co’s directors. A bonus will be received by each of these directors if annual profit exceeds a challenging target.
Required:
- Identify the risks facing Cement Co and assess the impact of different risk appetites of managers and shareholders on their response to these risks.
(10 marks)
- Evaluate the proposed levels of cement production using methods for decision making under risk and uncertainty and assess the suitability of the different methods used.
(15 marks)
(Total: 25 marks)
7.5 Impact of risk appetite of stakeholders on performance management
As mentioned earlier in the , a business must consider the needs of its stakeholders when making decisions. Different stakeholders will have different risk perspectives or different risk appetites. For example:
- Shareholders – may be prepared to take a risk (risk seeking) in order to maximise the possible return, especially since shareholders are able to spread their risk by holding a portfolio of investments. However, shareholders are not always classed as risk seeking. For example, the shareholders of a company that is in financial distress may prefer the business to take a more risk neutral or risk averse approach in order to secure the future of the business.
- Employees and managers – they should act in the best interests of the shareholders but this does not always happen since they may be:
– risk averse: employees and managers may be reluctant to take risks, e.g. to invest in a new project, if an unsuccessful outcome would impact their performance evaluation or the survival of the company (and hence their job). Therefore, even though risk taking may be in the best interests of the company and its shareholders they tend to exercise caution and are unwilling to take risks.
– risk seeking: employees and managers may be encouraged to take risks by the promise of huge rewards or bonuses.
Illustration 9 – Risk appetite of employees
The collapse of Lehman brothers, a sprawling global bank, in September 2005, almost brought down the world’s financial system. The then governor of the bank of England, Mervyn King, criticised City banks who rewarded staff with huge sums for taking risks and concluded that the credit crisis was caused, in part, by bankers betting on high-risk complex financial products. A culture of risk taking had developed due to the huge potential bonuses and rewards offered to bankers.
Financiers – these include:
- Venture capitalists (VCs) – VCs are likely to be rational investors seeking the maximum return for minimum risk. They will invest in a number of companies and so are prepared for some of their investments to fail, provided that some of their investments perform well. Steps will be taken to reduce risks, for example performance will be monitored on a regular basis to ensure that any agreed exit strategy can be achieved. In addition, the VCs will also place employees on the management team so that they can influence decisions.
- Banks – traditionally, banks would have been considered to have a reasonably conservative approach to risk with a desire to secure their funds and guarantee returns.
Illustration 10 – Banks and risk taking
As mentioned above, banks are not normally considered to be risk seeking. However, the financial crisis which commenced in 2007 was triggered by US banks giving high risk loans (sub-prime mortgages) to people with poor credit histories. A sharp rise in US interest rates resulted in a huge number of American home owners defaulting on their mortgages. The impact of these defaults were felt across the financial system as many of the mortgages had been sold to big banks who turned them into supposedly low risk securities. However, this assumption proved wrong. In fact, huge uncalculated risks had been taken with the bankers being spurred on by the potential to earn huge bonuses.
Therefore, in order to effectively manage business performance, it will be necessary for the business to align its decisions with the stakeholder’s risk appetite.
Student accountant articles: visit the ACCA website, accaglobal.com, to review two articles on ‘the risks of uncertainty’.
8 Exam focus
| Exam sitting | Area examined | Question | Number of |
| number | marks | ||
| Sept/ Dec 2017 | PEST, Risk | 4 | 25 |
| June 2015 | Expected values, decision | 1(iii), (iv) | 16 |
| making under uncertainty | |||
| December 2014 | Stakeholders | 1(ii) | 14 |
| June 2014 | Risk | 3(a)(b) | 17 |
| December 2013 | PEST | 1(ii) | 11 |
| June 2013 | Porter’s 5 forces and risk | 3(a)(c) | 21 |
| December 2011 | Risk | 1 | 35 |
| June 2011 | Stakeholders | 2(c) | 6 |
| December 2010 | PEST | 4(a) | 4 |

Test your understanding 1
PEST analysis for UK railways
Political
The balance of public-private involvement in the running costs and capital investment for rail development is a major issue. Any changes in government policy could have dramatic consequences for companies operating in the rail industry.
Economic
The growth of commuter travel on the rail system means it is working at close to full capacity. This trend is likely to continue with the rising costs of fuel, making car travel expensive. This, however, can be seen as a positive for rail companies who can cease the opportunity to increase profits and improve performance.
However, there is a need for investment in infrastructure in areas such as longer platforms and new signal systems. Financing this investment may be difficult but the performance of railway companies will deteriorate in the long-term if the investment is not made.
Social
Increasing concerns about reliability, particularly in rural areas, could detract from profitability as passengers switch to more reliable forms of transport.
Concerns about the effect that railway construction and travel has on the environment could again detract from profitability since customers may be lost.
Safety issues on trains and at railway stations – train travel is comparatively very safe but it is still necessary for the railway companies to monitor safety and address any issues identified.
Technological
The development of new train technologies such as high speed railways could result in a long term boost in profit but will require significant investment.
Also following the trends set by air travel by introducing ways to improve the customer experience. For example, offering Internet access and on-train entertainment. Fulfilment of customers’ needs could, once again, result in improved performance.
Porter’s 5 forces model – UK railways
Competitive rivalry
In certain areas rail operators may be directly competing over the same routes. If the force is medium or high then performance will be negatively impacted.
Threats from substitutes
There are other forms of transport available such as travel by road
(e.g. cars and buses) and travel by air. However, the rising cost of petrol and diesel and the inappropriateness of air travel for shorter journeys may make this force low and the performance of the railway companies should not suffer as a result.
Buyers’ bargaining power
Severe competition over price with low-cost airlines on longer city routes (but again this would not be a suitable alternative for shorter routes).
Online price comparisons make it easy for customers to select lowest cost option but transparency of ticket prices and types in the UK is still poor.
Overall, this force may be classed as medium and the impact on performance will be limited.
Threat from potential entrants
New companies may enter the market when rail franchises become available for re-tender. For example, Virgin entered the UK market some years ago. Any threat should be investigated and acted on since the entry of any new players could seriously reduce market share and profitability.
Suppliers’ bargaining power
With an increasing number of discrete rail and train operators, the allocation of capacity becomes an issue. This is similar to landing slots at airports. Close working relations with suppliers could help to understand this issue and to negotiate the level of service required. If these steps are taken, performance may not suffer.
Test your understanding 2
Loyal customers
Chatman Theatre, which is a charity, can make use of a database to profile their interests and wants. A tailored communication can then be sent.
Given the need to contain costs, this might be by getting customers to sign up to an e -list to get up-to-date news and information on future performances.
They could set up a website with booking facilities and send confirmation by email rather than post.
Develop a friend of the theatre group, giving discounts to regular loyal customers.
First time customers
The website could be linked to other relevant websites, such as local attractions and tourist boards, to attract new customers.
The theatre could produce an information pack to attract new mailing list subscribers. These could be made available in local churches and shops.
Local arts groups
A partnership agreement could be established with arts groups, to co-sponsor events of special interest to given groups of customers.
Local organisations
Try to obtain commercial sponsorship from local companies. Acknowledgement could be given in the monthly programme mailings and preferential facilities offered for corporate hospitality.
Media
Personal invitations could be issued to opening nights, to interview the performers and give an overview of the show.
Note: The above is just a selection of potential relationships with stakeholders.
Test your understanding 3
- Whether or not the museum should charge an entry fee – this would discourage some people from going to the museum (compromising the first objective) but would provide extra cash for funding research.
- Which artefacts should be displayed – education would require a wide range of exhibits with the most prestigious on display. An emphasis on preservation would prevent the most significant items from being displayed for fear of damage.
Test your understanding 4
- Ethical behaviour is likely to be favoured by: – customers: resulting in higher sales volumes and/or prices.
– employees: resulting in the attraction/retention of the best employees and increased employee productivity.
– business collaborators: resulting in increased opportunities for profitable projects.
- Ethical behaviour reduces risk and gives access to cheaper funds which in turn increase project NPVs.
- Unethical behaviour will, at some point be discovered resulting in a damage to reputation and potential legal charges.
Test your understanding 5
- The purpose of a business is to make profits. Profit is a good thing in its own right as it supports stable employment, innovation, allows higher taxes to be paid and makes economies richer. Companies have no need to feel guilty about making profits and buying off some of that guilt by embarking on good works.
- The prime stakeholders are the shareholders and directors should always attempt to maximise shareholder wealth. If directors embark on a CSR programme, have shareholders given permission? It is, after all, shareholders’ money that is being used.
- CSR allows directors to feel generous and righteous – but with someone else’s money. Better, perhaps, that directors and shareholders make private donations out of their remuneration and dividends.
- What is the democratic basis which companies use to choose between CSR projects? Simply choosing a project because the chief executive likes it does not mean the money is being well spent
– the project could be already well-funded.
Test your understanding 6
Suitable metrics could include:
- number of fatalities
- number of permanently disabling injuries
- number of enforcement actions
- accident frequency rate (AFR) e.g. the number of reportable accidents per 100,000 hours worked
- lost time incident frequency rate (LTIFR)
- sickness absence rate
- health and safety training rate (days/employee)
- percentage of employees working within an ISO 18001 compliant Health and Safety Management System.
Test your understanding 7
Areas could include:
Interest rates
Changes in the interest rates for consumer debt may affect demand for luxury goods which may include high-value electronic products.
The company’s cost of debt may change, affecting the cost of developing new facilities.
Exchange rates
Changes in interest rates may change the value of profits earned in different countries or the price to consumers of imported goods.
Taxation levels
The level of personal taxation will affect the demand for products. Changes in the company tax regime will affect the returns to shareholders.
Incentive schemes
The availability of incentive schemes may make expanding into certain countries more attractive.
Worker protection
Legislation in this area may have an impact on the requirements for facilities and their costs.
Restrictive practices
These may affect the company’s ability to export to certain countries.
Environment protection
The company may need to develop new products which are more economical to run or which use materials which are less harmful to the environment when thrown away.
Test your understanding 8
- Customers’ mortgages and loans will become more expensive, giving less net disposable income for major purchases, such as new carpets.
- Customers will be less motivated to borrow to finance carpet purchase.
- The cost of capital will rise so the retailer will be less prepared to undertake major projects.
- The domestic currency will strengthen, reducing the cost of imports.
Test your understanding 9
- Higher interest rates will increase the cost of borrowing and the gearing risk of the firm, making it less likely that long-term earnings targets will be met.
- A fall in government spending could see a downturn in orders, particularly if the firm currently is engaged in government contracts (e.g. building roads, hospitals). Future plans may have to be revised to reflect this and alternative strategies sought. Analysis of sales mix between public and private sector contracts will become more important.
- Potentially lower levels of taxation could increase profitability.
- Lower inflation will reduce business uncertainty, making planning easier. Plans may have to be revised to reflect lower inflation.
- Higher unemployment in the economy could allow the firm to reduce planned pay increases.
Test your understanding 10
| Possible | Possible | Net profit | Combined | px ($) | Bonus prob | |
| demand | inflation | $ = x | prob = p | (profit > | ||
| $50,000) | ||||||
| Strong (prob | None | 95,000 | 0.20 × 0.30 = | 5,700 | 0.06 | |
| (prob | ||||||
| 0.20) | ||||||
| 0.30) | 0.06 | |||||
| 2% (prob | 75,000 | 0.20 × 0.50 = | 7,500 | 0.10 | ||
| 0.50) | 0.10 | |||||
| 4% (prob | 55,000 | 0.20 × 0.20 = | 2,200 | 0.04 | ||
| 0.20) | 0.04 | |||||
| Normal | None (prob | 60,000 | 0.50 × 0.30 = | 9,000 | 0.15 | |
| (prob | ||||||
| 0.50) | 0.30) | 0.15 | ||||
| 2% (prob | 40,000 | 0.50 × 0.050 | 10,000 | – | ||
| 0.50) | = 0.25 | |||||
| 4% (prob | 20,000 | 0.50 × 0.20 = | 2,000 | – | ||
| 0.20) | 0.10 | |||||
| Weak (prob | None (prob | 25,000 | 0.30 × 0.30 = | 2,250 | – | |
| 0.30) | 0.30) | 0.09 | ||||
| 2% (prob | 5,000 | 0.30 × 0.50 = | 750 | – | ||
| 0.50) | 0.15 | |||||
| 4% (prob | (15,000) | 0.30 × 0.20 = | (900) | – | ||
| 0.20) | 0.06 | |||||
| ——— | ——— | |||||
| EV = ∑px | 38,500 | 0.35 | ||||
| ——— | ——— |
Test your understanding 11
- The primary objective of Cement Co, a listed company, will be to maximise shareholder wealth. The directors should, in theory, be acting in the best interests of the shareholders. The shareholders appear to be reasonably risk averse at the moment since they have expressed concern over the fall in profit.
Cement Co is open to a lot of risk and uncertainty:
– Firstly, Q’s economy is in recession which will have a direct impact on Cement Co as house building falls and government contracts are cut.
– At the same time, the company’s costs are increasing due to increases in wages and in suppliers’ prices.
– Cement Co is risking falling behind its competitors who have increased investment in research and development. There is a risk that Cement Co will not be able to meet the needs of its customers as well as its competitors.
– Cement Co does pride itself on its approach to sustainability and safety. However, the industry is characterised by its negative impact on the environment and poor safety record and therefore it is imperative that Cement Co does not lose focus on achieving their sustainability and safety targets.
– Finally, volatile weather conditions can have a huge impact on the building industry and on Cement Co’s profitability. The weather is clearly something that cannot be controlled but the risk should be appropriately managed.
Directors can take one of three approaches to managing risk:
– Risk averse directors – will assume the worst outcome and will seek to minimise its effect. Some of Cement Co’s directors will be keen to take this approach in the hope of securing a satisfactory return for shareholders and securing their positions.
– Risk seeking directors – will assume the best outcome and will seek to maximise its effect. Some of the directors will be risk seeking, hoping to secure an outcome that will maximise profitability and their annual bonus.
– Risk neutral directors – these directors will be interested in the most probable outcome. This would be a sensible approach in situations where the risks remain unaltered and decisions are repeated many times.
- Level of cement production
Before any of the techniques for decision making under risk and uncertainty are applied, it will be necessary to construct a payoff table:
SUPPLY
DEMAND Weather Probability 350,000 280,000 200,000
Profit $000 Profit $000 Profit $000
| 350,000 | Good | 0.25 | 1,750 | (W1) | 1,400 | 1,000 |
| 280,000 | Average | 0.45 | 1,085 | (W2) | 1,400 | 1,000 |
| 200,000 | Poor | 0.30 | 325 | 640 | 1,000 |
Workings
Profit per bag sold in coming year = $9 – $4 = $5 Loss per bag disposed of = $4 + $0.50 = $4.50
(W1) 350,000 × $5 = $1,750,000
(W2) [280,000 × $5] – [70,000 × $(4.50)] = $1,085,000 etc.
We can now evaluate the proposed levels of cement production using four different methods:
Method 1: Expected Values
Use the probabilities provided in order to calculate the expected value of each of the supply levels.
Good: (0.25 × $1,750,000) + (0.45 × $1,085,000) + (0.30 × $325,000) = $1,023,250
Average: (0.7 × $1,400,000) + (0.3 × $640,000) = $1,172,000 Poor: 1 × $1,000,000 = $1,000,000
The expected value of producing 280,000 bags when conditions are average is the highest at $1,172,000, therefore this supply level should be chosen.
Method 2: Maximin
Identify the worst outcome for each level of supply and choose the highest of these worst outcomes.
| SUPPLY | |||
| 350,000 | 280,000 | 200,000 | |
| Profit $000 | Profit $000 | Profit $000 | |
| Worst | 325 | 640 | 1,000 |
The highest of these is $1,000,000 therefore choose to supply only 200,000 bags to meet poor conditions.
Method 3: Maximax
Identify the best outcome for each level of supply and choose the highest of these best outcomes.
| SUPPLY | |||
| 350,000 | 280,000 | 200,000 | |
| Profit $000 | Profit $000 | Profit $000 | |
| Best | 1,750 | 1,400 | 1,000 |
The highest of these is $1,750,000 therefore choose to supply 350,000 bags to meet good conditions.
Method 4: Minimax Regret
For each level of demand, identify the right decision (the supply level which results in the highest profit) and the regret for the other supply levels. Choose the maximum level of regret at each possible supply level and then choose the level of supply that minimises this maximum regret.
| SUPPLY | |||
| DEMAND | 350,000 | 280,000 | 200,000 |
| Regret $000 | Regret $000 | Regret $000 | |
| 350,000 | Right decision | 350 (W3) | 750 |
| 280,000 | 315 (W4) | Right | 400 |
| 200,000 | 675 | 360 | Right decision |
| Maximum regret | 675 | 360 | 750 |
(W3) Regret (opportunity cost) = $1,750,000 – $1,400,000 = $350,000
(W4) Regret (opportunity cost) = $1,400,000 – $1,085,000 = $315,000
Suitability of the different methods
The maximin decision rule looks at the worst possible outcome at each supply level and then selects the highest one of these. It is used when the outcome cannot be assessed with any level of certainty. The decision maker therefore chooses the outcome which is guaranteed to minimise his losses. In the process, he loses out on the opportunity of making big profits. It is often seen as the pessimistic approach to decision-making (assuming that the worst outcome will occur) and is used by decision makers who are risk averse. It can be used for one-off or repeated decisions.
The expected value rule calculates the average return that will be made if a decision is repeated again and again. It does this by weighting each of the possible outcomes with their relative probability of occurring. It is the weighted arithmetic mean of the possible outcomes. Since the expected value shows the long run average outcome of a decision which is repeated time and time again, it is a useful decision rule for a risk neutral decision maker. This is because a risk neutral person neither seeks risk nor avoids it; they are happy to accept an average outcome. The problem often is, however, that this rule is often used for decisions that only occur once. In this situation, the actual outcome is unlikely to be close to the long run average. For example, with Cement Co, the closest actual outcome to the expected value of $1,172,000 is the outcome of $1,085,000. This is not too far away from the expected value but many of the others are significantly different.
The maximax decision rule looks at the best possible outcome at each supply level and then selects the highest one of these. It is used when the outcome cannot be assessed with any level of certainty. The decision maker therefore chooses the outcome which is guaranteed to maximise his gain. In the process, he risks making a lower profit. It is often seen as an optimistic approach to decision making (assuming the best outcome will occur) and is used by decision makers who are risk seeking. It can be used for one-off or repeated decisions.
The minimax regret decision rule looks at the maximum regret (opportunity cost) at each level of supply and aims to choose the level of supply which minimises the maximum regret. In the process, he risks making a lower profit. It is often seen as a technique for a ‘sore loser’ who doesn’t want to make the wrong decision.