

CHAPTER FIVE.
FINANCIAL PLAN.
The main reason for preparing a business plan is to receive funds. When preparing the plan, one analyzes the financial requirements of the business.
The financial plan is an important part of the business plan because it is here that the profitability of the intended business is demonstrated to the entrepreneur and to the potential financiers. It provides a tool for monitoring the financial performance of the business. In this chapter of the business plan, an analysis of financial requirements of a business is presented. The financial plans development is also illustrated.
OBJECTIVES OF THE FINANCIAL PLAN
- Maintain a healthy liquidity position throughout the trading period.
- Maintain return on owners’ equity(ROE) e.g. at 25%
- Realize a steady growth on income throughout the period.
- Maintain and control expenses.
- Maintain an effective accounting sytem-quickbooks,sage,any accounting related software
FINANCIAL ASSUMPTIONS.
- The expenses are expected to rise by 5% as business operations expand.
- Creditors are to be increased by a certain percentage per year.
- Debtors are to increase by a certain percentage per year
- Net profit is expected to increase by a certain percentage per annum
- Net profit realized would be ploughed back to the business so as to expand the business.
In the financial plan, you will deal with financial aspects of your proposed business. To gauge your future financial potential, you will prepare
- Proforma/projected balance sheets,
- Proforma profit and loss accounts and
- A projected cash flow statement.
You will also determine;
- The break-even level of sales
- Calculate the expected profitability ratios of your business
- Financial requirement
- Proposed capitalization.
- Pre-operational costs
Entails costs incurred before the start of the business.
| Items | Cost |
| Research | |
| Travelling/transport | |
| Designing | |
| Licenses and permits | |
| Advertisement | |
| Professional fee | |
| Installation | |
| Rent deposit | |
| Utility bills(water, telephone and power) | |
| vehicle | |
| Miscellaneous | |
| Production,facilites and capacity | |
| Total amount |
5.2 Proforma balance sheet
A balance sheet is a financial statement that shows the financial position of the business for a certain period of time (usually one year).
This financial statement depicts the financial structure of a business at the end of an accounting period. It has three major components: assets, liabilities, and stockholders’ equity. They show what the business owns or controls, how much is owed to creditors, and the residue net worth of the enterprise after asset value has debt subtracted from it.
To prepare this document one should understand the concept of BASIC ACCOUNTING EQUATION that appears like this.
A= C+ L
Accounting is considered the language of business
ANALYSIS OF THE BASIC ACCOUNTING EQUATION
- ASSETS
Some assets are tangible like cash while others are theoretical or intangible like goodwill or copyrights. Another common asset is a receivable. This is a promise to be paid from another party. Receivables arise when a company provides a service or sells a product to someone on credit. All of these assets are resources that a company can use for future benefits.
Assets are classified in two main types.
- 1. Fixed/Non-current assets-Required by the business to assist in earning revenues and not for sale. They are normally expected to be in business for more than one year.
- Current assets-They are not expected to last for more than one year. They are mostly directly related to trading activities of the firm.
Here are some common examples of assets:
- Cash at bank
- Accounts Receivable/debtors
- Prepaid Expenses
- Vehicles
- Buildings
- Goodwill
- Copyrights
- Patents
- Land
- Fixtures
- Furniture
- Plant and machinery
- Stock
- Cash in hand
- Prepayments
2 LIABILITIES
A liability, in its simplest terms, is an amount of money owed to another person or organization. Said a different way, liabilities are creditors’ claims on company assets because this is the amount of assets creditors would own if the company liquidated. A common form of liability is a payable. Payables are the opposite of receivables. When a company purchases goods or services from other companies on credit, a payable is recorded to show that the company promises to pay the other companies for their assets. Here are some examples of some of the most common liabilities:
- Accounts payable /creditors
- Bank loans
- Lines of Credit
- Personal Loans
- Officer Loans
- Unearned income
- Bank overdraft
- Accruals
Liabilities are classified in two main types
- Long term liabilities-They are expected to last or to be paid after one year e.g. 5 years loans from a bank.
- Current liabilities-Last for a period of less than one year and therefore would be paid within one year.
- EQUITY (CAPITAL)
Equity represents the portion of company/business assets that shareholders or partners own. In other words, the shareholders or partners own the remainder of assets once all of the liabilities are paid off.
C=A-L
VARIABLES AFFECTING CAPITAL
- Additional investments
- Net profit
- Drawings
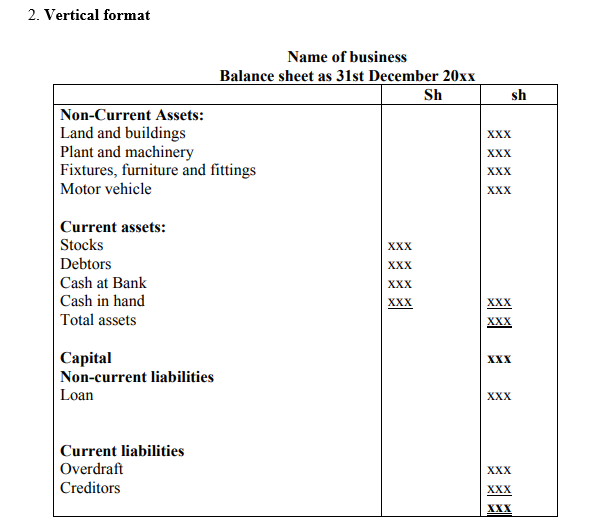
One can prepare a vertical or horizontal/T balance sheet.
- 1. Horizontal /T format
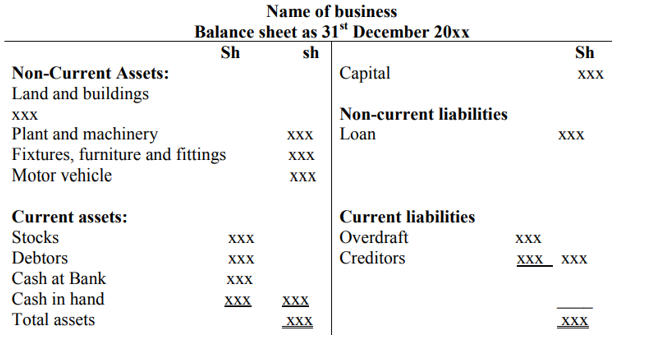
Non-current assets are listed in order of performance as shown i.e. from land and buildings to motor vehicles.
The current assets are listed in order of liquidity i.e. which assets is far from being converted into cash. Example, stock is not yet sold, (i.e. not yet realized yet) then when it is sold we either get cash or a debtor (if sold on credit). When the debtor pays then the debtor may pay by cheque (cash has to be banked) or cash.
The current liabilities are listed in order of payment i.e. which is due for payment first. Bank overdraft is payable on demand by the bank, then by creditors.
5.3 Working capital.
Working capital = Current assets – current liabilities.
- Cash flow projection
This is a financial statement that shows cash in and out of the business.
- Transactions that generate cash in a business include: sales, payments from debtors, discount received, rent received, loan received and many more.
- Transactions that may reduce cash in a business include: purchases, salaries/wages, rent payments, payment to creditors, standing orders, discount allowed and many more.
NB It’s always good to prepare cash flow projection for three years.
A business enterprise normally prepares the following two financial statements
- Profit or loss or income statement which helps to find out the profit or loss made as result of operations of the company over a specified period.
- Balance sheet or financial position statement which reflects the state of asset and liabilities of company on a particular period.
Another required financial statement is cash flow statement. This is requirement of International Accounting 7 (IAS 7)
NEED FOR CASH FLOW STATEMENT.
Users of financial statements, require understanding how the business generated cash and how the cash was used. Unlike the income statement where profit reported is influenced by accounting policies and estimates, cash flow indicate the performance of the business enterprise without such influences, therefore provide a better perspective to evaluating the performance. Remember that a business enterprise can be making profits, while at the same time suffering from cash crisis. This can lead to business enterprise wind up.
COMPONENTS OF CASH FLOW STATEMENT
Cash flow statement summaries the cashbook, by reconciling the opening and closing balance of the cash and cash equivalents.
- Cash
- Demanded deposits in banks
- Short term investments
- Bank overdraft
The cash movement activities are classified into 3 categories
- Operating cash movement/ activities
- Investing cash movement/ activities
- Financial cash movement/ activities
USES OF CASH FLOW STATEMENTS
Cash flow statements have many uses other than the legal need for some companies to prepare them. A few cases where a business might find them useful is answering such questions as below
Small businessman may want to know why he now has an overdraft. He started off the year with money in the bank, he has made profit and yet he now has a bank overdraft. Another businessman may want to know why the bank balance has risen even though the business is losing money. The partners in a business have put in additional capital during the year. Even so, the bank balance has fallen dramatically. They may want explanation as to how this has happened. A study of the final accounts themselves would not give them the information that they may needed. However, a study of the cash flow statement in each case will reveal the answer to their questions. Besides the answers to such specific queries, cash flow statement should also help businesses to assess the following.
- The cash flows which the business may be able to generate in the future;
- How far the business will be able to meet future commitment, e.g tax due, loan repayments, interest payments, contracts that could possible lose quite a lot of money;
- How far future share issues may be needed or additional capital in the case of sole trader or partnership;
- A valuation of the business
SAMPLE FROM AN OPERATIONAL BUSINESS.
| RECEIPTS | Jan | Feb | March | April | May | June | July | Aug | Sept | Oct | Nov | Dec | TOTAL |
| Cash Sales | |||||||||||||
| Credit sales | |||||||||||||
| Capital introduced e.g. loan | |||||||||||||
| Other income | |||||||||||||
| TOTAL RECEIPTS (A) | |||||||||||||
| PAYMENTS | |||||||||||||
| Cash purchases | |||||||||||||
| Credit purchases | |||||||||||||
| Salaries/wages | |||||||||||||
| Rent/rates/water | |||||||||||||
| Property tax | |||||||||||||
| Light/heat/power | |||||||||||||
| Insurance | |||||||||||||
| Maintenance/Repair | |||||||||||||
| Leasing payments | |||||||||||||
| Drawings | |||||||||||||
| Interest charges | |||||||||||||
| Capital expenditure | |||||||||||||
| Telephone | |||||||||||||
| Postage | |||||||||||||
| Stationery/printing | |||||||||||||
| Transportation | |||||||||||||
| Vehicle running cost | |||||||||||||
| Other | |||||||||||||
| VAT payable | |||||||||||||
| TOTALPAYMENT(B) | |||||||||||||
| NET CASH FLOW (A-B) | |||||||||||||
| BALANCE BROUGHT FORWARD | |||||||||||||
| NEW BALANCE |
5.4 Projected cash flow for the year 20xx
| Cash inflows | Jan | Feb | March | April | May | June | July | Aug | Sept | Oct | Nov | Dec | TOTAL |
| Opening cash | 480,000 | 485,500 | |||||||||||
| Cash sales | 470,000 | ||||||||||||
| Credit sales | |||||||||||||
| Other inflows | 40,000 | ||||||||||||
| Total cash inflows | 510,000 | ||||||||||||
| Cash available | 990,000 | ||||||||||||
| Cash outflows | |||||||||||||
| Loan payment | 20,000 | ||||||||||||
| Salaries and wages | 98,500 | ||||||||||||
| Rent | 30,000 | ||||||||||||
| insurance | 10,000 | ||||||||||||
| Electricity bills | 5,000 | ||||||||||||
| Purchases | 323,000 | ||||||||||||
| Repair and maintenance | |||||||||||||
| Licenses and permits | 10,000 | ||||||||||||
| Transport | 8,000 | ||||||||||||
| Total cash outflow | 504,500 | ||||||||||||
| Net cash flow | 485,500 | ||||||||||||
- projected cash flow for the year 20xx
- projected cash flow for the year 20xx
- Proforma income statement (Trading, Profit and Loss account)
This is one of the final account and has two sections
- Trading account
Summarizes trading activities i.e. sales and purchases of goods of a business and tries to determine the gross profit for the relevant financial period.
The gross profit is then taken up in profit and loss account as part of the income
- Profit and loss account.
It shows the net profit/net loss of the business as made from all the activities during a financial period. The net profit/loss is determined by deducting expenses from all incomes of the same financial period.
SAMPLE FORMAT FROM AN OPERATING BUSINESS
THIKA TRADERS
TRADING PROFIT AND LOSS ACCOUNT
FOR THE YEAR ENDED 31 DECEMBER 20XX
| Opening stock xxx | Sales xxx |
| Purchases xxx | -return inwards xxx |
| + carriage inwards xxx | Net sales xxx |
| xxx | |
| -returns outwards xxx | |
| Net purchases xxx | |
| Cost of goods available for sale xxx | |
| -closing stock xxx | |
| Cost of goods sold xxx | |
| Gross profit c/d xxx | |
| xxx | xxx |
| Gross profit b/d xxx | |
| Expenses | Incomes xxx |
| Total expenses xxx | |
| Net profit c/d xxx | |
| xxx | xxx |
| Net profit b/d xxx |
5.5 Proforma income statement for the year 20xx
| Cash inflows | Jan | Feb | March | April | May | June | July | Aug | Sept | Oct | Nov | Dec | TOTAL |
| Cash sales | 470,000 | ||||||||||||
| Credit sales | |||||||||||||
| Total sales | 470,000 | ||||||||||||
| Cost of goods | 270,000 | ||||||||||||
| Gross profit | 200,000 | ||||||||||||
| Expenses | |||||||||||||
| Salaries and wages | 98,500 | ||||||||||||
| Loan payment | 20,000 | ||||||||||||
| Rent | 30,000 | ||||||||||||
| insurance | 10,000 | ||||||||||||
| Electricity bills | 5,000 | ||||||||||||
| Repair and maintenance | |||||||||||||
| Licenses and permits | 10,000 | ||||||||||||
| Other expenses | 3,500 | ||||||||||||
| Transport | 8,000 | ||||||||||||
| Total expenses | 188,000 | ||||||||||||
| Net profit | 12,000 | ||||||||||||
| Taxation 10% | 1,200 | ||||||||||||
| Net profit after taxation | 10,800 |
- Proforma income statement for the year 20xx
- Proforma income statement for the year 20xx
5.6 Break even analysis.
Break even analysis is where the total revenue is equal to the total costs. The firm is at normal profit or zero profit.
If total revenues are more than total costs, the firm makes abnormal or supernormal profits.
If total revenues are less than total costs the firm will make losses.
Break even analysis is also known as Cost Volume Analysis.
Assumptions of break-even point analysis.
- Fixed cost will remain constant.it means that the fixed cost does not change as output changes.
- Cost and revenue behave in a linear fashion or linear manner.it means if costs increases, revenues will increase proportionally.
- The only factor affecting cost and revenue is volume (turnover).
- Technology, production methods and efficiency does not change.
- For graphical methods, the analysis relates to one product or to a constant product.
- The closing stock is valued at marginal cost only
USEFULLNESS OF BREAK EVEN POINT ANALYSIS
As a management tool, it has the following benefits.
- Helps to find specific level of output
- Shows behavior trend of cost and sales.
- Information can be used to make proper decisions.
- To know the quantity which is safer to produce (safety level).
LIMITATIONS TO BREAK-EVEN POINT ANALYSIS.
- Only done within specific levels of activity.
- Fixed costs may change at different levels of activity especially in long run.
- Variable costs may not give a linear trend.
- The relevant time factor can affect break-even analysis.
FORMULAE TO BE USED IN BREAK EVEN ANALYSIS.
- BEP in units = fixed costs
Contribution/unit
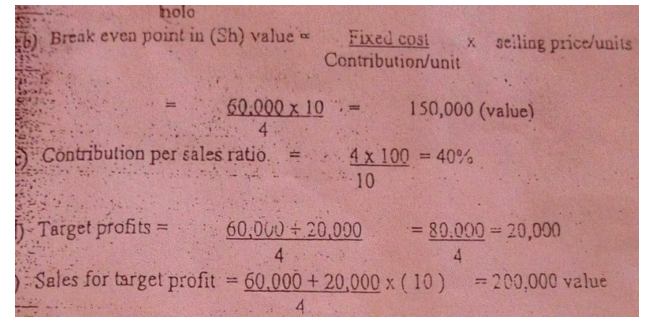
- BEP in value(shs) = fixed costs
Contribution/unit
- Contribution/sales ratio =Contribution/unit
Selling price
- Number of units for target profits = fixed costs +target profits
Contribution/unit
- Sales for target profit= fixed costs +target profits(selling price)
Contribution/unit
EXAMPLE
A company makes a single product with a price of shs 10 and a marginal cost of shs 6 and the fixed cost of shs 60,000 pa.Calculate.
- Number of units to break-even point(BEP)
- BEP in units= fixed costs
Contribution/unit
a.Contribution=selling price-marginal/variable cost
=10-6
BEP in units = 60,000
4
7 Desired financing
| Item | Amount(Ksh) |
| Pre-operational costs | |
| Working capital | |
| Fixed assets | |
| Total |
5.8 Capitalization
| Item | Amount(Ksh) |
| Owners contribution | |
| Borrowed funds | |
| Total investment |
- What security will you give? (Consider: fixed assets, mortgage, collateral security e.g land title deeds or property title deeds, other acceptable security (specify).
- What will be your preferred loan repayment terms?(Consider the amount of the loan, the repayment period, loan interest percentage grace period and monthly installments.)
5.9 profitability ratios
- Gross profit margin
Gross profit x 100 = ……………………… %
Sales
Year 1 Year 2 Year3
Percentage ……………………………………………………………
- Return on equity
Net profit after tax x 100 = …………………… %
Owner’s equity
Year 1 Year 2 Year3
Percentage ……………………………………………………………
Owners’ equity=opening capital+ net profit-withdrawals
- Return on investment
Net profit after tax + interest x 100 = …………………. ksh
Total investment
Year 1 Year 2 Year3
Percentage ……………………………………………………………
- Net profit ratio= Net profit x 100 = ……………………… %
Sales
- Asset turnover = Sales revenue (total sales) x100 = ……………………… %
Assets (CA+FA)
- Quick ratio= current assets-stock (closing)
Current liabilities
- Liquidity ratio = CA
CL