UNIVERSITY EXAMINATIONS: 2019/ 2020
EXAMINATION FOR THE DEGREE OF BACHELOR OF SCIENCE IN
INFORMATION TECHNOLOGY/ BUSINESS INFORMATION
TECHNOLOGY/ APPLIED COMPUTING/ SOFTWARE
DEVELOPMENT/ INFORMATION SECURITY & FORENSCIS
BIT 2201\ BBIT 308\ BSD 2106\ BAC 2106\BISF 2106: SIMULATION AND
MODELLING
FULL TIME/PART TIME/DISTANCE LEARNING
DATE: MAY, 2020 TIME: 6 HOURS
INSTRUCTIONS: Answer ALL Questions
SECTION B: (20 MARKS)
QUESTION ONE
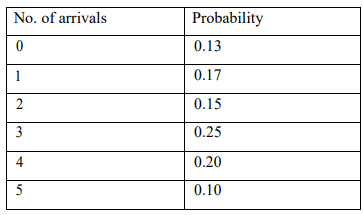
a) KCA University carries out voluntary testing and counselling session on semester basis to
all its students. The table below shows the probability distribution of inter-arrival times of
students during the past sessions.

The testing and counselling takes different times according to the following probability
distributions:

Using the following random numbers, simulate a testing and counselling session.
Inter arrival
time

Required:
(i) Average queue length
(ii) Average waiting time of customers before service
(iii) Average service idle time
(iv) Average service time
(v) Time a customer spends in the system
(vi) Percentage of service idle time [10 Marks]
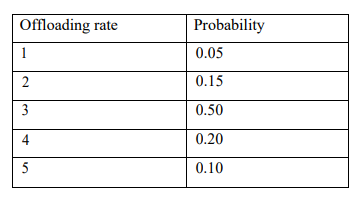
b) The table below shows the probability distribution of a container arriver per day at

The offloading rate per day follows the probability distribution given below. The
offloading is done on first come first served basis.

Suppose the following are the random numbers of arrivals and random numbers of
unloading.
Arrival Random numbers:
52, 06, 50, 88, 53, 30, 10, 47, 99, 37, 66, 91, 35, 32, 00
Offload Random numbers:
37, 63, 28, 02, 74, 35, 24, 03, 29, 60, 74, 85, 90, 73, 59
Simulate the process and find out:
(i) The average number of container delayed. [4 Marks]
(ii) The average number of arrivals per day [3 Marks]
(iii) The average number of containers offloaded each day. [3 Marks]
SECTION C: (20 MARKS)
QUESTION TWO
a) A confectioner sells confectionery items. Past data of demand per week (in hundred
kilograms), with frequency, is given below:
Demand per
week
5 10 15 20 25
Frequency
211 8 21 5 3
(i) Construct a probability distribution for each variable. [2 Marks]
(ii) Find the expected number of items demanded per week. [2 Mark]
(iii) Using the following sequence of random numbers
35, 52, 90,13, 23, 73, 34, 57, 35,83, 94, 56, 67, 66, 60
. Generate the demand
for the next
10
weeks. [3 Marks]
(iv) Based on the generated data, find the average demand per week.
[1 Mark]
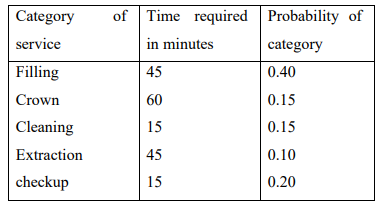
b) A dentist schedules all his patients for 30-minute appointments. Some of the patients
take more than 30 minutes, some less, depending on the type of dental work to be
done. The following summary shows the various categories of work, their
probabilities and time actually needed to complete the work:

Simulate the dentist’s clinic for four hours and determine the average waiting time for the
patients as well as the idleness of the doctor. Assume that all the patients show up at the clinic at
exactly their scheduled arrival time starting at 8:00 a.m. Use the following random numbers for
handling the above problem: 40, 82, 11, 34, 25, 66, 17, 79
[13 Marks]
