
MONDAY: 5 December 2022. Afternoon Paper. Time Allowed: 3 hours.
Answer ALL questions. This paper has two sections. SECTION I has twenty (20) short response questions of forty (40) marks. SECTION II has three (3) practical questions of sixty (60) marks. Marks allocated to each question are shown at the end of the question.
Required Resources:
- A computer
- Python program
SECTION I
1. The category of numerical data in machine learning that varies over time and can have separate values at any given point is referred to as: (2 marks)
2. State the name given to a technique that converts higher dimensions dataset into lesser dimensions dataset to ensure
provision of similar information. (2 marks)
3. State the name of the regression that describes data and explains the relationship between one dependent binary variable and one or more nominal, ordinal, interval or ratio-level independent variables? (2 marks)
4. Identify the algorithm used for frequent itemset mining and association rule learning over relational databases. (2 marks)
5. The type of Naïve Bayes model that is used in classification and assumes that features follow a normal distribution is known as _____________. (2 marks)
6. State the first step when explaining the working of K-Nearest Neighbor algorithm of machine learning. (2 marks)
7. Identify the learning approach with reference to problem solving features that takes input for a given problem then produce the end result (2 marks)
8. The type of linear regression in machine learning where more than one independent variable is used to predict the value of a numerical dependent variable is referred to as_______________. (2 marks)
9. Identify the python package that can be used with natural language processing. (2 marks)
10. State the unsupervised machine learning technique that is capable of scanning documents and detecting phrase patterns within them. (2 marks)
11. Suggest an area of concern in big data ethics that outline the potential for immoral use of data. (2 marks)
12. State the term in big data that refers to the identification and removal of meaningless information present in data? (2 marks)
13. The python library that supports working with arrays and matrices is referred to as ______________. (2 marks)
14. The data science concept that can be used to analyze a variety of network information and has various applications is referred to as _______________. (2 marks)
15. State the term that describes the feature that will allow a data scientist to reduce a linear operation to much simpler problems? (2 marks)
16. A type of neural network that supports the modelling of time dependent and sequential data problems is referred to as _______________ . . (2 marks)
17. State the term that can be used to describe the data visualization tool that is laid out on a map or table and uses different nuances and intensities of colors to represent its data? (2 marks)
18. The big data technology that is used to query continuous data flow and detect conditions quickly within a small time period is referred to as _________________. (2 marks)
19. The unsupervised machine learning approach that is capable of scanning a set of documents, detecting phrase patterns within them and automatically clustering word groups is referred to as ________________. (2 marks)
20. Identify the method that is used to predict the behavior of dependent variables in regression analysis. (2 marks)
SECTION II
21. Create a word processor document named “Question 21” and use the word processor document to save your answers to questions 1 to 2 below:
1. Write a python code to draw a scatter plot with x values as 1,2,3,5,6,7,8,9,10, 12,13,14,15,16,18,19,21,22 and y values as 100,90,80,60,60,55,60,65,70,70,75,76,78,79,90,99,99,100.
Plot the line of linear regression on the scatter plot and display the output. (10 marks)
2. Using appropriate python functions, draw the line of polynomial expression. (10 marks)
Capture a screenshot to demonstrate how you have performed the above task.
Upload Question 21 document.
(Total: 20 marks)
22. Create a word processor document named “Question 22” and use the word processor document to save your answers to questions 1 to 3 below:
1. Write a python code that will create and display an array that resembles two variables given by x (number of clusters) and y (inertia) in a data set and convert the data into a set of points.
X= 3, 4, 11, 4, 3, 10, 13, 7, 9, 13
Y= 20, 18, 23, 16, 17, 26, 24, 23, 22, 21 (9 marks)
2. Write a python code that will run k-means across the data in part 1 for a range of 10 possible values. For each value of K in the range, the K-means model should be trained before plotting the inertia against the number of clusters. (10 marks)
3. Write a python code that will fit the K-means algorithm at the point where the inertia becomes more linear then the code should plot the different clusters assigned to the data. (6 marks)
Capture a screenshot to demonstrate how you have performed the above task.
Upload Question 22 document.
(Total: 25 marks)
23. Create a word processor document named “Question 23” and use the word processor document to save your answers
to questions 1 and 2 below:
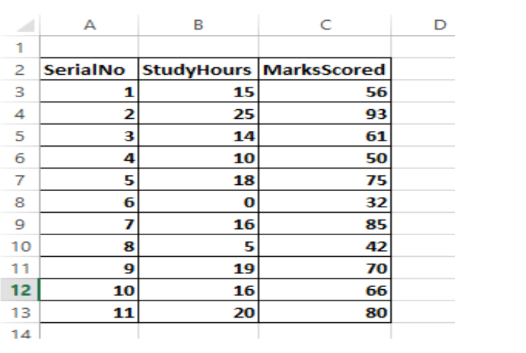
1. Create a folder on the desktop and call it “BIG DATA”. Create an excel document shown below, save it as a comma separated version (CSV) file named “Analytics”. (3 marks)
2. Write python programming codes that will perform the following tasks.
Retrieve data from analytics.csv file in question (a) above and print a summary of its description. (2 marks)
Split the data into training and testing sets. (3 marks)
Split each set into input and output attributes data. (3 marks)
Visualise the relationship between attributes in training and test data sets using scatter graph. (4 marks)
Capture a screenshot to demonstrate how you have performed the above task.
Upload Question 23 document.
(Total: 15 marks)