
4.0 Introduction
In everyday usage, measurement occurs when an established yardstick verifies the height, weight or another feature of a physical object. How well you like a song, a painting, or the personality of a friend is also a measurement. In a dictionary sense, to measure is to discover the extent, dimensions, quantity, or capacity of something, especially by comparison with a standard. We measure casually in daily life, but in research the requirements are rigorous.
Measurement in research consists of assigning numbers to empirical events in compliance with a set of rules. This definition implies that measurement is a three part process:
- Selecting observable empirical events.
- Using numbers or symbols to represent aspects of the events, and
- Applying a mapping rule to connect the observation to the symbol.
As already noted, measurement is the assignment of numerals to objects or events according to some rules. A rule is a guide that directs you on how to go about assigning numerals. A numeral is a symbol of the form 1, 2, 3, or I, II, III…… A numeral has no quantitative meaning unless we give it such a meaning. It is simply a symbol of special kind. Numbers are used because they facilitate communication of the measurement procedures and the results from researcher to researcher. In addition the use of numbers allows mathematical manipulations of the measurement data.
A note of postulates
A postulate is an assumption that is an essential prerequisite to carrying out some operations or some thinking. In this case it is an assumption about the relations between the objects being measured.
There are three important postulates;
- Either (a=b) or (a≠b) but not both. This postulate is necessary for classification in data analysis.
- If (a=b) and (b=c), then (a=c). This postulate enables a measurement to establish the equality of set numbers on a characteristic by comparing objects.
- (a b) and (b c) then (a c). This is an important postulate and most measurements in marketing research depend on it.
4.1 Types of scales
A scale is a device for measuring magnitude or quantity of a variable. Scales may be a series of steps, degrees, a scheme of graded amounts from the highest to lowest, an indicator of relative size; scales may also designate appropriate categories such as age, sex, etc;
There are four types of scales commonly used as levels of measurements.
1. Nominal scale
In business and social research, nominal data are probably more widely collected than any other. When you collect nominal data, you partition a set into categories that are mutually exclusive and collectively exhaustive. In this type of scale, the numbers serve only as labels or tags for identifying objects, events or characteristics. For instance, a person identity card number is a nominal scale. It only serves the function of identifying the person. We can assign numbers to football players, telephone subscribers or to products in
a storeroom. These numbers or codes have no mathematical implication, and the only property conveyed by the number is identity. Arithmetic operations cannot be performed on these numbers, as they would have no meaning.
The only permissible mathematical operations in nominal scales are those leased upon counting such as frequencies, modes and percentages. There are three forms of nominal scales:
- label nominal scale
- category nominal scale
- mixture nominal scale
1. Label nominal scale: This is the most elementary nominal scale. A label nominal scale is simply a label assigned to an object in order to identify and keep track of it. In this kind of scaling each label is unique to one object and possesses no meaning in itself.
2. Category nominal scale: This is the most commonly used nominal scale in marketing research. In category nominal scale, numbers are used to represent mutually exclusive and exhaustive categories of objects. Thus, one might classify the residents of a city according to their expressed religious preferences. Classification set A given in table 8.1 is not a sound category nominal scale because it is not collectively exhaustive. Set B meets the minimum requirements, although this classification may be more useful for some research purposes than others.
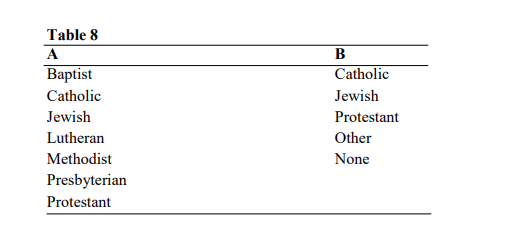
Thus each category must be assigned to one, and only one scale category, and must possess the measured common characteristic. Other examples of characteristics measured with category nominal scale include sex, tribe and so forth. For instance, in a given study men may be coded ‘1’ and women ‘2’ and this serves no other function apart from classification.
3. Mixture nominal Scale: This is a nominal scale which is partially a label. The numbers and labels assigned football players serve to identify the individual players, and also to place players in a category.
Ordinal scales
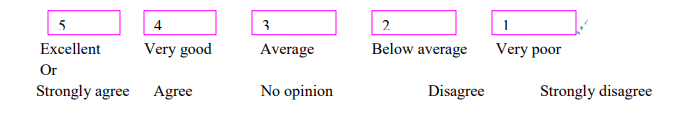
This is a qualitative scale comprised of equal appearing intervals that rank observations from large to small. This scale indicates rank order only. It does not indicate the nature of the intervals between the ranks. For example, if several soft drinks are scaled according to
sweetness, and number 1 represents the highest degree of sweetness, then the drinks assigned number 3 would be sweeter than one assigned number 4 but less sweet than one assigned number 2.
Note that with ordinal scale the only permitted statements are of greater than or less than nature; we cannot make statements about how much less of characteristic one object posses relative to another. Ordinal measures commonly have only three to five categories, i.e, good, better, best or:
In dealing with ordinal scale, statistical description to positional measures such as median, quartile, percetile or other summary characteristics which deal with order among quantities.
Interval scales
Interval scale has the power of nominal and ordinal scale plus one additional strength; it incorporates the concept of equality in interval (the distance between 1 and 2 equals the distance between 2 and 3). The intervals are known and equal. They can be added, subtracted and their summaries can be subjected to statistical tests. The interval scale does not have an absolute zero. The zero point of this scale is arbitrary, but it permits inferences to be made.
One common example of the interval scaling is the Fahrenheit and centigrade scales used to measure temperature. An arbitrary zero is assigned to each scale, and equal temperature differences are found by scaling equal volumes of expansion in the liquid used in the
thermometer.
Interval scales permit inferences to be made about the differences between the entities to be measured (warmness); but we cannot say that any value on a specific interval scale is a multiple of another. Thus a temperature of 50°F is not twice as hot as a temperature of 25°F. Also, the elapsed time between 3 and 6 a.m equals the time between 4 and 7 a.m., but one cannot say 6 a.m. is twice as late as 3 a.m.
When a scale is interval, you use the arithmetic mean as the measure of central tendency. You can compute the average time of first arrival of trucks at a warehouse. The standard deviation is the measure of dispersion for arrival time. Product moment correlation, t-tests, and F-tests and other parametric tests are the statistical procedures of choice.
Ratio Scale
This is the highest level of measurement among scales. It incorporates all the powers of the previous scales plus the provision for absolute zero or origin. Ratio scale represents the actual amounts of a variable. Measures of physical dimensions such as weight, height, distance, and are examples. In business research, we find ratio scales in many areas. These include money values, population counts, distances, return rates, productivity rates.
4.2 Sources of measurement differences
The ideal study should be designed and controlled for precise and unambiguous measurement of the variables. Since attainment of this ideal is unlikely, we must recognize the sources of potential error and try to eliminate, neutralize or otherwise deal with them. Much potential error is systematic (results from a bias) while the remainder is random (occurs erratically). Seltiz C etal (1976) has pointed out several sources from which measured differences can come.
- The respondent as an error source
A respondent may be reluctant to express strong negative feelings or may have little knowledge about a personality i.e the president, but be reluctant to admit ignorance. This reluctance can lead to an interview of ‘guesses’. Respondents may also suffer from temporary factors like fatigue, boredom, anxiety, or other distractions; these limit the ability to respond accurately and fully. Hunger, impatience, or general variations in mood may also have an impact. - Situational Factors. Any condition that places a strain on the interview can have serious effects on the interviewer – respondent rapport. If another person is present, that person can distort responses by joining in, by distracting, or merely by being present. If the respondents believe anonymity is no ensured, they may be reluctant to express certain feelings.
- The measure as an error source
The interviewer can distort responses by rewording, paraphrasing, or reordering questions. Stereotypes in appearance and action introduce bias. Inflections of voice and conscious or unconscious prompting with smiles, nods, and so forth may
encourage or discourage certain replies: careless mechanical processing – checking of the wrong response or failure to record full replies – will obviously distort feelings.
In the data analysis stage, incorrect coding and careless tabulation, and faulty
statistical calculation may introduce further errors.
Instrument as an error source
A defective instrument can cause distortion in two major ways. First, it can be too confusing and ambiguous. The use of complex words and syntax beyond respondent comprehension is typical. Leading questions, ambiguous meanings, mechanical defects (inadequate space for replies, response choice omissions, and poor printing), and multiple questions suggest the range of problems.
A more elusive type of instrument deficiency is poor sampling of the universe of content items. Seldom does the instrument explore all the potentially important issues.
4.3 The Characteristics of Sound Measurement
What are the characteristics of a good measurement tool? An intuitive answer to this question is that the tool should be an accurate counter or indicator of what we are interested in measuring. In addition, it should be easy and efficient to use. There are three (3) major criteria for evaluating a measurement tool:
- Validity: This refers to the extent to which a test measures what we actually wish to measure.
- Reliability: has to do with the accuracy and precision of a measurement procedure.
- Practicality: is concerned with a wide range of factors of economy, convenience, and interpretability.
Validity in research
Validity in research is achieved through the internal and external validity of the study.
Internal validity: This refers to the outcome of the study as based on the function of the program, a study has internal validity if the outcome of the study is a function of the approach being tested rather than results of the causes not systematically dealt with.
Internal validity is justified by the conclusions we have as researchers when we have been able to control the threats of other variables (i.e intervening variables, or moderating variables or extraneous variables). The more you reduce the nuisances (other variables) affecting the study, the more you attain the internal validity. There are three widely accepted classification of internal validity:
- content validity
- criterion – related validity
- construct validity
1. Content validity
The content validity of a measuring instrument is the extent to which it provides adequate coverage of the topic under study. If the instrument contains a representative sample of the universe of subject matter of interest, then content validity is good. To evaluate the content validity of an instrument, one must first agree on what elements constitute adequate coverage of the problem.
2. Criterion-Related Validity
Criterion-related validity reflects the success of measures used for prediction or estimation. You may want to predict an outcome or estimate the existence of a current behaviour or condition. These are predictive and concurrent validity, respectively. They differ only in a time perspective. An opinion questionnaire that correctly forecasts the outcome of a union election has predictive validity. An observational method that correctly categorizes families by current income class has concurrent validity. While these examples appear to have simple and ambiguous validity criteria, there are difficulties in estimating validity. Consider the problem of estimating family income. There clearly is a knowable true income for every family. However, we may find it difficult to secure this figure. Thus, while the criterion is conceptually clear, it may be unavailable.
3.Construct Validity
One may also wish to measure or infer the presence of abstract characteristics for which no empirical validation seems possible. Attitude scales and aptitude and personality tests generally concern concepts that fall in this category. Although this situation is much more difficult, some assurance is still needed that the measurement has an acceptable degree of validity. In attempting to evaluate construct validity, we consider both the theory and the measuring instrument being used. If we were interested in measuring the effect of ceremony on organizational culture, the way in which ceremony was operationally defined would have to correspond to an empirically grounded theory. Once assured that the construct was meaningful in a theoretical sense, we would next investigate the adequacy of the instrument. If a known measure of ceremony in organizational culture was available, we might correlate the results
obtained using this measure with those derived from our new instrument. Such an approach would provide us with preliminary indications of convergent validity.
Reliability
Reliability means many things to many people, but in most contexts the notion of consistency emerges. A measure is reliable to the degree that it supplies consistent results. Reliability is a contributor to validity and is a necessary but not sufficient condition for validity. The relationship between reliability and validity can be simply illustrated with the use of a bathroom scale. If the scale measures your weight correctly (using a concurrent criterion such as a scale known to be accurate), then it is both reliable and valid. If it consistently overweighs you by six pounds, then the scale is reliable but not valid. If the scale measures erratically from time to
time, then it is not reliable and therefore cannot be valid.
Reliability is concerned with estimates of the degree to which a measurement is free of random or unstable error. It is not as valuable as validity determination, but it is much easier to assess. Reliable instruments can be used with confidence that transient and situational factors are not interfering. Reliable instruments are robust; they work well at different times under different
conditions.
4.4 Factors affecting the interval validity of a study
Among the many threats to internal validity, we consider the following:
- History
During the time that a research is taking place, some events may occur that confuse the relationship being studied. These are events may either increase or decrease the expected outcomes of the project. These are events which are not part of the project and they are not planned for. They may just happen in the process of the research and have tremendous effects on the results of the study. - Testing
The process of taking a test can affect the scores of a second test. The mere experience of taking the first test can have a learning effect that influences the results of the second test. Subjects who are given a pretest are likely to remember some of the questions or some of the errors they made when they are taking the posttest. They are also likely to do somewhat better on the posttest than they did on the pretest. - Instrumentation
This threat to internal validity results from changes between observations, in measuring instruments or in observer. Using different questions at each measurement is an obvious source of potential trouble, but using different observers or interviewers also threatens validity. Observer experience, boredom, fatigue, and anticipation of results can all distort the results of
separate observations. For example, an experienced interviewer may obtain more complete information from a correspondent than an inexperienced interviewer. The additional information may be due to the fact that the interviewer has become more skilled in asking questions or observing events and not due to the effect of the program or observing the effects of the treatment. - Maturation:
Changes may also occur within the subject that is a function of the passage of time and not specific to any particular event. These are of special concern when the study covers a long time, but they may also be factors in tests that are as short as an hour or two. A subject can become hungry, bored or tired in a short time, and this condition can affect response results. - Selection
An important threat to internal validity is the differential selection of subjects for experimental and control groups. Validity considerations require that groups be equivalent in every respect. If subjects are randomly assigned to experimental and control groups, this selection problem can be largely overcome. Additionally, matching the members of the groups on key factors can
enhance the equivalence of the groups. Validity considerations require that the groups be largely overcome. Additionally, matching the members of the groups on key factors can enhance the equivalence of the groups. - Experiment Mortality
This occurs when the composition of the study groups changes during the test. Attrition is especially likely in the experimental group, and with each dropout, the group changes. Because members of the control group are not affected by the testing situation, they are less likely to withdraw. In a compensation incentive study, some employees might not like the change in compensation method and withdraw from the test group; this action could distort the comparison with the control group that has continued working under the established system, perhaps without knowing a test is under way.
4.5 Factors affecting the external validity of the study
Internal validity factors cause confusion about whether the experimental treatment (x) or extraneous factors are the source of observation differences. In contrast, external validity is concerned with the interactions of the experimental treatment with other factors and the resulting impact on abilities to generalize to times, settings or persons.
- Reactive effects of testing:
If pre-testing has been used and which sensitizes the experimental subjects to the particular treatment, then the effect of the treatment may be partially the result of the sensitization of the pre-test. - Interaction effects of selection bias
If the samples draw from the study is not representative of the larger population, then it would be difficult to generalize findings from the samples to the population, and this may arise when the samples are not drawn randomly from the population. Consider a study in which you a cross-section of a population to participate in an experiment, but a substantial number refuse. If you do the experiment only with those who agree to participate, can the results be generalized to the total population? - Other reactive factors
The experimental settings themselves may have a biasing effect on a subject’s response to the treatment. An artificial setting can obviously give results that are not representative of large populations. Suppose workers who are given an incentive pay are
moved to a different work area to separate them from the control group. These new conditions alone could create a strong reaction condition. If subjects know they are participating in an experiment, there may be a tendency to roleplay in a way that distorts the effect of the experimental treatment.
4.6 Common effects related to the research process
There are other situations in which the internal and external validity of the study may both be threatened simultaneously. This is brought about by what we call research effects, which have nothing to do with the treatment.
1. Hawthorne Effect
This refers to a situation where subject awareness of being in an experimental group motivates them to perform better. Therefore the most influential factor on the subjects is not the independent variable but their awareness of being in a special group.
2. The placebo Effect
This is common to medical studies. Researchers observe that a drug administered to any group of parties has two effects.
- Chemical effect
- Psychological effect
To counteract this effect, researchers use a placebo and this is an inactive substance which has the same colour and tests as the active drug; Half of the subjects (experimental group) are given the active drug and the other alf (control group) are given the placebo inactive drug. If there is a significance difference between those two groups, the drug may be said to have a significance effect.