
Daily atmospheric conditions of a place at a particular time.
Elements of Weather
- Temperature
- Humidity precipitation
- Precipitation
- Atmospheric pressure
- Wind
- Sunshine
- Cloud cover
A Weather Station
A place where observation, measuring and recording of weather elements is done
Factors to Be Taken Into Account When Sitting a Weather Station
- An open place where there is little obstruction of weather elements.
- Accessible place so that recording can be done easily.
- A fairly level or gently sloping ground (5◦) so that it’s easy to position weather instruments.
- The place should provide a wide view of the surrounding landscape and the sky.
- The site should be free from flooding.
- The place should have security.
Instruments for Measuring Elements of Weather
- Thermometer-temperature
- Hygrometer-humidity
- Rain gauge-rainfall
- Barometer-air pressure
- Sunshine recorder-sunshine duration and intensity
- Wind vane –wind direction
- Anemometer-wind speed
- Evaporimeter-rate and amount of evaporation.
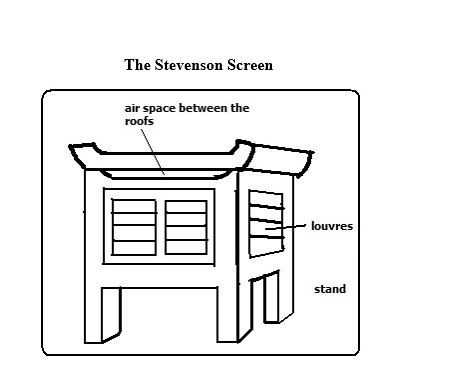
A white wooden box mounted on 4 legs used to house thermometers and hygrometers.
The instruments which are found in it are:
- Maximum thermometer
- minimum thermometer
- Six’s thermometer
- hygrometer-wet bulb and dry bulb thermometer
Importance
- Provide shade conditions for accurate temperature recording.
- Ensure safety of thermometers because they are delicate.
Qualifications Which Make Stevenson Screen Suitable For Its Work
- Painted white for little absorption of solar heat energy.
- Made of wood which is a bad conductor of heat.
- Well ventilated to allow easier flow of air inside it.
- Raised to prevent contact with terrestrial radiation.
- Has double roof which acts as an insulator to prevent direct heating from the sun.
Recording and Calculating Weather Conditions
Temperature -Degree of hotness of an object or a place.
It’s measured using 3 types of thermometers namely:
- Maximum thermometer
- Minimum thermometer
- Six’s thermometer
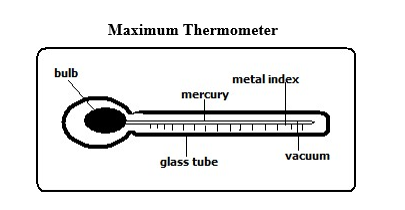
It’s used to measure the highest temperature reached in a day. It uses mercury.
How It’s Used/Works
- Temperature rises causing mercury to expand.
- Mercury pushes the index up.
- When temperature falls mercury contracts.
- The maximum temperature is read from the scale at the lower end of the index.
- Thermometer is reset by shaking it to force mercury back into the bulb.
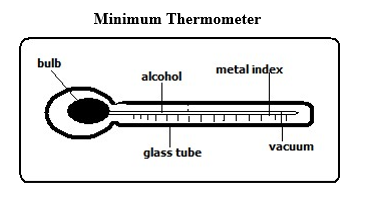
It’s used to record the lowest temperature reached in a day. It uses alcohol.
How it’s Used/Works
- Temperature falls causing alcohol to contract.
- Alcohol pulls the index down.
- When temperature rises alcohol expands and rises in the tube.
- The index remains where it was pulled.
- Minimum temperature reading is obtained from the scale at the lower end of the index.
Calculating Temperature
1. Diurnal/daily Temperature range –Difference between the maximum and minimum temperature for any one day.
2. Mean Daily Temperature
Average of the maximum and the minimum daily temperatures.
3. Mean Monthly temperature
-Sum of mean daily temperatures in a month divided by the number of days in that month.
4. Mean Monthly minimum Temperature
–Sum of daily minimum temperatures divided by the number of days in that month.
5. Mean Monthly Maximum Temperature -Sum of daily maximum temperatures divided by the number of days in that month.
6. Mean Annual Temperature -Sum of mean monthly temperatures divided by 12.
7. Mean Annual Temperature Range
–Difference between the highest and the lowest mean monthly temperatures in a year.
- ◦k=◦c+273
- ◦F=(◦c×1.8)+32 derive the rest from the formulas.
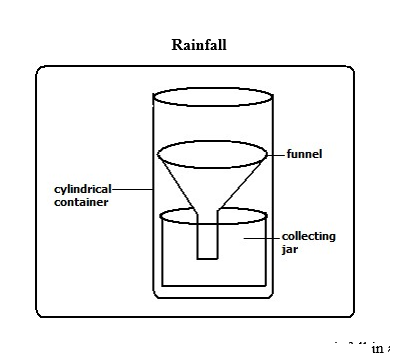
Rain gauge is the instrument used to measure the amount of rainfall in a day.
It should be made of impermeable material which can’t absorb water.
How It’s Used/Works
- It’s taken to an open space to prevent water from dropping into the funnel.
- Its sunk into the ground to prevent evaporation
- The funnel top is left 30cm above the ground to prevent splashes of water and run off.
- After 24 hours water is emptied into the measuring cylinder.
- The reading of the amount of rainfall is got from the measuring cylinder in millimetres.
- The figure represents the millimetres of water falling on each square millimetre of the ground.
It could be used to measure snow fall by melting it before the readings are gotten.
Calculating Rainfall
1. Monthly Rainfall Total –Sum of rainfall recorded in a month.
2. Annual Rainfall Total -Sum of monthly rainfall totals for 12 months.
3. Mean Monthly Rainfall
-Sum of rainfall totals for a particular month over several years divided by the number of the years of observation.
4. Mean Annual Rainfall -Sum of mean monthly rainfall for 12 months of the year.
Sunshine
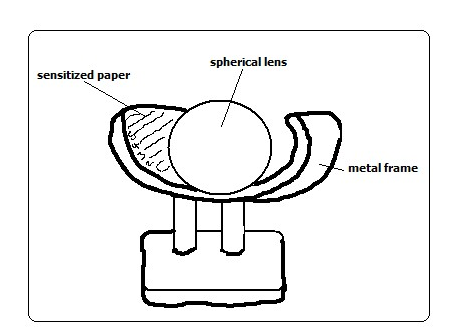
Duration of sunshine is measured using Campbell stokes sunshine recorder.
How It Works
- Spherical lens focuses light on sensitized paper.
- The paper burns when the sun is shining.
- The total hours of sunshine is got by adding all the burnt sections from calibrations on the side of sensitized paper.
- The sensitized paper is changed every day.
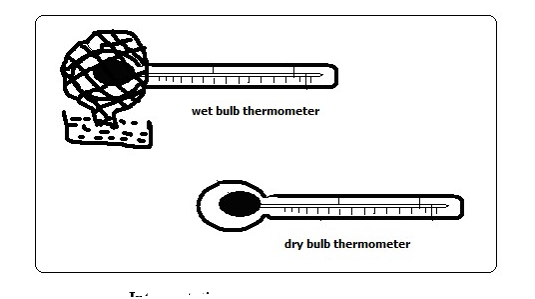
Humidity
Humidity is the condition of atmosphere with reference to its water content.
It’s measured with hygrometer or psychrometer which consists of wet and dry bulb thermometers kept in Stevenson screen.
Dry bulb thermometer is a thermometer covered with muslin bag immersed in water while dry bulb thermometer has no muslin.
How It Works
- When air is dry there is a lot of evaporation from the muslin.
- Evaporation cools the bulb of thermometer resulting in a low temperature reading.
- When humidity is high there is little evaporation from the muslin.
- The wet bulb thermometer is cooled at a slower rate and both thermometers show almost the same temperature reading.
- The difference in readings between the two thermometers is used to determine relative humidity.
Interpretation of Hygrometer Readings
- When the 2 readings are the same, relative humidity is 100% i.e. the air is saturated.
- If the difference is small, humidity is high.
- If the difference is big, humidity is very low.
Calculating Humidity Absolute Humidity
-Actual amount of water vapour a given volume of air can hold. It’s expressed in g/m3.
Specific Humidity
Mass of water vapour in a given mass of air. It’s expressed in g/km.
Relative Humidity
Ratio between the absolute humidity and the maximum amount of water the air can hold expressed in a percentage.
R.H.=A.H/Maximum amount of water the air can hold at the same temperature.
Example
If the air at 20◦c contains 10g/m3 and given air can hold a maximum of 20g/m3.calculate the relative humidity.
10×100/20=50%
Wind Direction
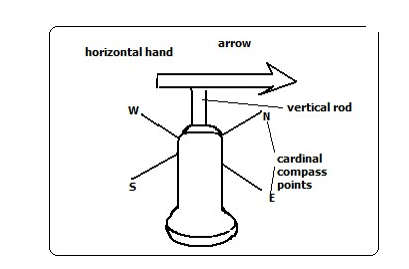
Wind direction is determined using wind vane.
How It Works
- As the wind blows the arrow swings.
- The arrow points in the opposite direction of the wind flow.
- The direction is read from the cardinal compass points.
- The arrow will point in the direction from which the wind is blowing.
- For instance if it points S the wind is blowing from S towards N.
Wind Sock
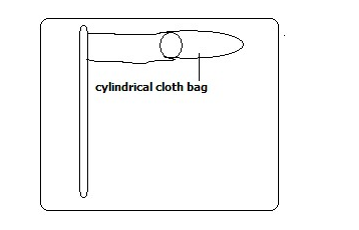
Used to indicate the general direction of wind flow.
Not kept in a weather station because it doesn’t give the accurate direction of wind flow.
Seen near airstrips for the benefit of pilots.
How it Works
When wind blows the bas stretches out in the direction that the wind is blowing.
Wind speed/Velocity
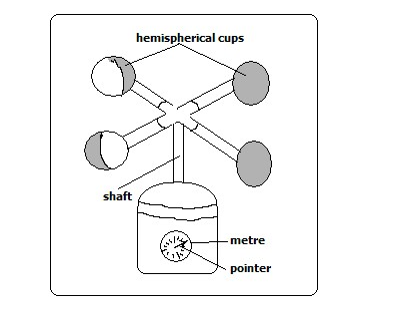
Measured using anemometer.
How It Works
- When wind bows hemispherical cups rotate.
- The number of rotations is obtained from the metre on the lower part of the anemometer.
- The units for measuring wind are called knots.
Atmospheric Pressure
The force exerted by gases in the atmosphere on some area or body on the earths surface.
Measured using barometers of three types namely mercury, aneroid and Fortin Barometers.
Mercury Barometer
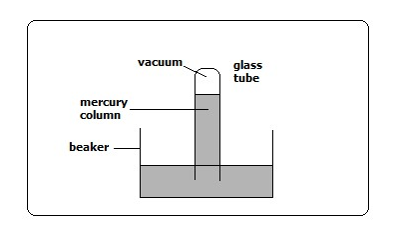
How It Works
- Air exerts pressure on the mercury in the beaker.
- The height of mercury in the tube is proportional to the atmospheric pressure.
- The readings are taken in mmHg.
- Its 760mmHg at sea level
Advantage
Quite accurate
Disadvantage
- Cumbersome to carry around.
- Can be damaged quite easily while being carried around.
Aneroid Barometer
Measures changes in atmospheric pressure.
How It Works
- Has air tight compartment (vacuum).
- Compartment expands when pressure decreases.
- It collapses when pressure increases.
- The movement is transmitted by lever to a pointer on a dial.
- The readin
- gs are in kg/cm3.
Evaporation
The rate and amount of evaporation is measured using piche and tank evaporimeters.
Piche Evaporimeter
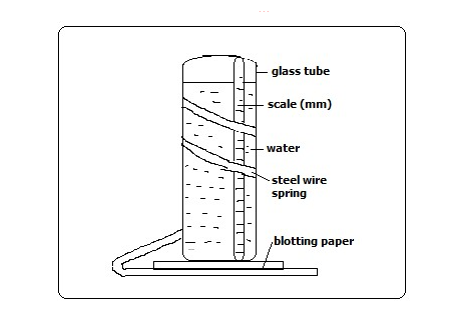
- When there is a lot of sunshine water evaporates from the blotting paper.
- The level of water in the glass tube reduces.
- The rate and amount of evaporation is got by looking at the scale on the outside of the glass tube.
- The units are in mm.
Tank Evaporimeter
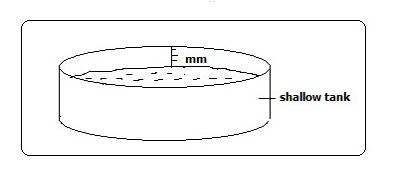
How It Works
- The tank with water is put in the open.
- Water evaporates when there is a lot of sunshine.
- Water in the tank reduces.
- The rate and amount of evaporation is got from calibrations in the inner side of the tank in mm.
Cloud Cover
The amount of cloud cover is observed using eyes.
It’s given in oktas.
Okta=approximately 1/8 of sky is covered with clouds.
Weather Forecasting
Prediction of the conditions of the atmosphere for a given place for a certain period.
Methods of Weather Forecasting
Traditional Methods -Prediction of weather based on traditional beliefs and facts.
- Plants shedding leaves indicates period of drought.
- Safari ants indicate it will rain.
- Migration of butterflies also indicates it will rain.
- Croaking of frogs during dry season indicate its going to rain.
- Flowering of certain plants indicates the onset of rainfall.
- Changes in the intensity of sunshine indicate its going to rain.
Modern Methods
Prediction of weather using modern instruments and new technology of collecting, transmitting, processing and analysing weather data.
Instruments Used
- Satellites-electronic devices which orbit the earth which collect and transmit weather data which is interpreted by computers.
- Radar-an instrument used to see cloud formation.
- Sensors/radiosodes-instrument fixed on a balloon used to measure atmospheric pressure, temperature and humidity.
- Computers-electronic device used to store, analyse and display weather information.
Significance/Importance of Weather Forecasting
- Helps us to be aware of natural calamities related to weather before they occur so as to take precautionary measures.
- Guiding tourists on when to visit national parks.
- Helps farmers to plan their activities such as planting, harvesting, etc.
- Ensures air and water transport is carried out safely.
- Helps sporting people to plan their training and competition schedules.
- Helps people to plan many other activities such as mining, electricity generation, holiday events, etc.
- Helps fishing communities to plan their activities.
Factors Hindering Weather Forecasting
- Lack of skilled man power due to limited training facilities.
- Lack of modern equipment leading to wrong forecasts.
- Natural calamities such as storms and earthquakes.
- Extreme weather conditions which may damage or displace instruments.
- Use of faulty instruments.
- Human error.
- Poor sitting of instruments.
Factors Influencing Weather Temperature
Factors influencing temperature
1. Altitude –Height above sea level.
- Temperature decreases with increase in height due to air at higher altitude being thinner and hence there is less particles e.g. gases, dust, smoke and water vapour to store heat so its rapidly lost to the outer space.
2. Latitude -Distance from the equator.
Temperature decreases with increase in latitude.
- Places neat equator experience high temperature due to the rays of the sun travelling a shorter distance facing less interference from atmospheric conditions hence more solar energy reaches the earths surface. Also the rays of the sun strike the earth at right angles hence solar energy is concentrated over a small area.
- At higher latitudes the rays of the sun travel a longer distance facing more interference from atmospheric conditions hence less solar energy reaches the earth’s surface. Also the rays of the sun strike the earth at an acute angle hence solar energy is spread over a large area.
3. Aspect -Direction of slope.
- At higher latitudes slopes facing the equator have higher temperature because they face the sun while those facing the poles have lower temperature have lower temperature because they face away from the sun.
4. Winds –Transfer heat from one place to another.
- When they blow from cool areas they take the cooling effect to the areas they blow over and when they blow from warm areas they take warming influence to the places they blow over.
5. Distance from a Large Water Body
- Areas near a large water body experience lower temperature during the hot season and higher temperature during the cool season due to sea breezes, warm and cold ocean currents and wind blowing over water which could be either warmer or cooler than the adjacent land.
6. Cloud Cover
- Clouds reduce the amount of solar energy reaching the surface by absorbing, scattering and reflecting solar radiation.
- When there are clear skies during the day the temperature is higher due to the earth receiving maximum solar insolation.
- During clear nights there are very low temperatures due to a lot of terrestrial radiation being lost to the outer space.
- Cloudy nights on the other hand are warmer due to clouds radiating to the earth heat absorbed during the day.
7. Length of Day
The longer the period of solar insolation the greater the quantity of radiation a place receives and hence the more the heat that will be generated by the earth and vice versa.
8. Solar Altitude
- At equinox when the earth is farthest from the sun the temperature on the earth is lower due to less solar radiation reaching the earth’s surface due to travelling a longer distance and hence facing great interference from atmospheric conditions.
- At solstices the earth receives more solar energy due to travelling a shorter distance and hence facing less interference from atmospheric conditions.
9. Solar Input
- Sometimes the sun gives out more heat due to reactions being violent causing temperature on the earth to be higher.
- When it gives out less heat the temperature on the earth is lower.
10. Surface Conditions
- Light surfaces e.g. smooth surfaces reflect sunlight and hence less solar energy reaches the earth’s surface.
- Dark and irregular surfaces such as with vegetation absorb more heat leading to higher surface temperatures.
Humidity
Factors Influencing Humidity
1. Temperature
- Places with high temperature experience high humidity due to high evaporation and air having high capacity to hold moisture.
- Places with low temperature have low humidity due to low evaporation and air having low capacity to hold moisture.
2. Source of Moisture
- Areas near water bodies e.g. Kisumu and Mombasa experience high humidity due to evaporation of water from the water body.
- Places near thick vegetation also have high humidity due to evapotranspiration.
- Areas far away from water bodies such as the middle of deserts have low humidity.
- Areas receiving heavy rainfall also have high humidity.
3. Air Pressure
- There is high humidity at low altitudes because high pressure compresses air warming it increasing its capacity to hold moisture and also causes high evaporation.
- There is low pressure at high altitudes because air expands and cools thus reducing its capacity to hold moisture.
4. Latitude
- Low latitudes experience high humidity due to high temperatures resulting into high rates of evaporation and air having high capacity to hold moisture.
- High latitudes experience low humidity due to low temperatures resulting into low rates of evaporation and air having low capacity to hold moisture.
Significance of Humidity/Moisture
- Affects rain formation in such as way that places with high humidity are likely to experience higher rainfall than those with low humidity.
- Regulates the heat loss from the earth’s surface by absorbing terrestrial radiation (process in which the earth gives off heat into the atmosphere).
- It affects sensible temperature in that the higher the humidity the more we experience sensible temperature.
Precipitation
-The forms in which the earth’s surface receives moisture.
1. Snow
Solid precipitation formed when tiny water droplets freeze and form ice crystals.
The crystals may fuse to form flakes.
2. Sleet
-Precipitation which is a mixture of rain and snow.
3. Hail
Roughly spherical lumps of ice formed when super cooled cloud droplets mould themselves around ice crystals before cooling. It destroys crops life and house roofs.
4. Dew
-Precipitation consisting of water droplets formed on cold surfaces at night e.g. iron roofs and glass blades.
How It’s Formed
- In a clear night there is a high ground radiation.
- Temperature of the earth’s surface fall below dew point (temperature at which air being cooled becomes saturated). Excess water condenses on cold surfaces.
5. rain
-Precipitation consisting of water drops/droplets formed when tiny water droplets merge around particles of matter and become heavy and fall down to the earth.
6. Condensation
Turning of water vapour into tiny water droplets as cooling continues below dew point.
The droplets join to form clouds.
Causes of Condensation
- Adiabatic cooling-cooling of moist air as it rises vertically.
- Orographic cooling-cooling of moist air as it climbs a hill or mountain.
- Frontal cooling-cooling of warm air mass when it blows towards a cold air mass.
- Advection cooling-cooling as a result of moist air moving over a cool land or sea.
How Condensation Takes Place/Cloud Formation
- Moist air rises to the condensation level (altitude where temperature is below dew point.
- It’s cooled below dew point.
- Tiny water droplets condense around tiny particles such as dust, smoke particles and pollen grains and salt particles (condensation nuclei).
- The droplets merge and eventually become bigger and fall as rain.
- If moisture rises to an altitude where temperature is below 0◦c the condensed water droplets freeze forming ice particles or super cooled water (water which has remained in a liquid state at temperatures below freezing point due to lack of sufficient condensation nuclei.
- Super cooled cloud droplets may mould themselves around ice crystals before freezing to form hail.
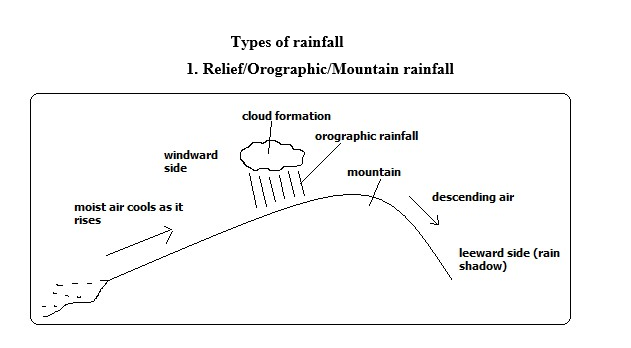
Rain experienced on the windward slopes of mountains or hills formed when moist air is forced to rise over a mountain or a hill.
How it Forms
- Moist air is forced to rise over a hill or mountain.
- The temperature and air pressure decreases making it to expand.
- Air cools due to decreased temperature and decreased pressure causing it to expand.
- Moisture condenses forming tiny water droplets (clouds).
- The tiny water droplets in clouds merge and become too heavy to be suspended in air and fall as rain.
- Air proceeds to the leeward side with low moisture content.
- Since its heavier due to being cool it descends over that side and gets warmed making it to hold onto the little moisture it had causing that side to receive low rainfall (rain shadow).
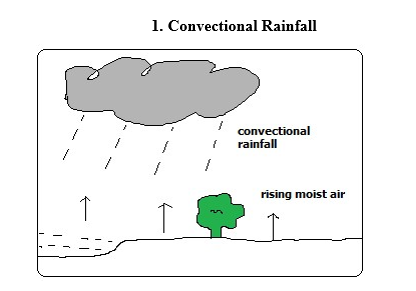
Type of rainfall common near large water bodies formed as a result of convective rising and cooling of moist air.
It’s accompanied by thunderstorms.
How it forms
- Ground or water body is heated causing evaporation.
- There is convective rising and cooling of moist air.
- Condensation takes place forming tiny water droplets (clouds).
- The droplets merge and fall as rain.
- The cooled dry air descends to the surface where its heated and its capacity to hold moisture is increased.
- The process is repeated.
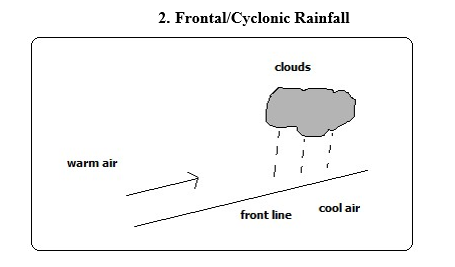
Type of rainfall common in mid-latitudes formed when warm air blows towards a cold area or when warm air mass meets with a cold air mass.
It’s accompanied by cyclones (violent winds).
How it Forms
- Warm moist air mass meets with a cold air mass.
- The warm air is forced to rise as it’s less dense.
- It cools as it rises at the line of contact with cold air.
- The moisture condenses forming clouds resulting in frontal rain.
Factors Influencing Rainfall Types and Amounts
1. Relief/Topography
Relief features such as mountains and hills results in the rising and cooling of moist winds to form relief rainfall.
2. Aspect
Windward slopes which are on the path of rain bearing winds receive heavier rainfall than leeward slopes which face away.
3. Forests and Water Bodies
Areas near forests and large water bodies experience higher rainfall and more often due to high rate of evaporation.
4. air pressure
High pressure areas receive low rainfall than low pressure areas due to pushing of air masses from high pressure to low pressure. The high pressure areas have descending dry air.
5. air masses
When warm and cold air masses meet frontal rainfall is formed.
6. Ocean Currents
- It influences rainfall whereby coasts washed by warm ocean currents experience heavy rainfall when moist onshore winds are warmed by the current and made to hold on to moisture which they release on reaching the land.
- The coasts washed by cold ocean currents on the other hand experience low rainfall as a result of moist winds being cooled and moisture in them condensed resulting in rain falling over the ocean thereby bringing little or no rain to the coastal areas. This is the cause of western margin deserts e.g. Kalahari and Namib deserts.
Atmospheric pressure Factors Influencing Atmospheric Pressure
1. Altitude
Pressure decreases with increase in altitude because the column of air becomes shorter hence it exerts less weight.
2. Temperature
- When air is heated it expands and exerts pressure over a large area resulting in reduced pressure.
- When it’s cooled it contracts and exerts pressure over a small area resulting in increased pressure.
3. Rotation of the earth
- Rotation pushes air masses from poles towards the equator causing air to spread out and occupy more space causing it to expand making pressure to decrease.
- When air from the equator moves towards the poles it occupies less space causing it to contract resulting into high pressure.
Mist and Fog
Mist and fog are a mass of tiny water droplets suspended in the lower layers of the atmosphere.
Fog is denser than mist i.e. has more moisture.
Both hinder visibility although fog reduces visibility to less than a kilometre.
When fog mixes with smoke its called smog.
How They Form
- Moist air cools below dew point.
- Condensation takes place.
- The resultant water droplets remain suspended in the air.
Types of Fog
1. Radiation Fog
Type formed when moist air is cooled below dew point as a result of intense radiation on the ground at night.
2. Advection Fog
- Type formed when moist air from the sea moves horizontally over a cold surface e.g. snow covered ground.
3. Orographic/Hill/Upslope Fog
- Type formed when moist air is cooled after climbing a hill or mountain.
3. Evaporation Fog
Type formed when water vapour is added to cold air that is already near saturation causing excess water vapour to condense and form fog.
4. Frontal Fog
Type formed when warm moist air is cooled from below as it rises over a cold air mass.
5. Steam Fog
- Type formed when moist air passes over the surface of a much warmer fresh water body.
- The warm water is cooled from above and condensing water vapour forms fog.
It appears to be steaming.
6. Ice Fog
Type formed when water vapour is converted directly into ice crystals when temperatures are below freezing point.
Clouds
Are a mass of tiny droplets or ice particles formed when water vapour condenses.
Three Cloud Forms
1. Cirroform -Thin and wispy clouds composed of ice crystals.
2. stratiform
Appear as greyish sheets covering most of the sky and are rarely broken into units.
3. Cumuliform
Are massive rounded with a flat base and limited horizontal extent and billow upwards to great heights.
Basic Cloud Types
1. Stratus Clouds
Are found in layers, are flat in shape and resemble fog.
2. Nimbus Clouds
are dark at the base and sometimes white at the sides and cause rain and thunderstorms.
3. Cirro-cumulus -Are white clouds consisting of white ice crystals.
4. Nimbostratus
A rain cloud which is dark grey and spreads over the sky in low uniform layers.
5. Cumulus Clouds
Clouds with a flat horizontal base, massive, rounded and less horizontal extent.
6. Alto cumulus
-High clouds composed of ice crystals which indicate fair weather.
World distribution of Pressure Zones and the Planetary wind System/World Prevailing Winds
The Equatorial Low pressure Zone (ITCZ-low)
- Found between 23 ½ ◦N and 23 ◦N
- Experiences high temperatures.
- A zone of low pressure and doldrums (light and intermediate winds).
- Zone where S.E and N.E Trade Winds converge.
- Associated with convectional rain and thunderstorms.
- Migrates to the N and with the apparent movement of the overhead sun.
The Sub-tropical High Pressure Zone
- Found within 30◦N and 30◦S.
- A zone of high pressure.
- A region of calm descending air.
- Source of Trade Winds and Westeries.
- Zone of divergence of T. Winds and Westeries.
The Temperate Low Pressure Zone
- Found within 60◦N and 60◦S.
- A low pressure zone.
- Zone of convergence of westeries and polar easteries.
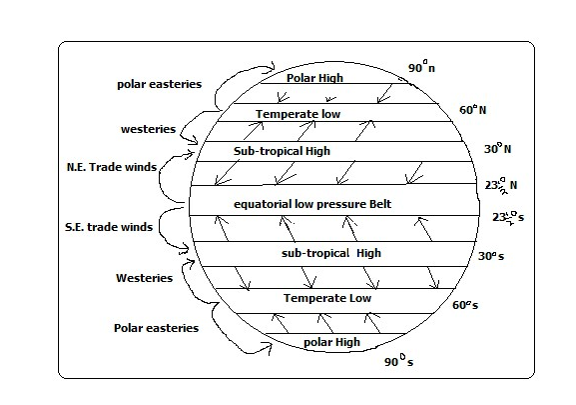
The Polar High Pressure Zone
- Found over the poles 90◦N and 90◦S.
- A high pressure Zone.
- Zone of descending calm air of low temperature.
- Source of polar easteries.
The Worlds Prevailing Winds
These are the major winds blowing over the earth frequently and consistently and which influence the world weather.
1. Trade Winds
Blow from sub-tropical high pressure zone and blow to the equatorial low pressure belt.
2. Westeries
Originate from sub-tropical high pressure zone and blow to the temperate low pressure belt.
3. The Polar Easteries
Originate from polar high pressure zone and blow to temperate low pressure zone.
Monsoon Winds
- Seasonal winds which reverse in the direction of flow.
- They blow towards the land during summer (onshore) and from the land during winter (off shore).
- Bring heavy rains when onshore which can cause severe flooding.
- Well developed in the Indian Sun-continent, china, Japan and S.E Asia.
Air Masses
Distinct large parcels of air moving in one direction
Originate from areas of uniform weather and topography from where they derive their characteristics e.g. flat areas, forests, deserts, and snow covered areas.
Characteristics of Air Masses
- A large volume of air.
- Covers an extensive area.
- Has uniform temperature and humidity.
- Distinct from the surrounding air.
- Retains its characteristics when it moves away.
Types of air Masses
1. Equatorial Air Mass
- Originate from equatorial oceans.
- It’s hot and unstable.
2. Sub-tropical Air Mass
- Forms near sub-tropical high pressure belt.
3. Polar Air Mass
- Forms near the poles or temperate low pressure zone.
- It’s cool.
Arctic and Antarctic air Masses
- Forms over the ice sheets of Greenland and Antarctica respectively.
Effect of air masses on Weather
- When warm moist air mass and cool air mass meet cyclonic rainfall is formed e.g. tropical maritime and polar maritime.
- Cool air masses take cooling effect to the areas they move to e.g. polar continental.
- If they are warm they take warming influence to the area they move to e.g. tropical continental.
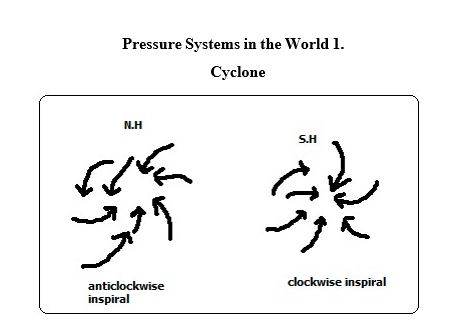
- It’s a low pressure system characterised by low pressure at the centre and increases outwards.
- Starts in areas where air ascends from the ground to the atmosphere and descends at high altitude.
- It’s of two types. Tropical cyclones e.g. hurricane, typhoon and willy willies and depressions which are characterised by temperate latitudes.
- The movement of wind is anticlockwise in the N. hemisphere and clockwise in the S. hemisphere.
2. Anticyclone
- A high pressure system characterised by high pressure at the centre and decreases outwards.
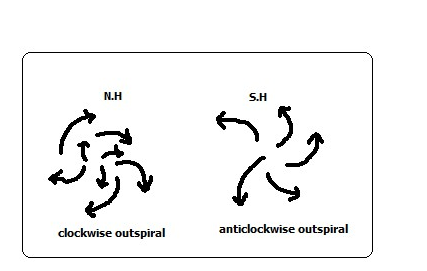
- It starts in areas where air is descending from the atmosphere onto the ground and then blows outwards on the ground.
- The movement of wind is clockwise in the N. hemisphere and anticlockwise in the S. hemisphere.
Local Winds
Which occur regularly for a short period of time affecting a limited area.
Modify the weather of the area they blow to.
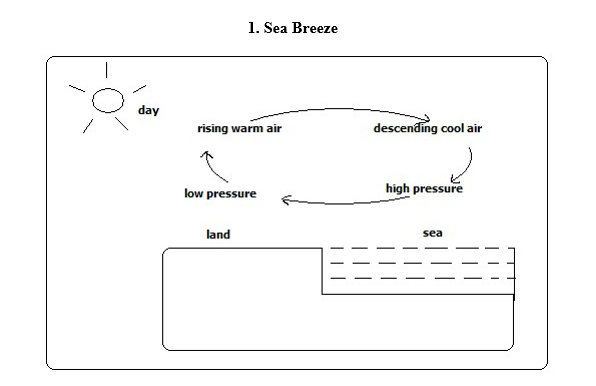
A light and gentle wind which blows from the sea to the adjacent land.
How it Forms
- During the day land is heated faster than the sea.
- Air over the land is warmed and rises.
- Air from the sea moves to the land to replace the rising air.
- The rising air from the land cools and descends over the sea at high altitude.
- Circulation continues until the pressure difference is reversed at night.
Effects on weather It takes cooling effect on land on a hot afternoon.
Land Breeze
A light and gentle wind which blows from land to the sea during the night.
How it Forms
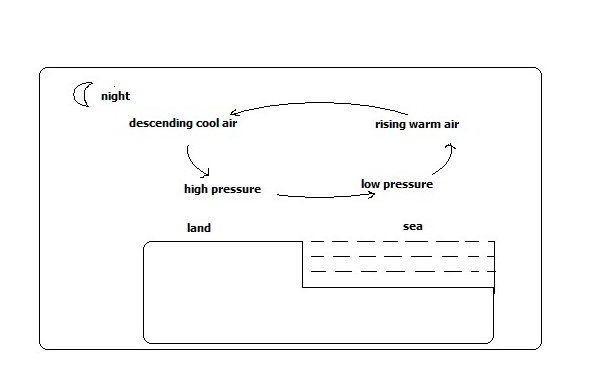
- At night land loses heat faster than the sea.
- Air over the sea is warmed and rises.
- Air from the land moves to the sea to replace the rising air.
- Rising air from the sea descends over land at high altitude.
- Circulation continues until pressure difference is reversed during the day.
Effects on weather
It causes early morning showers through moisture brought towards land at high altitude.
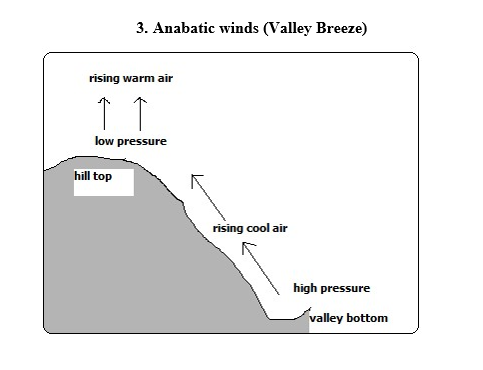
Cool local winds which blow from the valley to the hill tops during summer afternoons.
How it Forms
- During the day hill tops are heated more than valley bottoms.
- Air over the hill tops is warmed and rises.
- Cool air over the valley move up to the hill to replace the rising air.
Effect on weather
Cause afternoon showers on hilly grounds.
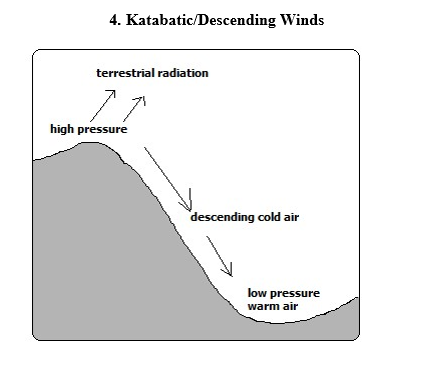
Cold local winds which blow from hill tops to the valley during the night.
- During the night hill tops lose heat faster than the valley.
- Air over the valley is warmed and rises.
- Cool air over the hill tops move to the valley by gravity to replace the rising air.
Effect on Weather –Takes chilly conditions on valley bottoms.
5. Harmattan Winds
-N.E winds which originate from Sahara and blow across W. Africa between November and March taking dry conditions there.
6. Fohn Winds (Alps)
-Local cold winds which slide down the leeward side of the mountain at high speed and are warmed producing a temperature rise.
Due to the high speed and temperature they are associated with wild fires. They are known as Chinook in Rocky Mountains, Santa Anas in California and Mistral in France.
Factors influencing Wind Flow (Speed and direction)
1. Pressure Gradient
If the pressure difference between high and low pressure areas is high the winds blow at high speed (strong) but if it’s low they blow at high speed (are gentle).
2. distance between Places of High and Low Pressure
if the high and low pressure areas are near each other winds blow at high speed but if distant from each other winds blow at low speed.
3. Rotation of the earth
Rotation of the earth deflects winds to the right in the N. hemisphere and to the left in the S. hemisphere.
4. Frictional Force
If the surface of the earth is rugged or has obstacles such as hills, mountains, valleys or vegetation the wind is blocked causing speed reduction and its direction of flow is also changed.
STATISTICS
Statistics-numerical figures collected systematically and arranged for a particular purpose.
Statistical data-information presented inform of numbers e.g.
- of students in a school
- Mean daily temperature of a place
- Amount of milk produced daily from a farm 4. Amount of money earned from exports annually.
Statistical methods-techniques of collecting, recording, analysing, presenting and interpreting statistical data.
Significance of Statistics
Illustrates relationship between 2 or more varying quantities e.g. beans production and acreage under cultivation.
Summarises geographical information which saves time and space.
Makes comparison between components e.g. province with the highest number of people.
Prediction of future trends of weather and climate.
Prediction of natural disasters e.g. droughts and floods.
Planning for provision of social amenities e.g. hospitals and schools.
Types of Statistical Data primary Data
-First hand or original information from the field e.g.
Mean daily temperature from a weather station
Enumeration/census
Secondary/Derived Data
-2nd hand information available in stored sources compiled by other researchers e.g.
- Textbooks
- Reference books
- Maps
- Video/audio tapes
- Textbooks
- Newspapers
- Magazines
- Census reports
- Slides
- Census reports
Nature of Statistical Data
1. Discrete Data –Which is given in whole numbers e.g. 16 elephants
1093 tonnes of wheat
2. Continuous Data
-Facts and figures which can take any value e.g.
- Fractions e.g.23 ¼
- Decimals e.g. 6.20 mm
- Values within range e.g. 0-30◦c
3. Grouped Data
Which is non precise/exact but values range in groups
Sources of Statistical Data
1. Primary Sources
People or places which have 1st hand or original information. The information can be collected by observation, measuring, counting, photographing etc.
Advantages
- Give first hand information
- The information cant be got from other sources
2. Secondary sources
Materials in which information collected by others was stored e.g. text books, reference books, etc.
Methods of Collecting Data (statistical Techniques)
1. Observation
-Use of eyes to observe features or weather then information is recorded immediately e.g. cloud cover, rocks, soil, land forms, vegetation, etc.
Advantages
Gives 1st hand information which is reliable. Relevant material to the study is collected.
Time saving since one doesn’t have to look for data in many places.
Disadvantages
- Data on past activities isn’t available.
- May be hindered by weather conditions e.g. mist and dust storms.
- Ineffective for people with visual disabilities.
- Tiresome and expensive as it involves a lot of travelling because physical presence is required.
2. interviewing
-Gathering information from people by direct discussions then answers are recorded. It may be face to face or on a telephone. A questionnaire prepared in advance is used.
Guidelines
One should be polite
Warm and friendly
Respondents/ interviewees should be assured information is confidential.
Respondent should not be interrupted when answering questions.
They should not be given clues but answers should come from them.
Advantages
Reliable first hand information is collected.
Interviewer can seek clarification incase of ambiguity of answers.
Can be used on illiterate.
Interviewer can gauge the accuracy of responses.
Disadvantages
- Time consuming since one person can be handled at a time.
- Expensive and tiresome as extensive travelling is required to meet the respondents.
- May encounter language barrier if the respondent doesn’t speak the same language as the interviewer.
- A respondent may lie, exaggerate or distort facts leading to collection of wrong information.
3. Administering questionnaires
Set of systematically structured questions printed on paper used on interviews or sent to respondents to fill answers.
Types
- Open-ended questionnaire-in which respondent is given a chance to express his views. The disadvantage is that different answers are given which are difficult to analyse.
- Closed-ended (rigid) questionnaire-in which respondents are given answers to choose from.
Characteristics of a good questionnaire
- Short
- Uses simple language
- Systematically arranged from simple to difficult
- Clear questions
- Doesn’t touch on respondent’s privacy
Advantages
- Comparisons can be made since questions are similar.
- First hand information which is relevant to current trends and situation is collected.
- Saves money on travelling as physical presence isn’t required.
- Saves time as all respondents are handled at the same time.
- A lot of information can be collected.
Disadvantages
- Difficult analysis due to different answers.
- Some questionnaires may be sent back while blank by lazy respondents.
- Can’t be used on illiterate respondents.
- Some respondents may write wrong information.
Content analysis -Technique of collecting data from secondary sources.
This is by reading, watching films, viewing photographs and listening to get what is relevant.
Advantages
- Easy to get data if analysed.
- Cheap as there isn’t extensive travelling
- Saves time as all information is in one place.
- Possible to get old data
Disadvantages
- Difficult to verify accuracy of data
- Data may be irrelevant to current trends
- Up to date data may not be readily available
5. Measuring
-Determining distances, areas, height or depth using instruments and recording.
Distance can be estimated by pacing or taking steps of equal and unknown length.
6. Collecting Samples
-Getting a small part e.g. of soil, rock or vegetation to represent the whole to be used to carry out tests in the laboratory.
7. Counting/census taking -Arithmetical counting and recording.
8. Photographing -Capturing on film or video and still photographs.
9. Digging
Using tools such as hoe pick axe, spade or soil auger to get samples of soil and rocks.
10. Feeling and touching
Using fingers to feel the surfaces of soils and rocks to get their textures.
11. sampling
Examining by taking a sample -a part representing the whole (population).
Types of Sampling
1. Random Sampling
Selection of members of a group haphazardly where every item has an equal chance of being selected e.g. to select 5 students to go for a tour from a class:
- Class members write their names on pieces of paper
- They are folded and put in a basket
- The basket is shaken and fives papers are taken out
2. Systematic Sampling
Selection of members of a sample from an evenly distributed phenomena at regular intervals e.g. after every 10 items/members.
3. Stratified sampling
Selection of members of a sample by breaking the population into homogenous groups e.g. to select 6 students to go for a tour:
- Break the class into boys and girls
- Select 3 student from each group by random or systematic sampling Combine units from each group to form the required sample.
4. Cluster Sampling
Selection of sample by dividing the sample into clusters with similar characteristics then a sample is taken from each cluster and representative choices from each cluster are combined to form a sample e.g. to sample the housing cost an estate is chosen to represent each group and representative choices are chosen from each estate and combined to form a sample.
Advantages
- It’s less expensive
- It saves time
- It avoids bias
Disadvantages
- A poor selected sample can lead to misleading information
- Systematic sampling to an evenly distributed population
Experimentation
Conducting a test or investigation to provide evidence for or against a theory e.g.
to determine the chemical composition of rocks and soils.
Advantages
- First hand data is obtained
- Gives accurate results if properly conducted.
- It can lead to further discoveries
Disadvantages
- May be expensive as it involves use of expensive equipment.
- May be time consuming
- Use of defective instruments may lead to inaccurate results
- Improper handling of equipment and chemicals may lead to accidents
Methods of Recording Data
Methods off storing information to avoid losing it.
1. Note Taking
Writing in a note book what is being observed, answers during interviews and then notes are compiled in school or office when writing report.
2. Filling In Questionnaires
Filling answers in questionnaires which are responses from a respondent by an interviewer or respondent himself which he/she then sends back.
3. Tallying
Making 4 vertical or slanting strokes and the 5th across the 4 to record data obtained by counting or measuring similar items.
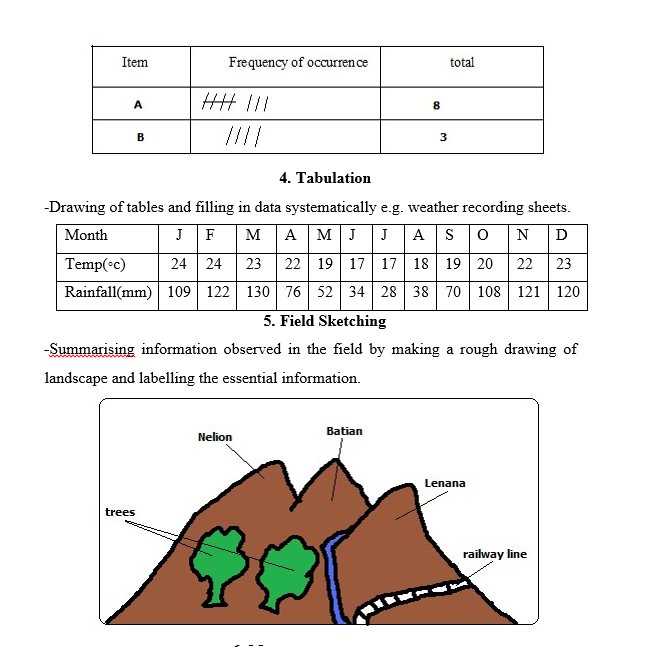
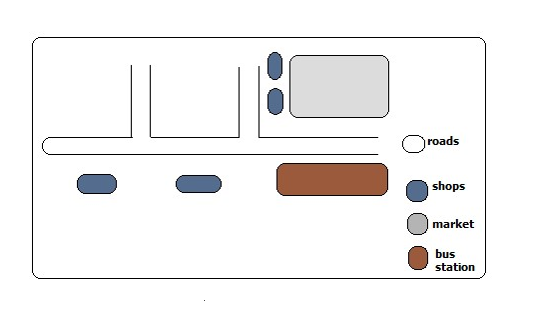
6. Mapping/Drawing Maps
Drawing of a rough map of an area of study and labelling in words or symbols accompanied by key.
7. Tape Recording
Recording image of an object or landscape on a film which is processed to get a photograph then the photographs are labelled to avoid mix up during storage.
8. Labelling samples
Recording conversations during interviews on audio tapes using a tape recorder.
Permission should be got from the respondent to record his/her responses.
Advantages
- It’s used if responses are too many to be recorded on a note book.
- It allows smooth flow of discussion as asking respondents to repeat answers would irritate them.
Analysis of Data -Examining the numerical figures in detail.
Techniques of analysing Data
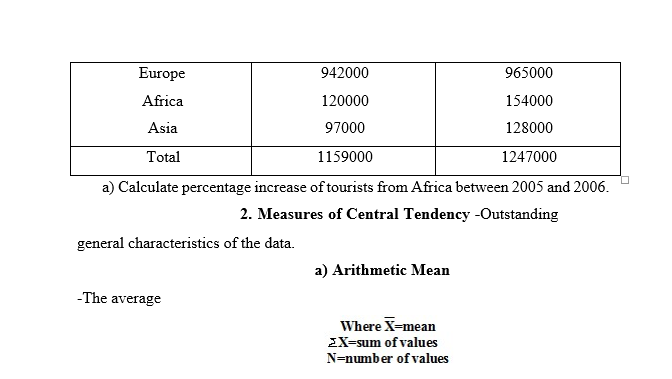
1. Calculation of Percentages
If in the study of a farm 10 hectares are devoted to coffee, what is the % of the area under coffee?
10/100×10%
The table below shows the number of tourists who visited Kenya from various parts of the world in 2006.
Advantages
- Easy to calculate for a small data
- Summarises data using a single digit
- Easy to understand and interpret
Disadvantages
- Difficult to calculate for grouped data
- Affected by extreme values
Median
–The middle value in a set of data arranged in order. M= (N+1)/2
- 20, 50, 90, 100, 150, 180, 200, 220, 240, 300, 360.
- 20, 50, 90, 100, 150, 180, 200, 220, 240, 300.
Advantages
- Easy to calculate in a small data set
- Easy to understand as it’s the value at the middle
Disadvantages
- Difficult to calculate in a large data set
- Doesn’t show data distribution
Calculation of Ranges
Difference between the largest and smallest values. Calculate the range of for the data above.
Mode
Most frequently recurring value in a set of data.
10, 2, 5, 9, 10, 11, 20, 15, 18, 10. The mode is 10.
Advantages
- Easy to find as no calculation is involved
- Easy to understand
Disadvantage
- Rarely used as a measure of central tendency
Statistical Presentation of Data
FIELD WORK
–Scientific study of geography using the environment as a laboratory or source of information.
Types of Field Work
1. Field Excursion
-Visiting an area near or far from the school to see geographical phenomena then note down and discuss later in class.
Aim
- Reinforce what has been learnt in class
- Gain more geographical knowledge
- Identify and appreciate geographical features
- Identify problems of geographical interest
2. Field Research
Systematic problem solving done by experts in which scientific methods of collecting, recording and analysing data are used.
3. Field Study
Study conducted within a neighbourhood in which one theme is pursued e.g. ‘A study of a local farm’.
Importance of Field Work
- Reinforces what has been learnt in class.
- Enables one to gain more geographical knowledge.
- It breaks the monotony of classroom work.
- It provides learner with practical skills of collecting, recording and analysing data and report writing.
- Gives students an opportunity to go out and practise what they have learnt in class.
- Enables students to familiarise themselves with the environment and develop a positive attitude towards it.
- Enables students to develop a positive attitude towards manual work.
- Promotes development of virtues like cooperation by working in groups.
Field Work Procedure (Steps Followed)
1. Identification of Topic/Theme
Reason why you want to carry out field study e.g. ‘A study of rocks around the school’
2. Identification of the Area of Study
Determining the area to be used for study.
Should be chosen carefully to ensure that the field study is successful.
Conditions It Should Meet
- Should contain sufficient information
- Should be within a convenience distance to reduce expenses
Statement of Objectives
Stating aims of carrying the field study.
Act as guidelines to activities to be undertaken during field work.
They should be simple, brief, testable and achievable. E.g. for the topic ‘A study of a local farm’ objectives could be stated as follows:
- To find out methods of farming in a local farm
- To identify the cattle breeds in the farm
- To investigate the problems facing the farm.
- Formulation of Hypotheses
Assumptions set before field work whose validity or acceptance is to be proved.
Types of Hypotheses
Null Hypothesis (Ho)
One stated in negative form e.g. ‘There is no relationship between rainfall and crop yield’.
Alternative/Substantive hypothesis (H1)
One stated positively e.g. ‘most foodstuffs sold in the neighbourhood don’t come from the immediate neighbourhood’.
Quantitative words should be used e.g. more, most, majority. It should not be obvious.
Preparation of the Field Study
It involves:
1. Seek Permission from Relevant Authorities –Seeking permission from school and authority in the area you are visiting. It is important to:
- To avoid being denied permission to enter there
- Enables individuals to set early the suitable date and time of visit
- Helps to arrange for a guide to conduct you around
2. Conduct Reconnaissance (Pre-Visit) –A familiarisation tour of the intended area of study. It is important to:
- To determine appropriate routes to be taken
- Enables to get documents from officials
- Helps one to identify the appropriate methods of data collection
- Helps to identify appropriate equipment to be used
3. Hold Discussion In Class -Looking through formulated objectives and hypotheses. It’s important to:
- Determine their suitability
- Make adjustments
- Decide upon data recording methods
4. Preparation of a Questionnaire
Important where the interviewer is not able to be with respondents for a long time.
5. Dividing Into Groups
- To ease congestion in the area of study
- To create order during field work
- To reduce fatigue among participants
- To help participants collect data within the time given
6. Preparation for Documents
- Topographical maps to show the routes you will follow
- Tables for filling in information
- Permission documents
7. Reading Through Relevant Books
Reading about the topic and the area of study
Important in that it helps participants to know:
- The kind of data they need to collect
- The techniques to be employed in the field.
8. Preparation of a Work Schedule –A timetable to be followed on the day of field study.
It is important to:
- Indicate the specific time when each activity should take place
- Reduce time wastage by ensuring proper time management
- Ensure all important areas are covered and none is forgotten
- Provide an estimate of total time required for study
9. Selection of Important Tools and Equipment -Tape measure and rulers for measuring, pencils for drawing sketch maps, notebooks for writing notes, polythene bag for sorting and carrying samples, cameras for taking photographs, geological hammer getting rock samples and hoe for digging to get soil samples, etc.
10. Carrying Out the Field Study
Setting off to go to the area of study to look for data where techniques of collecting and recording data are applied.
Follow Up Activities
After data is collected and recorded it’s summarised in the following ways:
- Discussing the findings in class giving reports through group leaders
- Writing reports in essay form
- Calculation of percentages, means, medians and modes
- Laboratory testing of samples
- Presentation of data using methods such as graphs, pie charts, etc.
Problems Encountered in Field work
1. Language Barrier
Inability to communicate due to the interviewer and the respondent not sharing the same language or respondents may be illiterate and thus unable to fill questionnaire. The problems are:
- Data may not be collected
- Illiterate people may give wrong answers while attempting questionnaires
- An interpreter may have to be engages who would be paid which would raise costs.
- Answers may be distorted by the interpreter
2. Hostility
Those being approached to give answers may become harsh due to feeling that their time is being wasted which would cause the field study to be unsuccessful.
3. Dishonest Respondents
-Respondents giving wrong information due to suspicion fear of shame or superstition.
4. Bad Weather
Raining heavily making it impossible to proceed with data collection and difficulty in movement.
Becoming very hot making participants uncomfortable and thus unable to proceed with data collection smoothly.
Becoming misty or foggy causing invisibility problems.
5. Accidents in the Field
One may fall and get inured when walking on rugged areas.
Injuries may result when using tools to get samples by cutting using pangas or knives and digging using hoes.
6. Attacks by Wild Animals
Participants may encounter wild animals when carrying out the study in bushy areas e.g. snakes which may bite them, rhinos which may charge at them, etc.
7. Inaccessibility
physical barriers such as swamps, rivers without bridges, steep slopes and thick vegetation may hinder participants from reaching areas with vital information.