
MONDAY: 1 August 2022. Afternoon paper. Time Allowed: 3 hours.
This paper has two sections. SECTION I has twenty (20) short response questions. SECTION II has three practical questions of sixty (60) marks. All questions are compulsory. Marks allocated to each question are shown at the end of the question.
SECTION I
1. You have been provided with a dataset that is not labelled, to discover hidden patterns in data using machine learning. Which tasks of machine learning is the most suitable for this kind of a task? (2 marks)
2. Name the component of the star schema that is used to store the measurements and the unique identifier as used in logical design of the data warehouse (2 marks)
3. A ________________ is a structure that includes a root node, branches, and leaf nodes. Each internal node denotes a test on an attribute, each branch denotes the outcome of a test and each leaf node holds a class label. (2 marks)
4. A ________________ schema, is a multidimensional representation which contains two facts table that shares dimensions between them. (2 marks)
5. The process of grouping related values together to reduce the number of distinct values for an attribute in data mining is referred to as ________________________. (2 marks)
6. _____________ is the process of the staging layer of the data warehouse architecture that does the aggregation, summarisation and change the format, structure and sift through data. (2 marks)
7. The data warehouse characteristic where data is maintained via different intervals of time such as weekly, monthly, or annually is known as ______________________. (2 marks)
8. Write a python programming code to slice a list called “mynumbers”, to display all the elements except the first element. (2 marks)
9. The process of discovering potentially useful, interesting, and previously unknown patterns from a large collection of data useful for business decision making is known as ___________________________. (2 marks)
10. The number of times the algorithm sees the entire data set in during the training process is called _______________. (2 marks)
11. The Online Analytical Operation (OLAP) that perform aggregation on a data cube by climbing up a concept hierarchy for a dimension is called ________________. (2 marks)
12. The data classification method that classifies a point by calculating the distances between the point and points in the training data set by assigning the point to the class that is most common is referred to as _____________________.
13. The subject-oriented data repository used for the analytical purposes of the specific group is called a ____________ (2 marks)
14. The data warehouse control panel that describes the data and analytics system is known as ___________. (2 marks)
15. In machine learning, after the development of a classifier model, you need to measure the performance of the classifier. Name the technique which generates a tabular summary of the number of correct and incorrect predictions made by a classifier. (2 marks)
16. _______________ is the data warehouse operation that selects two or more dimensions from a given cube and provides a new sub-cube. (2 marks)
17. ___________ algorithm is a probabilistic classifier that uses probability of a prediction from the underlying evidence as used in data mining techniques. (2 marks)
18. A ____________ is a structure that categorises data in order to enable users to answer business questions such as sales, inventory or marketing as used in data warehouse schema design. (2 marks)
19. An ____________________ is an observation or a data point that lies an abnormal distance from other values in a random sample from a population. (2 marks)
20. A _______________ schema is a database organisational structure optimised for use in a data warehouse or business intelligence that uses a single large fact table to store transactional or measured data and one or more smaller dimensional tables that store attributes about the data. (2 marks)
SECTION II
21. Create a word processing document named “Question 21” and use the word processor document to save your answers to questions 1 to 3.
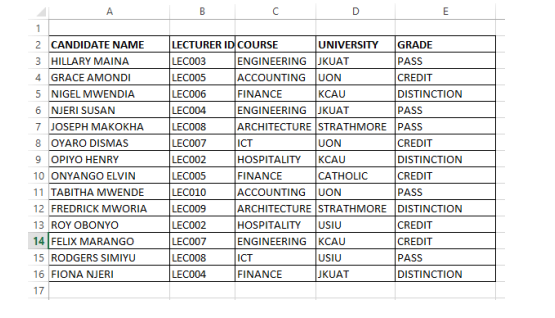
1. Create a folder on drive C: and call it “ICT”. In “ICT” folder, create an excel document shown below, save it as a comma separated version (CSV) file and name it “Grades”. (3 marks)
2. Write a python code to retrieve and display data from the file named Grades.csv that is located in the folder called ICT. Capture and save the screenshot of the resulting output. (3 marks)
Capture a screenshot to demonstrate how you have performed the above task.
3. Using the data in the table 1 above, write python programming codes that will perform the following tasks. Capture and save the screenshots of the resulting outputs.
Output 8 rows randomly from the entire dataset. (3 marks)
Transform the data into a numeric array and print the output. (3 marks)
Separate independent variables from dependent variable and print the output. (3 marks)
Normalise the data and print the output (2 marks)
Compress the data to two attributes (3 marks)
Capture a screenshot to demonstrate how you have performed the above task.
Upload Question 21.
(Total: 20 marks)
22. Create a word processing document named “Question 22” and use the word processor document to save your answers to questions 1 to 3.
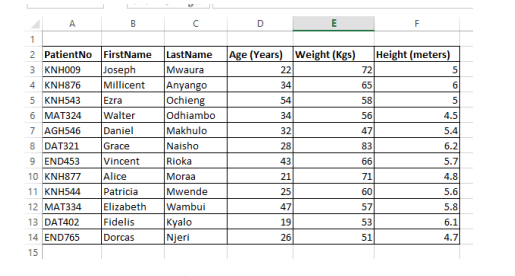
1. Create an excel document shown below and save it as a comma separated version(CSV) file named “Patient” in the ICT folder of question 1. (3 marks)
Capture screenshots and save them in Question 22 document.
2. Import the data set created in 1 above into R-Studio
3. Write the R-studio codes that will perform the following tasks:
Code to return the first 9 rows. (3 marks)
Code to return the dimensionality of data. (2 marks)
Code to display the number of rows in the dataset. (2 marks)
Code to display the variables names. (3 marks)
Code to display the data structure. (2 marks)
Code to calculate the total weight of all the patients. (2 marks)
Capture and save screenshots to demonstrate how you have performed the above task.
Upload Question 22 document.
(Total: 20 marks)
23. Create a word processing document named Question 23 and use the word processor document to save your answers to question 1 to 7 below.
Explain how you would perform the above task.
1. Import the libraries numpy for numerical analysis and matplotlib for visualisation. (3 marks)
2. Load the sklearn linear regression library (2 marks)
3. You are given a list of integer numbers (3,21,22,34,54,34,55,67,89,99) and (1,10,14,34,44,36,22,67,79,90).
Explain how you would use python to define two lists named X and Y respectively and convert them into an array (3 marks)
4. Write a python code to display the lists created in 3 on the console screen (2 marks)
5. Create a well labelled scatter plot for the two lists to illustrate their correlation on a 2D plane (2 marks)
6. Create an instance of class “LinearRegression” and fit it to the data created in 3 (4 marks)
7. Display the coefficient of determination of the model using the score function and display the model intercept and coefficient. (4 marks)
Upload Question 23 document.
(Total: 20 marks)