
A scale is a device for measuring magnitude or quantity of a variable. Scales may be a series of steps, degrees, a scheme of graded amounts from the highest to lowest, an indicator of relative size; scales may also designate appropriate categories such as age,
sex, etc;
There are four types of scales commonly used as levels of measurements.
1. Nominal scale
In business and social research, nominal data are probably more widely collected than any other. When you collect nominal data, you partition a set into categories that are mutually exclusive and collectively exhaustive. In this type of scale, the numbers serve only as labels or tags for identifying objects, events or characteristics. For instance, a person identity card number is a nominal scale. It only serves the function of identifying the person. We can assign numbers to football players, telephone subscribers or to products in
a storeroom. These numbers or codes have no mathematical implication, and the only property conveyed by the number is identity. Arithmetic operations cannot be performed on these numbers, as they would have no meaning. The only permissible mathematical operations in nominal scales are those leased upon counting such as frequencies, modes and percentages.
There are three forms of nominal scales:
- label nominal scale
- category nominal scale
- mixture nominal scale
1.Label nominal scale: This is the most elementary nominal scale. A label nominal scale is simply a label assigned to an object in order to identify and keep track of it. In this kind of scaling each label is unique to one object and possesses no meaning in itself.
2.Category nominal scale: This is the most commonly used nominal scale in marketing research. In category nominal scale, numbers are used to represent mutually exclusive and exhaustive categories of objects. Thus, one might classify the residents of a city according to their expressed religious preferences. Classification set A given in table 8.1 is not a sound category nominal scale because it is not collectively exhaustive. Set B meets the minimum requirements, although this classification may be more useful for some research purposes than others.
3. Mixture nominal Scale: This is a nominal scale which is partially a label. The numbers and labels assigned football players serve to identify the individual players, and also to place players in a category.
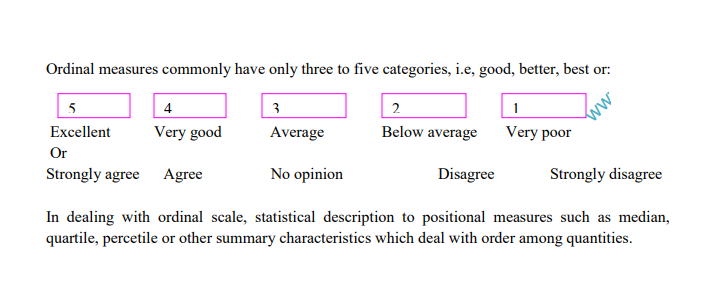
Ordinal scales
This is a qualitative scale comprised of equal appearing intervals that rank observations from large to small. This scale indicates rank order only. It does not indicate the nature of the intervals between the ranks. For example, if several soft drinks are scaled according to
sweetness, and number 1 represents the highest degree of sweetness, then the drinks assigned number 3 would be sweeter than one assigned number 4 but less sweet than one assigned number
Note that with ordinal scale the only permitted statements are of greater than or less than nature; we cannot make statements about how much less of characteristic one object posses relative to another.
Interval scales
Interval scale has the power of nominal and ordinal scale plus one additional strength; it incorporates the concept of equality in interval (the distance between 1 and 2 equals the distance between 2 and 3). The intervals are known and equal. They can be added, subtracted and their summaries can be subjected to statistical tests. The interval scale does not have an absolute zero. The zero point of this scale is arbitrary, but it permits inferences to be made.
One common example of the interval scaling is the Fahrenheit and centigrade scales used to measure temperature. An arbitrary zero is assigned to each scale, and equal temperature differences are found by scaling equal volumes of expansion in the liquid used in the
thermometer. Interval scales permit inferences to be made about the differences between the entities to be measured (warmness); but we cannot say that any value on a specific interval scale is a multiple of another. Thus a temperature of 50°F is not twice as hot as a temperature of 25°F. Also, the elapsed time between 3 and 6 a.m equals the time between 4 and 7 a.m., but one cannot say 6
a.m. is twice as late as 3 a.m.
When a scale is interval, you use the arithmetic mean as the measure of central tendency. You can compute the average time of first arrival of trucks at a warehouse. The standard deviation is the measure of dispersion for arrival time. Product moment correlation, t-tests, and F-tests and other parametric tests are the statistical procedures of choice.
Ratio Scale
This is the highest level of measurement among scales. It incorporates all the powers of the previous scales plus the provision for absolute zero or origin. Ratio scale represents the actual amounts of a variable. Measures of physical dimensions such as weight, height, distance, and are examples. In business research, we find ratio scales in many areas. These include money
values, population counts, distances, return rates, productivity rates.
Sources of measurement differences
The ideal study should be designed and controlled for precise and unambiguous measurement of the variables. Since attainment of this ideal is unlikely, we must recognize the sources of potential error and try to eliminate, neutralize or otherwise deal with them. Much potential error is systematic (results from a bias) while the remainder is random (occurs erratically). Seltiz C etal (1976) has pointed out several sources from which measured differences can come.
- The respondent as an error source
A respondent may be reluctant to express strong negative feelings or may have little knowledge about a personality i.e the president, but be reluctant to admit ignorance. This reluctance can lead to an interview of ‘guesses’. Respondents may also suffer from temporary factors like fatigue, boredom, anxiety, or other distractions; these limit the ability to respond accurately and fully. Hunger, impatience, or general variations in mood may also have an impact. - Situational Factors. Any condition that places a strain on the interview can have serious effects on the interviewer – respondent rapport. If another person is present, that person can distort responses by joining in, by distracting, or merely by being
present. If the respondents believe anonymity is no ensured, they may be reluctant to express certain feelings. - The measure as an error source
The interviewer can distort responses by rewording, paraphrasing, or reordering questions. Stereotypes in appearance and action introduce bias. Inflections of voice and conscious or unconscious prompting with smiles, nods, and so forth may
encourage or discourage certain replies: careless mechanical processing – checking of the wrong response or failure to record full replies – will obviously distort feelings. In the data analysis stage, incorrect coding and careless tabulation, and faulty
statistical calculation may introduce further errors. - Instrument as an error source A defective instrument can cause distortion in two major ways. First, it can be too confusing and ambiguous. The use of complex words and syntax beyond respondent comprehension is typical. Leading questions, ambiguous meanings, mechanical defects (inadequate space for replies, response choice omissions, and poor printing), and multiple questions suggest the range of problems. A more elusive type of instrument deficiency is poor sampling of the universe of content items. Seldom does the instrument explore all the potentially important issues.