
4.1 Introduction
Materials held by the organization in its stores or otherwise constitute its stock. In the ideal would stockholding would not be necessary. Demand and supply would be synchronized and materials would flow o the point of use at a rate matching the speed of
consumption. This is however not the case in the real world
4.2 Reasons for Holding Stock
- Delivery cannot be exactly matched with usage day by day
- Economies associates with buying or manufacturing in large quantities more than offset the cost of storage
- Operational risks require the holding of stock to guard against breakdown on programme changes
- For work in progress where a completely balanced production flow is impracticable
- For finished goods where the holding of a buffer stock between production and the customer is desirable
- Owing to fluctuations is the price of a commodity it is desirable to acquire stocks when prices are low.
- In order that materials may appreciate in value through storage e.g. wine, coffee etc.
- In order that customers may be attracted by a range of products from which to select.
The weight given to each of these factors depends upon the type of organization and the approach to stock control will naturally be influenced by the nature of the firm’s activity. In order to adequately maintain its stock a firm must maintain stock records.
Role played by Stock Records
- To indicate the amount of stock of any item at any time without it being necessary for the stock to be counted physically.
- To establish a link between the physical stock and the stores accounts. All receipts and issues of stock cause adjustments to the stores accounts
- To provide a means of provisioning i.e. determining how much should be ordered to maintain stock at the required level.
- To supply information for stock taking, i.e matching records with physical stocks for control.
- to provide a method of informing stores staff of the location of goods in the stores
- to serve the purpose of a price list where unit prices are recorded
Definition of Inventories/Stocks
- Production inventories- raw materials, parts and components which enter the firm’s product in the production process.
- MRO inventories- maintenance repair and operating supplies which are used in the production process but which do not become part of the product e.g. lubricants
- In-process inventories- semi finished products found at various stages of the production operation
- Finished goods inventories- completed goods ready for shipment.
Stock/Inventory Analysis
This is the process of determination and classification of all that is held in stock by the firm. Sound inventory management requires the development of a complete inventory catalogue followed by a thorough ABC analysis
Inventory Catalog
An inventory catalog is some form of classification of inventory items in some type of categories the most common category is the function of the items. For an inventory catalog to be prepared all inventory items have to be completely described , identified by the manufacturers part number and cross- indexed by users identification number if necessary. Inventory catalogs are very useful in:
- Serving a medium of communication by enabling staff to tell which items are carried in the inventory, whether interchangeable items are carried in the inventory for missing items. etc
- Acting as an inventory control tool through reduction of duplicate records for identified parts.
4.3 ABC Analysis: The 80-20 Concept
ABC analysis is also called Pareto analysis after Vilfredo Pareto an Italian economist who developed the concept during the early 20th century. Several studies made of large corporations have shown that 80% of all items carried in the inventory constitute 20% of the total investment while 20%of inventory items constitute 80 of total investment. In practice an ABC analysis can be made on the basis of either the average inventory investment in each item or the arrival shilling usage of each item.
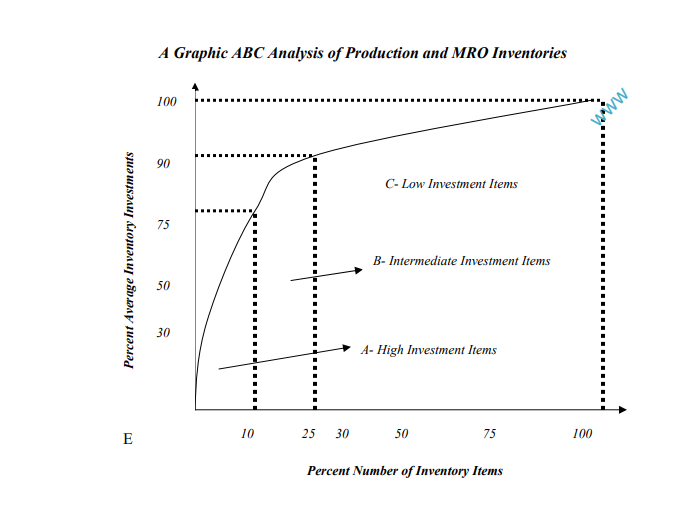 Each item value is expressed as a percentage of the total inventory investment. Each item can be the fitted on the three classifications A, B, and C depending on the items percentage investments over the total inventory investment. The value of such an analysis so to provide a sound basis on which allocate time and personnel with respect to procurement management and the refinement of control over the individual inventory items. Clearly no manager wants to spent 75% of his time on class C low-value items and spend 25% of his time on class A high-value items An additional classification dependant on criticalness of each item can be added to the ABC system. This classification is on a three-point scale; 1- critical, 2 medium, 3 non critical. Thus an item can be A1, A2, or A3 etc
Dependent and independent demand
Another part of inventory analysis that enables proper and efficient management to inventory is the determination of whether each of the inventory items is demand
dependant or demand independent. An item exhibits dependant demand characteristics when its use is directly dependant on the scheduled production of a larger component or parent’s product of which the item is part e.g. cooking oil or yeast in the making of bread. An item has independent demand when its use is not directly dependant as the scheduled production e.g. oven repair parts in bread making. Infant generally spacing MRO items are independent demand items. Though such a classification may seem simple it is very crucial for inventory control systems function more effectively with one type of item classification than with the other.
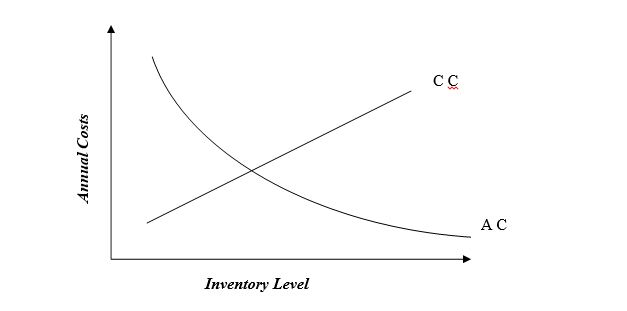
4.1 Costs Associates with Inventories
- Inventory Carrying Costs- this costs include:
- Opportunity cost of invested funds
- Insurance costs
- Property taxes – inventories are assets and assets are subjects too properly
- Storage costs- square ft used in storage
- Obsolesce and deterioration
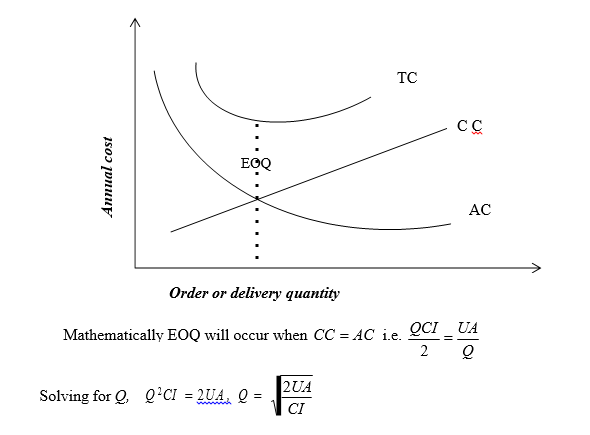
If the firm can estimate its approximate inventory carrying cost as a percentage of inventory valve based on the above costs, then the annual delivery quantities of various sizes can be calculated a follows:
CC = Q ´ C ´ I
2
Where:
CC = Carrying cost per year for the material in question
Q = Order or delivery quantity for the material in units (if order is delivered in full use order, if in parts use delivery quantities)
C = Delivered unit cost of the material
I = Inventory carrying cost of the material expressed as a percentage of inventory value
- Acquisition Costs- This are costs that have to do with gathering ,processing and handling an order, they include:
- A certain portion of wages and operating expenses
- Cost of supplies g. design drawings, receiving, inspection
- Cost of services g. computer time, telephone, fax etc
Acquisition costs behave differently from carrying costs. The acquisition cost reduce an s few large orders are made, while carrying coat increase as large orders are made and delivered.
If a firm’s cost accounting departments can estimate its approximate acquisition cost per order, the annual acquisition cost that would be generated by the order quantities as various sizes can be calculated as follows;
AC = U ´ A Q
Where;
AC = Acquisition cost per year for the material in question
U = Expected annual usage of the material in units
Q = Order or delivery quantity of the material in units
A = Acquisition cost per order or over delivery for the material
4.1 Economic Order Quantity Concept (EOQ)
After understanding the costs associated with inventories, the most important decision facing purchasing managers is the determination of the most economic level of inventory to carry. This brings out the EOQ concepts. Since the annual carrying costs increase as large orders are delivered and acquisition costs reduce as large orders are delivered. Then at the point where CC = AC this forms the EOQ because it is at this point the total cost are lowest.
4.1 Inventory Control Systems
There are four types of inventory control systems in use
- Cyclical or fixed order interval system
- The J-I-T approach
- The MRP type system
- The order point or fixed order quantity system
Cyclical or Fixed Order Interval System
This is a time based operation which involves scheduled periodic reviews of the level of all inventory items. If a given item is not sufficient to sustain the production operation until the next scheduled review an order is placed to replenish supply. The frequency of reviews is determined by the degree of control desired by the management
The stock levels can be monitored by physical inspection, visual reviews of inventory record cards or by automatic computer surveillance. The date on which to order is determined by the quantity previously ordered. If the material usage is relatively stable, an order is usually placed each time the item is reviewed. The quantity to be ordered is determined by three factors:
- Number of days between reviews
- The anticipated daily usage during the cycle period
- The quantity on hand and on order at the time of review
Stock Replacement Level = (Lead Time + Review Intervals) usage + safety stock Therefore Stock to Order = Replacement Level – stock in hand.
The maximum stock can be determined as follows: M
Where;
= W( T + L ) + S
M = Predetermined stock level; W = Average rate of usage; T = Review period
L = Lead time; S = Safety stock
Safety stock is given by {(maximum usage × maximum lead time) – average use in maximum lead time}.
Illustrations
- The relevant data for item Q is shown below:
Normal usage-100 item
Minimum usage-160 items
Maximum usage-25/30) days Calculate the safety stock
Safety Stock = {(140 × 30) – (100 × 30)}
= 4200 – 3000
= 1200 items
- What is the maximum stock level given the following data:
Average rate of wage- 120 items per day
Review period – 20 days
Lead time- 25/30 days
Safety stock- 1200 items
M = 120 (20+30) + 1200
= 600 +1200 =7200 items
If at the review period the items are 4,000 then an order would be placed of 3,200 items i.e. 7200 maximum stock minus actual stock at the review date.
Advantages of the Period Review System
- Greater chance of elimination of absolute items due to periodic review of stock.
- Purchasing load may spread more evenly with possible economics in placing
- Large quantity discounts may be negotiable when a range of stock items are ordered from the same supplier at the time.
- Production economics due to more efficient production