1. (a) Using the following sets:
A = {l,2,3,4,5,a,c}
B = {2,3,8,9, d}
C = {a, b,c,d}
Determine the following:
(i) AA(BUC);
(ii) BU(AAC);
(iii) B n C
(8 marks)
(b) The following distribution shows the number of customers who visited a hotel in a period of 42 days.
Number of customers Number of days
0 -4 4
4-8 12
8-12 8
12-16 7
16-20 5
20-24 6
(i) Present the data in a histogram.
(ii) Draw a frequency curve on the same graph in (i) above. (12 marks)
2. (a) The following data shows the marks scored by candidates in an interview for a secretarial post in an organisation:
20 50 80 40 85 40
40 70 60 70 40 50
30 30 45 50 20 60
(i) Prepare a frequency distribution table using the data above.
(ii) Using the result in (i) above, calculate:
(I) arithmetic mean;
(II) median.
(b) The following distribution shows the number of units of a product manufactured by a firm over a period of 36 months:
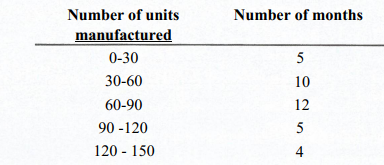
(i) Calculate the:
(I) arithmetic mean;
(II) standard deviation;
(III) mode;
(IV) Pearson’s Coefficient of Skewness.
(ii) Interpret the result in
(iv) above. (12 marks)
3. (a) The following data shows the number of customers served by a secretary of an organisation over a period of one week.
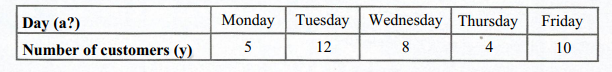
(i) Determine the regression equation in the form: y = a + bx.
(ii) Calculate the Coefficient of Determination.
(iii) Interpret the result in (ii) above. (12 marks)
(b) The probability that a customer will order for a cake in a restaurant is 0.4. On a certain day, 12 customers visited the restaurant. Calculate the probability that:
(i) 4 customers will order for a cake;
(ii) at most, 3 customers will order for a cake;
(iii) none of the customers will order for a cake.
4. (a) Explain four disadvantages of sampling in the collection of data. (8 marks)
(b) A manager of a game park claims that the average number of customers who visit the park per day is 24. The following data shows the number of customers who visited the park in a week:
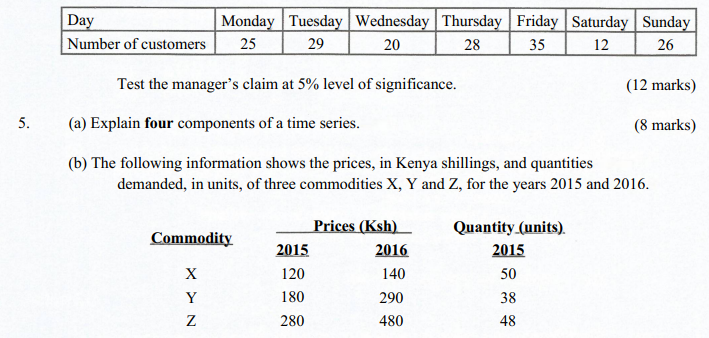
6. (a) Explain each of the following types of matrices, using an example in each case:
(i) Transpose matrix;
(ii) Diagonal matrix;
(iii) Square matrix;
(iv) Scalar matrix.