
TOPIC 2.RISK IDENTIFICATION PROCESS
Sub –Topics
1) Meaning of Risk Identification
2) Importance of Risk Identification
3) Risk Identification Techniques
4) Risk Measurement Methods
5) Risk Quantification
6) Impact and Probability Matrix
MEANING OF RISK IDENTIFICATION
Definition: Risk identification is the process of determining risks that could potentially prevent the program, enterprise, or investment from achieving its objectives. It includes documenting and communicating the concern.
The purpose of risk identification is to reveal what, where, when, why, and how something could affect a company’s ability to operate. For example, a business located in a slum might include “the possibility of ‘fire’ as an event that could disrupt business operations.
Identification participants
Where time and resources permit, all members of the project team should attend the identification session, including functional unit members assigned to the project on a part-time basis. People who might be included in a brainstorming group are:
The project manager and the project team;
Project sponsors and site representatives;
Discipline engineers;
Experts with specific knowledge in particular areas of concern, where there may be insufficient expertise in the project team;
Commercial specialists;
Health, safety and environmental specialists;
People with experience in similar previous or current projects;
Users of the project outcomes;
Key stakeholders who need to be confident in the project and the project management process before approvals are granted.
IMPORTANCE OF RISK IDENTIFICATION
1. Helps completely analyse and find out what risks need to be addressed which are based on likelihood and impact. Then they are quantified according to cost or the right time to address them.
2. Facilitates attainment of project objectives. All risks that are identified can be resolved with a plan without compromising with the objectives of the project and the end result required. All the assumptions can be listed down and analyzed strategically, one at a time. The analysis helps in removing potential inaccuracies at the beginning of the project itself.
3. Increases Successful completion of projects
When negative risks are identified they are thus mitigated for the success of the project, Risks however are not always negative they can positive which may play a part in achieving the goals of a project. They can lead to opportunities that were unplanned but show up during the identification process and the team or firm can make the most of these ‘opportunity risks’.
4. Enhances communicating with Stakeholders
It ensures that the project runs smoothly so one step proceeds to the next without disruption. By identifying, avoiding and dealing with potential risks in advance, you ensure that your employees can respond effectively when challenges emerge and require intervention.
5. Maximizes Results and Meet Deadlines
By identifying risks in an organisation company, success is more likely by minimizing and eliminating negative risks so projects can be finished on time.
This enables you to meet your budget and fulfil targeted objectives.
6. Be Proactive Not Reactive and reduce loses
The project team can take the risk that have been identified and convert them to actionable steps that will reduce likelihood. Those steps then become Contingency Plan that hopefully can be aside. Should a risk event occur, the Contingency Plan can be whipped out quickly, reducing the downtime on a project.
RISK IDENTIFICATION TECHNIQUES
Information gathering techniques
1. Documentation reviews:
What is and what is not included in the preliminary project scope statement, the project charter and later documents can help identify risks. Lessons learned, articles and other documents can also help uncover risks. Documentation reviews involve reviewing project plans, assumptions, and historical information from a total project perspective as well as at the individual deliverables or activities level. This review helps the project team identify risks associated with the project objectives. Pay attention to the quality of the plans and the consistency between plans.
II. Brainstorming
Brainstorming is a group creativity technique designed to generate a large number of ideas for the solution of a problem. Although brainstorming has become a popular group technique, researchers have not found evidence of its effectiveness for enhancing
either quantity or quality of ideas generated. There are four basic rules in brainstorming meant to reduce social inhibitions among group members, stimulate idea generation, and increase overall creativity of the group.
i. Focus on quantity: This rule is a means of enhancing divergent production, aiming to facilitate problem solving through the maxim, quantity breeds quality.
The assumption is that the greater the number of ideas generated, the greater the chance of producing a radical and effective solution.
ii. Withhold criticism: In brainstorming, criticism of ideas generated should be put ‘on hold’. Instead, participants should focus on extending or adding to ideas, reserving criticism for a later ‘critical stage’ of the process. By suspending judgment, participants
will feel free to generate unusual ideas.
iii. Generate unusual ideas: To get a good and long list of ideas, unusual ideas are welcomed. They can be generated by looking from new perspectives and suspending assumptions. These new ways of thinking may provide better solutions.
iv. Combine and improve ideas: Good ideas may be combined to form a single better good idea, as suggested by the slogan “1+1=3”. It is believed to stimulate the building of ideas by a process of association. 23
III. Delphi technique
The Delphi method is a systematic, interactive forecasting method which relies on a panel of independent experts. The carefully selected experts answer questionnaires in two or more rounds. After each round, a facilitator provides an anonymous summary of the experts’ forecasts from the previous round as well as the reasons they provided for their judgments. Thus, experts are encouraged to revise their earlier answers in light of the replies of other members of their panel. It is believed that during this process the range of the answers will decrease and the group will converge towards the “correct” answer. Finally, the process is stopped after a pre-defined stop criterion (e.g. number of rounds, achievement of consensus, and stability of results) and the mean or median scores of the final rounds determine the results. This method utilizes a formal Delphi group and is designed to pool the expertise of many professionals in such a way as to
gain access to their knowledge and to their technical skills while removing the influences of seniority, hierarchies, and personalities on the derived forecast. The
is named after the oracle at Delphi in ancient Greece.
IV. Interviewing
Interviews are question-and-answer sessions held with others, including other project managers, subject matter experts, stakeholders, customers, the management team, project team members, and users. These people provide possible risks based on their past experiences with similar projects. This technique involves interviewing those people with previous experience on projects similar to yours or those with specialized knowledge or industry expertise. Ask them to tell you about any risks that they’ve experienced or that they think might happen on your project. Show them the Work Breakdown Structures(WBS)and your list of assumptions to help get them started thinking in the right direction.
V. Root cause analysis
Root cause analysis (RCA) is a class of problem solving methods aimed at identifying the root causes of problems or events. The practice of RCA is predicated on the belief that problems are best solved by attempting to correct or eliminate root causes, as opposed to merely addressing the immediately obvious symptoms. By directing corrective measures at root causes, it is hoped that the likelihood of problem recurrence will be minimized. 24 However, it is recognized that complete prevention of recurrence by a single intervention is not always possible. Thus, RCA is often considered to be an iterative process, and is frequently viewed as a tool of continuous improvement.
VI. Checklists
Checklists are quick to use, and they provide useful guides for areas in which the organization has a depth of experience, particularly for projects that are standard or routine in nature. Sometimes these take the form of standard procedures that have a similar effect. For example, many organizations have checklists for such frequent activities as tendering or contract negotiations, designed to avoid or minimize the risks in those activities. Often, the checklists are part of the organization’s quality assurance procedures and documentation.
VII. Diagramming techniques
Diagramming techniques, such as system flow charts, cause-and-effect diagrams, and influence diagrams are used to uncover risks that aren’t readily apparent in verbal descriptions.
a. Cause and Effect Diagrams – Cause and effect diagrams or fishbone diagrams are used for identifying causes of risk. While drawing the Fishbone chart, care is taken to have the inner branches meet a horizontal straight line, called the “spine” of the chart. The statement of the problem – or the effect – is to the right of the spine inside a box, which makes it look like the head of a fish. When finished, the entire map resembles a fishbone.
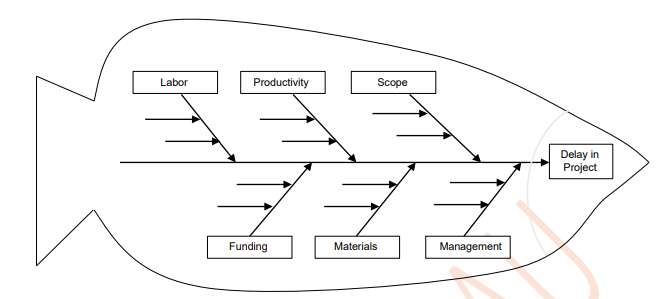
Figure 1: Fishbone (cause and effect) diagram Delay in Project Funding Materials Management Labour Productivity.
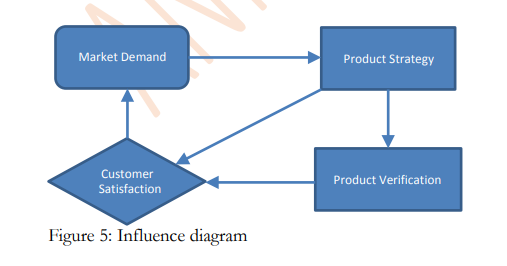
b.Influence diagrams (ID): An ID is a directed acyclic graph with three types of nodes and one sub-type:
Decision node (corresponding to each decision to be made) is drawn as a rectangle.
Uncertainty node (corresponding to each uncertainty to be modelled) is drawn as an oval.
Deterministic node (corresponding to special kind of uncertainty that its outcome is deterministically known whenever the outcome of some other uncertainties is also known) is drawn as a double oval.
Value node (corresponding to each component of additively separable) is drawn as an octagon (or diamond)
System or process flow charts:
A flowchart is a common type of chart, that represents an algorithm or process, showing the steps as boxes of various kinds, and their order by connecting these with arrows. Flowcharts are used in analysing, designing, documenting or managing a process or program in various fields
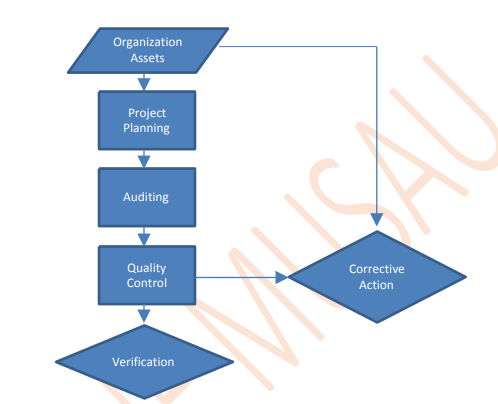
Figure 2: Flow chart diagram
VIII.SWOT ANALYSIS
SWOT Analysis is a strategic planning method used to evaluate the Strengths, Weaknesses, Opportunities, and Threats involved in a project. It involves specifying the objective of the project and identifying the internal and external factors that are favourable and unfavourable to achieving that objective. Strengths: attributes of the team or company those are helpful to achieving the
objective.
Weaknesses: attributes of the team or company those are harmful to achieving the
objective.
Opportunities: external conditions those are helpful to achieving the objective.
Threats: external conditions which could do damage to the business’s performance.
Other identification techniques
IX. Hazard and Operability Studies – a HAZOP is a structured approach that systematically analyses every part of a process to identify how hazards, operability problems and deviations from design intent may arise.
X. Fault Tree Analyses – fault tree analysis is a systems engineering method for representing the logical combinations of the system states and possible causes that can contribute to a specified event (called the top event).
XI. Event Tree Analyses – an event tree describes the possible range and sequence of outcomes that may arise from the initiating event.
RISK MEASUREMENT METHODS
Some common measures of risk include:
I. Standard Deviation
Standard deviation measures the dispersion of data from its expected value. The standard deviation is used in making an investment decision to measure the amount of historical volatility associated with an investment relative to its annual rate of return.
It indicates how much the current return is deviating from its expected historical normal returns. For example, a stock that has high standard deviation experiences higher volatility, and therefore, a higher level of risk is associated with the stock.
For those interested only in potential losses while ignoring possible gains, the semi deviation essentially only looks at the standard deviations to the downside.
II. Sharpe Ratio
The Sharpe ratio measures performance as adjusted by the associated risks. This is done by removing the rate of return on a risk-free investment, such as a Treasury Bond, from the experienced rate of return. This is then divided by the associated investment’s standard deviation and serves as an indicator of whether an investment’s return is due to wise investing or due to the assumption of excess risk.A variation of the Sharpe ratio is the Sortino ratio( a variation of the Sharpe ratio that differentiates harmful volatility from total overall volatility by using the asset’s standard deviation of negative portfolio returns—downside deviation—instead of the total standard deviation of portfolio returns), which removes the effects of upward price movements on standard deviation to focus on the distribution of returns that are below the target or required return. The Sortino ratio also replaces the risk-free rate with the required return in the numerator of the formula, making the formula the return of the portfolio less the required return, divided by the distribution of returns below the target or required return. Another variation of the Sharpe ratio is the Treynor (is a performance metric for determining how much excess return was generated for each unit of risk taken on by a portfolio.) Ratio that uses a portfolio’s beta or correlation the portfolio has with the rest of the market. Beta is a measure of an investment’s volatility and risk as compared to the overall market. The goal of the Treynor ratio is to determine whether an investor is being compensated for taking additional risk above the inherent risk of the market. The Treynor ratio formula is the return of the portfolio less the risk-free rate, divided by the portfolio’s beta.
III. Beta
Beta is another common measure of risk. Beta measures the amount of systematic risk an individual security or an industrial sector has relative to the whole stock market. The market has a beta of 1, and it can be used to gauge the risk of a security. If a security’s
beta is equal to 1, the security’s price moves in time step with the market. A security with a beta greater than 1 indicates that it is more volatile than the market. Conversely, if a security’s beta is less than 1, it indicates that the security is less volatile than the market. For example, suppose a security’s beta is 1.5. In theory, the security is 50 percent more volatile than the market.
IV Value at Risk (VAR):
Value-at-Risk (VaR) is commonly used by investment banks to measure the market risk of their asset portfolios. VaR measures market risk by determining how much the value of a portfolio could decline over a given period of time with a given probability as a
result of changes in market prices or rates. In other words VaR answers the question, “What is my worst-case scenario?” or “How
much could I lose in a really bad day?” A VAR statistic has three components: Time horizon, probability and an estimate of portfolio loss (or loss percentage).
Example: 12 months VaR of Kshs.5,00,000 at the 95% confidence level implies that one would expect a loss more than Kshs. 5,00,000 5% of the time or once in 20 years.
Methods of calculating VAR:
1. Historical Method:
This method assumes that asset returns in the future will have the same distribution as in the past.
2. The Variance-Covariance Method:
This assumes that risk factor returns are always (jointly) normally distributed and that
the change in portfolio value is linearly dependent on all risk factor returns
V. Conditional Value at Risk (CVaR)
Conditional value at risk (CVaR) is another risk measure used to assess the tail risk of an investment. Used as an extension to the VaR, the CVaR assesses the likelihood, with a certain degree of confidence, that there will be a break in the VaR; it seeks to assess what happens to investment beyond its maximum loss threshold. This measure is more sensitive to events that happen in the tail end of a distribution—the tail risk. For example, suppose a risk manager believes the average loss on an investment is $10 million for the worst one percent of possible outcomes for a portfolio. Therefore, the
CVaR, or expected shortfall, is $10 million for the one percent tail.
VI. Monte Carlo Simulation Method for Valuation:
It is a method of calculating changes in value of assets using randomly selected rates or prices and for this it is necessary to make certain assumption on changes based on experience and judgment (This is different from calculations based on historical prices). So it calls for identification of risk factors, their distribution, volatility, over a specified period. The calculation is repeated on different parameter viz. rate of return, market value, volatility and period. In other words, the working is based on assumptions, of all possible changes
VII.R-squared
R-squared is a statistical measure that represents the percentage of a fund portfolio or a security’s movements that can be explained by movements in a benchmark index. For fixed-income securities and bond funds, the benchmark is the U.S. Treasury Bill.
The S&P 500 Index is the benchmark for equities and equity funds. R-squared values range from 0 to 100. According to Morningstar, a mutual fund with an R-squared value between 85 and 100 has a performance record that is closely correlated to the index. A fund rated 70 or less typically does not perform like the index.
Mutual fund investors should avoid actively managed funds with high R-squared ratios, which are generally criticized by analysts as being “closet” index funds. In such cases, it makes little sense to pay higher fees for professional management when you can get
the same or better results from an index fund.
VIII. Capital Asset Pricing Model (CAPM):
CAPM is a model based on the proposition that on any stock required rate of return is equal to the risk free rate (coupon rate of government bonds) plus risk premium, where the risk premium reflects the effects of diversification. In other words CAPM return is
risk adjusted through diversification. Any investment in financial markets is subject to risk and return. Expected return on the investment depends on the amount of risk. Investors expect a high return for compensating higher risks. This is where capital asset pricing model (CAPM) helps us to calculate investment risk and what return on investment we should expect.
Formula:
RR= γ + β(R-n)
Where:
r = Risk free rate
β= Beta of the security
R = (Expected) market return
(R-γ = Market Premium
RR= Required Rate of Return
Example:
If stock beta is 1.5%
Risk free rate is 9%
Market return is 15%
ADVERTISEMENTS:
Required rate of return is 9 + 1.5 (15- 9) = 18%
RISK QUANTIFICATION
Risk quantification is a process to evaluate identified risks to produce data that can be used in deciding a response to corresponding risks. It is a 2nd step of project risk management, after risk identification and before risk response development and risk response control according to PMBOK standard. The objective of project risk quantification is to prepare contingencies in terms of costs, time, or human resources and prioritize them. PMBOK, ISO 31000, and PRINCE2 provide principles and processes for effective risk management. Risks
are quantified by using either expert intuitions or statistical tools. Tools and Techniques are used in order to apply risk quantification in projects.
1. Expert Opinion
Merriam Webster defines expert opinion as, “a belief or judgment about something given by an expert on the subject”. Expert opinion is one of the risk quantification techniques. In expert opinion, risks are quantified based on the opinions of experts or
senior executives based on their experiences One of the best ways to use expert opinion is to conduct risk assessments workshops where experts can discuss and consequently assign values to the risks identified. But, this may lead to group bias and can affect the outcome. This bias can be minimized by using Delphi method, but there still be a chance of high variation in opinion. Although, expert opinion is not as concrete, as other methods may be, and may prone to personal subjectivity, but it is a very useful tool for risk quantification when data is scarce or no sufficient past experience is available or where risks are very company or project specific.
2. Expected Monetary Value (EMV)
Expected monetary value is another way to quantify risk. According to PMBOK [1] expected monetary value is a product of two numbers, risk probability value and risk event value which is an estimate of loss or gain that will be incurred if the risk event occurs. These values can be positive and negative resulting in gain or loss respectively. For example, if there is 60% probability that a certain equipment will fail during a project that will result in USD10,000, then EMV will be USD -6,000. It can be perceived that a total of USD4,500 is required as a contingency, but in actual only USD1,100 are required as all of the events are not going to happen. This means, the risks which are not going to happen will add their value to EMV pool, where risks that are going to happen will utilize value from this pool. Hence, for this example, a project manager can add extra USD1,100 into project budget as contingency. EMV helps project managers in two ways. First, it helps to manage to estimate the amount required to manage all identified risks. Second, it helps in selecting the choice to manage the risk
by selecting the option with the minimum value. EMV is generally used as an input to further analysis, for example, in decision trees. Benefits of using EMV are that it provides help in calculating contingency reserves, in procurement planning decision making, in spreading the impact of a large number of risks, and in decision tree analysis.
3. Statistical Sums
Statistical sums is another way to quantify risks. In this technique cost estimates of individual work items are calculated and then are used to calculate range of total project costs using statistical probability distribution. The range of different project costs can help to quantify relative risks of alternative project budgets. In this method, instead of using one point estimate, 3 point estimates are used. Cost of each work item is estimated through 3 points of likelihood i.e. low, likely, and high. Then statistical distribution such as normal distribution or beta distribution is used to calculate mean and variance. To calculate mean and variance of total project estimate, means and variances are added together for all work items. It is an easy technique for calculating budget and time
contingency of a project, but it cannot be used for unforeseeable risks that may happen during a project. Further, as estimates are provided on expert opinion bases so it may subject to personal bias
4. Monte Carlo Analysis or Simulation
Monte Carlo is a computerized mathematical simulation technique that is used to quantify risks in project management. This technique is helpful in seeing the probable outcomes of decisions and assesses the impact of risk that is useful in decision-making.
Most likely and least likely estimates of risks are provided for each event and then these estimates are summed together to calculate a range of possible outcomes.
Monte Carlo simulation then generates random values between the range and calculates the number of occurrences the value lies within each possible outcome. This probability is then distributed and the decision is made based on the most probable outcome. For
example, if there are three tasks required in an e-learning project. Monte Carlo simulation is usually used in cost and schedule estimation. It can also be used in large projects or programs. The benefits of using Monte Carlo are easiness of tool, numerical estimation, and great level of confidence .Whereas drawbacks or challenges are the use of right distribution as wrong distribution may lead to wrong results, input estimates as right estimates are required to produce right results, and use of right mathematical formula in the software.
5. Decision Trees
Decision tree is a tool that uses tree-like graph or model of decisions and their corresponding consequences that can be used to quantify risks and make a decision under uncertainty in a project. Expected Monetary Value (EMV) is usually used to quantify risks, where probability(P) of an event is multiplied by its impact(I) to calculate the EMV. For example, if there is a decision to make under uncertainty that whether to make a prototype or not in a project. Benefits of using decision tree analysis are ease of understanding and implementation, quantification of even little hard data, and a possibility to add several new scenarios. While disadvantages are biases of input data and increase in complexity for a large number of outcomes that are linked together.
Considerations in Selection of Technique Selecting the right technique for right project can be tedious. Several factors can influence on the selection of the right technique for the right project. Some of these factors include:
1. Resources and capabilities required to execute a certain risk quantification
method
2. Degree of uncertainty in the project
3. Complexity of the project
4. Availability of the past data
IMPACT AND PROBABILITY MATRIX
Probability and Impact Matrix is a tool for the project team to aid in prioritizing risks. As you know, there may be several risks in any project. Depending on the size and complexity of the project in hand, the risks may vary somewhere from double digits to triple digits. But, do we have the time and money to look into all these risks, let alone the response action. The answer is NO; we do not have such luxury of time. So, it is necessary to find a way to identify those critical risks which needs the most attention from the project team. Probability and Impact Matrix uses the combination of probability and impact scores of individual risks and ranks/ prioritizes them for easy handling of the risks. In other words, the probability and impact matrix helps to determine which risks need detailed
risk response plans. It is vital to understand the priority for each risk as it allows the project team to appreciate the relative importance of each risk. For example, a risk with a high probability/ likelihood of occurring and which will have a high impact on the project objectives will likely need a response plan.
Probability
Probability is the likelihood that an event will occur. The classic example is flipping a coin. There is a 0.50 probability of getting heads and a 0.50 probability of getting tails on the flip.
Note that the probability that an event will occur plus the probability that the event will not occur always equals 1.0.
Determining risk probability can be difficult because it’s most commonly accomplished using expert judgment. This means you are guessing (or asking other experts to guess) at the probability a risk event will occur.
Impact
Impact is the amount of pain (or the amount of gain) the risk event poses to the project.
The risk impact scale can be a relative scale that assigns values such as high medium low (or some combination of these) or a numeric scale known as a cardinal scale. Cardinal scale values are actual numeric values assigned to the risk impact. Cardinal scales are expressed as values from 0.0 to 1.0 and can be stated in equal (linear) or unequal (nonlinear) increments. The matrix generally used is a 3×3 matrix (with Low, Medium, High rating for Probability and Impact) or 5×5 matrix (with Very Low, Low, Medium, High and Very High ratings for probability and impact). A sample Probability-Impact Matrix is given below for your reference
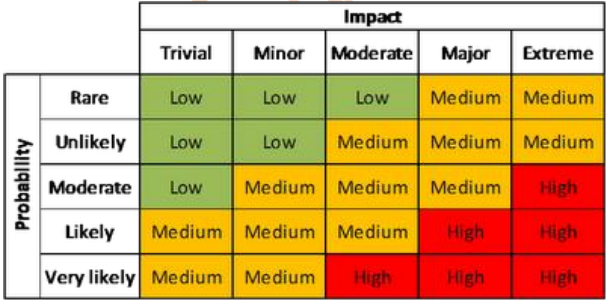
How to use this matrix?
If a particular risk has a moderate probability and the estimated impact of this risk is major, then you look into the respective row and column to identify the risk rating. For a moderate probability and major impact, the risk rating in the above matrix is “Medium”. The colours are visual indications of the seriousness of the risks.