

1 (a) Differentiate between categorical data and numerical data as used in Statistics (4 marks)
(b) The data in Table I represents the frequency distribution of heights in centimetres of 250 male students in a certain secondary school in the year 2014,
Table I
(i) Determine the following measures about the distribution of height;
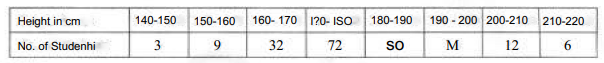
(I) median;
(II) standard deviation, (7 marks)
(ii) Determine the proportion of the students whose heights are between 162 cm and 184 cm. (5 marks)
(iii) To join the basketball team, a student must have a minimum height of 182 cm.
However, all the top 55% of the students based on height qualify to join the volleyball team. Assuming that the basketball team has picked all the students who qualify and a student cannot belong to two teams, determine the proportion of the students who joined the volleyball team. (4 marks)
2. (a) Differentiate between the terms discrete data and continuous data as used in Statistics giving two examples in each case. (4 marks)
(b) Distinguish between the mean and the median in terms of their suitability in describing
data sets.
(4 marks)
(c) The performance m Mathematics examination by candidates in tlie year 2014 fits a normal distribution with a mean of 52 marks and a standard deviation of 13.8 marks. If a random sample of 800 candidates is taken from the population;
(i) estimate the number of candidates who passed if the pass-mark was set at 40. (3 marks)
(ii) estimate the number of candidates who scored between 48 marks and 58 marks. (5 marks)
(iii) Suppose the examining body wants only the top 68% of the candidates to pass, determine the pass-mark that should be set to achieve this. (4 marks)
3. (a) Explain each of the following types of statistics:
(i) descriptive statistics;
(ii) inferential statistics. (4 marks)
A research study was carried out on die relationship between road accidents and alcohol consumption. Data for the year 2014 was taken showing the number of road accidents
in hundreds and the quantity of alcohol consumed in millionas shown in Table 2.
Use it to answer the questions that follow.
Table 2
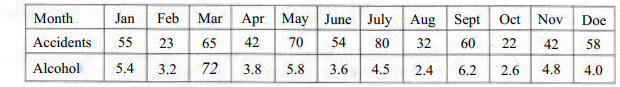
Construct a scatter diagram to represent the data. (4 marks)
(ii) Determine the feast squares regression fine of the number of toad accidents on the quantity of alcohol consumed. (8 marks)
iii) Interpret the taut squares regression tine obtained in (it). (4 marks)
4. (a) Define the fol towing terms as used in project network analysis:
(i) activity;
(ii) network;
(iii) event. 16 marks)
Differenciate between the terms sampling interval and .vampZrng/ravion as used in the collection of statistical data. (4 marks)
(c) An educational researcher has found out dial not all students who passed primary school examination eventually pass secondary school examination, and not ail students who eventually pass secondary school examination passed primary school examination. He
collected data from a random sample of 120 students and the findings were as follows:
* 54 passed in primary and passed in secondary
* 26 passed in primary but failed in secondary
* 18 failed in primary hut passed in secondary
* 22 failed in primary and lai led in secondary
(t) Present this information in a Venn diagram; (4 marks)
(ii) Detel mine I he probability that a student selected at random:
fl) who passed pnmary eventually passed secondary;
(II) who parsed secondary had passed primary. (6 marks)
(a) Outline four uses of index numbers in economics. (4 marks)
(h) Differentiate between primary data and secondary data as used in statistics. (4 marks)
A tertiary college offers courses which arc categorised as Engineering. Business and Hospitality. The composition of the sLudent population is as fallows: Engineering 300,
Business 1200 and Hospitality 9<K). A random sample of 120 students is to be selected using stratified random sampling technique.
(i) Determine the various sample sizes for each stratum assuming proportional
allocation. (8 marks)
(it) Select a random sample among engineering students using systematic random sampling procedure based on the size determined in (i’i. (4 marks)
6. (al With the aid of mathematics! symbols, outline three propeies of the mean as a measure Of central tendency: (6 marks)
<b) By use of words, explain each of the following types of correlation as used tn statistics;
(i) positive correlation;
(i i) negative correlation;
(iti) no correlation. (ft marks)
(c) I he project of constructing a lecture theatre in a college comprises various activities.
The activities, their corresponding duration and prerequisite order are as shown in the precedence table below, Use it lo answer the questions that follow.
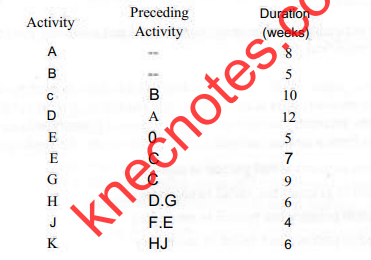
With the aid of a network diagram, determine the critical path and the expected project duration, (8 marks)
(a) Explain each of the fallowing terms a-S used in statistics:
(i) sampling;
(ii) census;
(iii) questionnaire;
(iv) sampling frame. (8 marks)