
WEDNESDAY: 6 April 2022. Morning paper. Time Allowed: 3 hours.
Answer any FIVE questions. ALL questions carry equal marks. Show ALL your workings. Do NOT write anything on this paper.
QUESTION ONE
1. Hexadol Limited has been in operation for the last 5 years. The Company’s annual revenue function and annual cost
function take the form of quadratic functions.
The following data was obtained from the records of the company for the last 3 years:
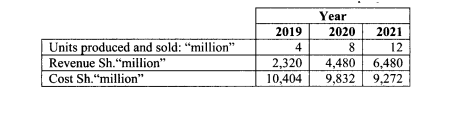
Required:
The revenue function of the company. (4 marks)
The cost function of the company. (4 marks)
2. Explain the following terms as used in probability:
Joint probability. (2 marks)
Mutually exclusive events. (2 marks)
Conditional probability. (2 marks)
Dependent events. (2 marks)
3. A firm has 500 employees out of whom, 2% have a minor accident in a given year. Out of the employees who have a minor accident in a given year, 30% had safety instructions. 80% of all employees had no safety instructions.
Required:
The probability of an employee being accident free given that the employee had no safety instructions. (4 marks)
(Total: 20 marks)
QUESTION TWO
1. Explain three types of Kurtosis that a graphical representation of a frequency distribution can assume. (6 marks)
2. The following data shows the age distribution of 350 employees of a multi-national company.
Age (years) Number of employees
20 — 25 20
25 — 30 70
30 — 35 100
35 —40 65
40 — 45 40
45 — 50 25
50 — 55 15
55 — 60 10
60 — 65 5
Required:
Compute the following measures and give an interpretation of each:
The mean age. (2 marks)
The median age. (3 marks)
The standard deviation of the employees’ ages. (6 marks)
The Karl Pearson’s coefficient of skewness. (3 marks)
(Total: 20 marks)
QUESTION THREE
1. A random sample of 350 invoices issued by ARIK Ltd. revealed an average invoice value of Sh.38,780 with a standard deviation of Sh.8,750.
Required:
The interval within which the population mean should fall at 95% level of confidence. (3 marks)
The sample size of invoices that would result in a 99% confidence level of the interval obtained in 1 above. (3 marks)
2. The following information relates to the operating life of two brands of mobile phones, brand A and brand B:
Brand A Brand B
Mean life (days) 1,730 1,684
Standard deviation (in days) 102 108
Sample size 200 200
Required:
Advise a potential customer on whether there is any significant difference between the quality of the two brands of mobile phones at a 5% level of significance. (6 marks)
3. A certain new strategy K was claimed to be effective for teams playing a certain game.
In a marathon of 400 games, half of the teams used strategy K and the other half used strategy P.
The teams’ performance was recorded in the following table
Won Defeated Drawn
Adopted strategy K 130 20 60
Adopted strategy P 110 30 50
Required:
On the basis of the above data and using the chi-square method, advise whether there is a significant difference in the effect of the two strategies, K and P. (8 marks)
(Total: 20 marks)
QUESTION FOUR
1. XYZ Ltd. produces three products namely A, B and C. The company presents the profit per unit of the products it produces and sells as follows:
Sh.2,000, Sh.3,000 and Sh.4,000 for products A, B and C respectively during the month of January 2022. Sh.7,000, Sh.9,000 and Sh.4,000 for products A, B and C respectively during the month of February 2022. Sh.1,000, Sh.4,000 and Sh.2,000 for products A, B and C respectively during the month of March 2022. The total profits in the months of January, February and March 2022 are Sh.17 million, Sh.45 million and Sh.16 million respectively.
Required:
The total number of each product produced and sold using matrix algebra. (8 marks)
2. The savings accounts in a certain microfinance bank have an average balance of Sh.240,000 and a standard deviation of Sh.60,000. The account balances are assumed to be normally distributed.
Required:
The proportion of savings accounts whose balances are above Sh.275,000. (3 marks)
The proportion of savings accounts whose balances lies between Sh.190,000 and Sh.260,000. (3 marks)
3. The average revenue function of a certain company is given by the function AR = 2,000 — 24q. The cost function is given by the function C = 6q2 + 1,440q + 1,280. In both cases, q represents the quantity in units.
Required:
The profit function of the company. (3 marks)
The maximum profit for the company. (3 marks)
(Total: 20 marks)
QUESTION FIVE
Ahadi Ltd. is in the process of analysing its electricity expense and its relationship with the machine hours of operation.
The following data is provided with respect to the year ended 31 December 2021:
Month Number of machine hours Electricity expense
“000” Sh.”000″
January 72 1,020
February 55 820
March 39 720
April 60 900
May 49 870
June 39 720
July 53 825
August 81 1,365
September 63 870
October 59 890
November 45 790
December 50 940
Required:
The least squares regression line for the above data and interpret its meaning. (10 marks)
Estimate the amount of electricity expense assuming the expected machine hours are 78,000. (2 marks)
The product moment correlation coefficient between machine hours and electricity expense. Interpret your answer. (6 marks)
The standard error of estimate for the regression line. Interpret your answer. (2 marks)
(Total: 20 marks)
QUESTION SIX
1. Highlight four requirements that must be met before the linear programming model can be applied. (4 marks)
A company makes two products; 1 and 2.
Each product requires time on two machines A and B. The specifications for each product are as follows:
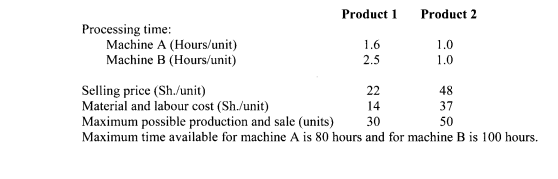
Required:
Formulate a linear programming model to determine the number of product 1 and product 2 which should be produced and sold in order to maximise total contribution for the company using the graphical method. (12 marks)
2. State any four assumptions of the Poisson probability distribution. (4 marks)
(Total: 20 marks)
QUESTION SEVEN
1. The table below shows the quarterly profits of Kahawa Limited (in millions of shillings) for the years 2019, 2020 and 2021:
Quarterly profits (Sh.”million”)
Year Quarter 1 Quarter 2 Quarter 3 Quarter 4
2019 23 32 27 21
2020 27 35 32 24
2021 31 43 40 29
Required:
The three-quarter moving average of the profits. (6 marks)
The quarterly seasonal variations of the profits using the additive model. (4 marks)
Forecast the adjusted profits for the year 2022 given that the actual profits (in Sh.”million”) in the year 2022 are 35, 50, 47 and 33 for Quarter 1, Quarter 2, Quarter 3 and Quarter 4 respectively. (4 marks)
2. An investment manager in an investment fund has a choice between:
- A diversified portfolio promising Sh.15 million with a probability of 0.7 and Sh.8 million with a probability of 0.3.
- A risky investment consisting of two contracts with independent outcomes one promising Sh.7 million with a probability of 0.7 and the other Sh.3.5 million with a probability of 0.3.
Required:
Construct a decision tree depicting the above information using the expected monetary value (EMV) criterion. (3 marks)
Advise on the best decision using the EMV criterion. (3 marks)
(Total: 20 marks)