
The presentation of statistics in research reports is a special challenge for writers. Four basic ways to present such data are in (1) a text paragraph, (2) semitabular form, (3) tables, or (4) graphics.
1. Text Presentation
This is probably the most common when there are only a few statistics. The writer can direct the reader’s attention to certain numbers or comparisons and emphasize specific points. The drawback is that the statistics are submerged in the text, requiring the reader to scan the entire paragraph to extract the meaning. The following material has a few simple comparisons but becomes more complicated when text and statistics are combined.
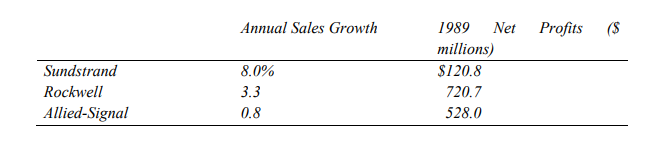
A comparison of the three aerospace and defense companies from the high-tech stratum of the Forbes 500 sample show that Sundstrand had the best sales growth record over the years 1988- 1989. Its growth was 8.0 percent – with sales significantly lower than the other two firms in the sample. This compares to sales growth for Rockwell International of 3.3 percent, and AlliedSignal was third at only 0.8 percent sales increase. Rockwell International generated the most profits in 1989 among the three companies. Rockwell’s net profits were $720.7 million as compared to $528 million for Allied-Signal and $120.8 million for Sundstrand.
2. Semitabular Presentation
When there are just a few figures, they may be taken from the text and listed. Lists of quantitative comparisons are much easier to read and understand than embedded statistics.
An example of semitabular presentation is shown below:
A comparison of the three aerospace-defense companies in the Forbes 500 sample shows that Sundstrand showed the best sales growth between 1988 and 1989. Rockwell International generated the highest net profits for the year 1989.
3. Tabular Presentation
Tables are generally superior to text for presenting statistics, although they should be accompanied by comments directing the reader’s attention to important figures. Tables facilitate quantitative comparisons and provide a concise, efficient way to present numerical data.
Tables are either general or summary in nature. General tables tend to be large, complex and detailed. They serve as the repository for the statistical findings of the study and are usually in the appendix of a research report. Summary tables contain only a few key pieces of data closely related to a specific finding. To make them inviting to the reader (who often skips them), the table designer should omit
unimportant details and collapse multiple classifications into composite measures that may be sustained for the original data.
Any table should contain enough information for the reader to understand its contents. The title should explain the subject of the table, how the data are classified, the time period, or other related matters. A subtitle is sometimes included under the title to explain something about the table; most often this is a statement of the measurement units in which data are expressed. The contents of the columns should be clearly identified by the column heads, and the contents of the stub should do the same for the rows. The body of the table contains the data, while the footnotes contain any needed explanations. Footnotes should be identified by letters or symbols
such as asterisks, rather than by numbers, to avoid confusion with data values. Finally, there should be a source note if the data do not come from your original research.
4. Graphics
Compared with tables, graphs show less information and often only approximate values. However, they are more often read and remembered than tables. Their great advantage is that they convey quantitative values and comparisons more readily than talbes. With personal computer charting programs, you can easily turn a set of numbers into a chart or graph.
Oral Presentations
Researchers often present their findings orally. These presentations, sometimes called briefings, have some unique characteristics that distinguish them from most other kinds of public speaking: Only a small group of people is involved; statistics normally constitute an important portion of the topic; the audience members are usually managers with an interest in the topic, but they want to hear only the critical elements; speaking time will often be as short as 20 minutes but may run longer than an hour; and the presentation is normally followed by questions and discussion.
Preparation
A successful briefing typically requires condensing a lengthy and complex body of information. Since speaking rates should not exceed 100 to 150 words per minute, a 20-minute presentation limits you to about 2,000 to 2,500 words. If you are to communicate effectively under such conditions, you must plan carefully. Begin by asking two questions. First, how long should you plan to talk? Usually there is an indication of the acceptable presentation length. It may be the custom in an organisation to take a given allotted time for a briefing. If the time is severely limited, then the need for topical priorities is obvious. This leads to the second question: What are the purposes of the briefing? Is it to raise concern about problems that have been uncovered?
Is it to add to the knowledge of audience members? Is it to give them conclusions and recommendations for their decision making? Questions such as these illustrate the general objectives of the report. After answering these questions, you should develop a detailed outline of what you are going to say. Such an outline should contain the following major parts:
1. Opening. A brief statement, probably not more than 10 percent of the allottted time, sets the stage for the body of the report. The opening should be direct, get attention, and introduce the nature of the discussion that follows. It should explain the nature of the project, how it came about, and what it attempted to do.
2. Findings and Conclusions. The conclusions may be stated immediately after the opening remarks, with each conclusion followed by the findings that support it.
3. Recommendations. Where appropriate, these are stated in the third stage; each recommendation may be followed by references to the conclusions leading to it. Presented in this manner, they provide a natural climax to the report. At the end of the presentation, it
may be appropriate to call for questions from the audience.
Early in the planning stage you need to make two further decisions. The first concerns the type of audiovisuals (AV) that will be used and the role they will play in the presentation. AV decisions are important enough that they are often made before the briefing outline and text are developed.
Then you must decide on the type of presentation. Will you give a memorized speech, read from your manuscript, or give an extemporaneous presentation? We rule out the impromptu briefing as an option because impromptu speaking does not involve preparation. Your reputation and the research effort should not be jeopardized by ‘winging it’. Memorization is a risky and time-consuming course to follow. Any memory slip during the presentation can be a catastrophe, and the delivery sound stilted and distant. Memorization virtually precludes establishing rapport with the audience and adapting to their reactions while you speak. It produces a self or speaker-centered approach and is not recommended.
Reading a manuscript is also not advisable even though many professors seem to reward students who do so (perhaps because they themselves get away with it at professional meetings). The delivery sounds dull and lifeless because most people are not trained to read aloud and therefore do it badly. They become focused on the manuscript to the exclusion of the audience. This head-down preoccupation with the text is clearly inappropriate for management presentations. The extemporaneous presentation is audience centered and made from minimal notes or an outline. This mode permits the speaker to be natural, conversational, and flexible.
Clearly, it is the best choice for an organisational setting. Preparation consists of writing a draft along with a complete sentence outline and converting the main points to notes. In this way, you can try lines of argument, experiment with various ways of expressing thoughts, and develop phraseology. Along the way, the main points are fixed sequentially in your mind, and supporting connections
are made.
Audiences accept notes, and their presence does wonders in allaying speaker fears. Even if you never use them, they are there for psychological support. Many prefer to use 5-by-8 inch cards for their briefing notes because they hold more information and so require less shuffling than the smaller 3-by-5 size. Card contents vary widely, but here are some general guidelines for their design:
• Place title and preliminary remarks on the first card.
• Use each of the remaining cards to carry a major section of the presentation. The amount of detail depends on the need for precision and the speaker’s desire for supporting information.
• Include key phrases, illustrations, statistics, dates and pronunciation guides for difficult words. Include also quotations and ideas that bear repeating.
• Along the margin, place instructions and cues, such as SLOW, FAST, EMPHASIZE, TRANSPARENCY A, TURN CHART, and GO BACK TO CHART 3.
Delivery
While the content is the chief concern, the speaker’s delivery is also important. A polished presentation adds to the receptiveness of the audience, but there is some danger that the presentation may overpower the message. Fortunately, the typical research audience knows why it is assembled, has a high level of interest, and does not need to be entertained. Even so, the speaker faces a real challenge in communicating effectively. The delivery should be restrained. Demeanor, posture, dress, and total appearance should be appropriate for the occasion. Speed of speech, clarity of enunciation, pauses, and gestures all play their part. Voice pitch, tone quality,
and inflections are proper subjects for concern. There is little time for anecdotes and other rapport-developing techniques, yet the speaker must get and hold audience attention.