

UNIVERSITY EXAMINATIONS: 2017/2018
EXAMINATION FOR THE CERTIFICATE IN BRIDGING MATHEMATICS
MAT 105: GRAPHS
DATE: DECEMBER, 2017 TIME: 1 ½ HOURS
INSTRUCTIONS: Answer Question ONE and any other TWO questions.
QUESTION ONE
a) On the Cartesian plane, plot the points A(2,1) & B (6,4) ( 4 Marks)
b) Determine the equation of the line joining points A & B above ( 5 Marks)
c) Determine the equation of the perpendicular line bisecting line AB above ( 5 Marks)
d) Graphically solve for the variables in the simultaneous equations below
i) x+3 y=7
ii) 2x−y=7 ( 7 Marks)
e) Graphically indicate the region of the Cartesian plane corresponding to the following set of
inequalities
i) 2 x+ y ≤8,
ii) x≥1
iii) y≥1 , ( 9 Marks)
QUESTION TWO
For an in – service course in mathematics, at least four but not more than nine teachers are to be chosen. The
ratio of the number of male teachers to the number of female teachers must be less than 2:1 and there must
be more males than females.
If x and y represent the number of male and female teachers respectively,
a) Write down in their simplest forms the inequalities that satisfy the
situation above ( 7 Marks)
b) Represent the inequalities in (a) above on the Cartesian plane ( 5 Marks)
c) From the results in (b) above, determine the composition of the in-service group with
i) The largest size ( 4 Marks)
ii) The smallest size ( 4 Marks)
QUESTION THREE
a) On the Cartesian plane, plot the graph of ![]()
for the
domain −2≤ x≤2 at intervals of 0.5 (12 Marks)
b) Graphically determine the gradient of the curve function in (a) above at the points where:
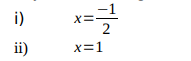
QUESTION FOUR
a) On the same axes and using the same scale, plot the graphs of
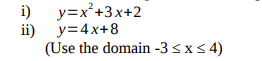
ii) y=4 x+8 (4 Marks)
(Use the domain -3 ≤ x ≤ 4)
b) Using the graphs in 4(a) above, determine the solutions to the simultaneous equations:
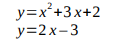
c) Determine the gradients of the quadratic function ![]()
at the points where the two
graphs intersect. ( 6 Marks)
QUESTION FIVE
In an experiment, the recorded velocity (v cm/s) at a distance (d cm) is given in the table below
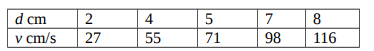
a) i) Plot these points on the Cartesian plane
(With v in the y axis and d in the x axis) (7 Marks)
ii) Plot a line of best fit (Let the line pass through the origin.) (3 Marks)
b) Using the graph in (a) above,
i) Determine the relationship between v and d and hence ( 5 Marks)
ii) Estimate the velocity when the distance travelled is 6cm ( 5 Marks)