5.1 Perfect Markets
Perfect market is a market with many buyers and sellers where nobody can determine the price of goods or services.
Characteristics
- Large number of buyer and sells where each individual firm supplies part of total quality supplied. Buyers are many such that no monopolistic powers can affect the working of the markets. Under this condition no individual firm or buyer can affect the market
- Free entry and free exist there are no barriers to entry or exit to the industries. Entry and exit from the industries may take time but firms have the freedom of movement in and out of the industry.
- Product homogeneity The industry is defined as group of firms producing homogenous product i.e. the technical characteristic as well as the service associated with product sold are identical. There is no why is which buyer can differentiate among the products of different firms.
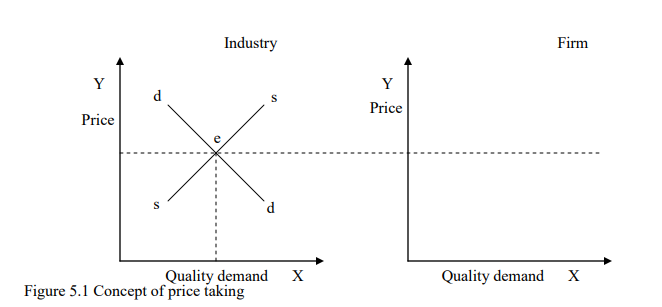
N/B: Under perfect competition firms are price takers. Meaning the demand curve of an individual firm will be perfectly elastic showing that the firm can sell any quantity of output at a given or prevailing market price. The concept of price taking is illustrated in
Figure 5.1
4. Profit maximization The goal of the firm is profit maximization both is the short run and in the long run. No other goal is pursued.
5. No government regulation. There is no government intervention in the operation of this market.
6. Perfect mobility of factors of production. Factors are free to move from one firm to another throughout the economy. It is assumed that there is perfect competition on the factor market.
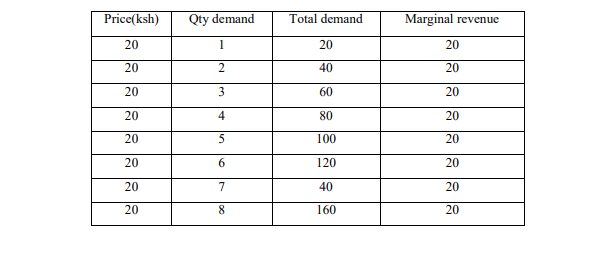
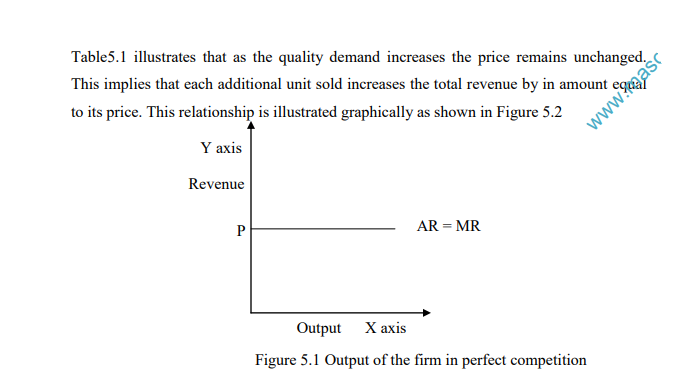
7. Perfect knowledge All sellers and buyers are assumed to have complete knowledge about the conditions in the market. This knowledge refers not only to prevailing condition in current but also for future periods. The revenue position of a perfectly competitive firm In perfect competition since each unit of out is sold at the same price both the average and marginal revenue are constant. This is illustrated in Table 5.1
The short run Recall that the short run is the context the theory of the firm is the period in which the quality of at least one factor of production is fixed. The level of output during this period of time can alter the utilization of variable factors. In the short run is the
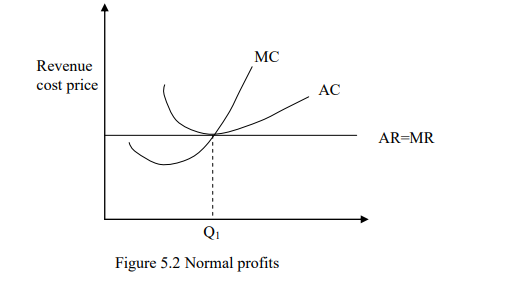
perfect competition can make normal profit, abnormal profits or losses
Normal profit This refers to the minimum level of profit which a firm must make in order to induce it to remain in operation. The level of normal profit varies from one industry to the other. This because of different level of risk and nature of the production process
involved in different industries. Normal profits may be considered be just past cost of production line since production will not continue unless at least this level of profit is attained.
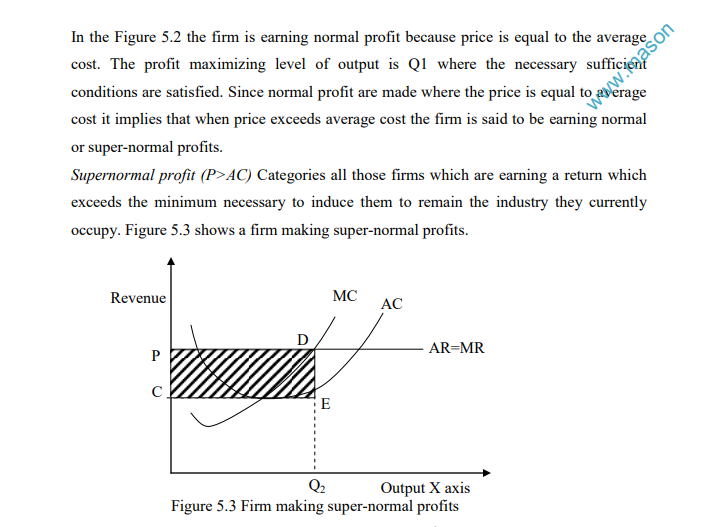
From Figure 5.3 when the level of output is Q2 the cost for unit is EQ2 and the price DQ2 supernormal profit is equal to CPDE which is represented by the scheduled area.
5.2 Monopoly
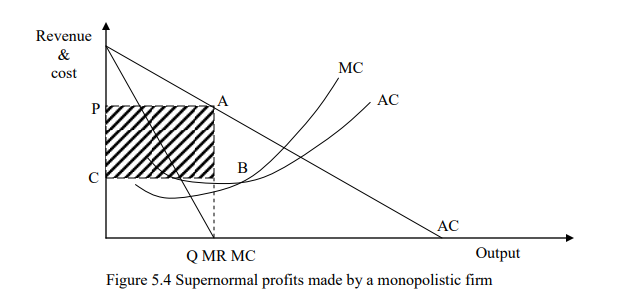
Monopolies are usually associated with economies of scale because of the large size of the market controlled by the firm. Economies of scale imply lower unit’s costs of production. It is likely that the consumer will benefit from this cost effectiveness through lower prices from a monopoly supplier. A monopolist like any other firm finds profit maximizing level of output where the marginal revenue is equal to marginal cost as shown in Figure 5.4. Monopoly firm maximizes profit at the level of output Q where the necessary and sufficient conditions of profit maximization are satisfied. The super normal profits earned by the monopolist are represented by the shaded area PCBX. This monopolist profit will persist in the long run since the are barriers to the entry in the industry. In the long run the monopoly can expand or use the existing plants at any level that will maximize profit. Owing to the existence of barriers it is unnecessary for the monopolist to reach the optimum scale of production which corresponds to the minimum point of the long run average curve.
Sources of monopoly power
Legal barriers This takes the form of statutory monopolies or patents i.e. monopolies established by an Act of parliament and patent meaning that a firm is protected from competition of new firms. Products differentiation barrier This may be in form of product uniqueness, advertisements and branding where an existing monopolist may exploit his position as a supplier of an established products which the customer is persuaded to believe that it is the best.
Economies of scale barriers could arise where existing firms are already operating on a vast scale production and enjoying technical economies of sale. Transport cost and tariff barriers Some firms may enjoy local monopoly position arising from the ability to sell more cheaply in their own localities than other firm. Such firms can therefore rise prices in their local markets above the production cost by an amount that does not exceed transport cost close of firm in other localities with similar production cost
Advantages of monopolies
- Economies scale
- No wastage of resources
- Price stability since monopolists are price makers
- Ability to carry out research and development to improve on their product
Disadvantages
- Diseconomies of scale arises in case the firm grows in a very large size, exploits the economies of scale and fails to achieve the
targeted economies of scale. - Inefficiency since there is no competition
- Lack of motivation though the firm is in a better financial position to research and develop there product the monopoly may fail to do so since there is no competition or a challenging firm.
- Consumers‟ exploitation .This is the most notorious practice of monopoly. This is done through overpricing and price discrimination of their products.
Price Discrimination
This exists where the same product is sold at different prices to different buyers. This depends on the tastes and preferences of the consumers, different periods of the firm, consumers‟ income etc. These factors will give rise to a demand curve with different
elasticities in different areas in the markets for the firms. Price discriminates is easily implemental by a monopolists since he controls the whole supply of a given good. There are two necessary conduction for price discrimination to take place:
1. The monopolist must effectively separate markets. If he has not separated the market the customers in the low price market will buy and sell the commodities those consumers in the higher price market.
2. The price elasticity of demand for the two markets must be different so that profitability will be realized. At every price the demand in any market must be elastic than the other where the low priced market have a more elastic demand than the high priced market. By selling the quality dined by the equation MC and MR at different price the monopolist realizes a higher total revenue and profits, the
monopolists realizes a higher total revenue and profits as compound to charging uniform prices.
N/B: suppose that a monopolist has two markets M1 and M2 the profit in each market maximized by equating marginal cost to the corresponding marginal revenue i.e.
In the first market; MR1=MC1
In the second market; MR2=MC2
That mean monopolist will maximize profit by equating the common market cost with
the individual market revenues as MC=MR1=MR2
5.3 Monopolistic Competition
This is a form of imperfect competition which lies between the extremes of perfect competition and monopoly and includes elements from both markets. Examples include: restaurants, hair dressers etc
Characteristics
1 There are many buyers and sellers in the market
2 The product of the sellers is differential yet very close substitute for each other
3 There is freedom of entry and exist of firms
4 The goal of the firms is profit maximization both in the short run and in the long run.
5 The prices of factors of production and technology are given. Under this competition, each producer sells a product which is to slightly different from that of the competitor and attempts to emphasize on differences like packaging and advertisements.
This process of creating the differences is called product differentiation which is aimed at creating brand loyalty. The firm demand curve will be relatively elastic since the products sold by the competition will be relatively close substitutes. Monopolistic firm sells
differentiated products therefore have limited control over the price. They are prices makers since they can raise their prices without loosing their customers and have to reduce the prices in order to sell more Short run equilibrium in monopolistic competition
In Figure 5.5 a firm operating under monopolistic competition makes supernormal profit in the short run as shown by PCAB. The supernormal profit will attract new firms into the industry and the surplus profit will be reduced to normal profit in the along-run as
shown in Figure 5.6
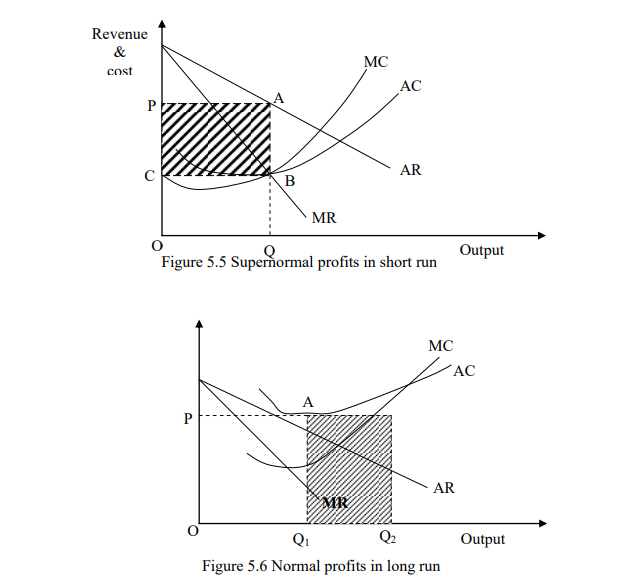
A firm in monopolistic competition in the long run will make normal profit since average revenue will be equal to average cost. The existence of many brands enhances the consumer choice and ability. However it is considered wasteful because of existence of
excess capacity shown by (Q2-Q1) which is carried (borne) by the consumer through prices. It is also in wasteful since the resources that could have been used in expansions and exploitation of economies of scale are used in advertising.
5.4 Oligopoly
This refers to the market structure dominates by large few firms. The number of sellers (firms) is small enough for other sellers to take account of each other i.e. if one seller changes his prices or uses non- price strategies his/her rivals would react. This is called
oligopolistic dependency.
Characteristics
1. Contains few firms who produce goods that are substitute but need to be perfect substitutes.
2 Lies somewhere between extreme of perfect competition are monopoly.
3 There are barriers to the entry.
4 Decision of the firms are strictly interdependent
5 Sellers agrees on the price or the market share
Forms of oligopoly
- Duopoly where market is dominated by two firms
- Pure oligopoly where the products of the few sellers are identical.
- Differentiated oligopoly where products are differentiated in term of quality packaging etc.
- Collusive oligopoly where the few sellers in the market come together and make decisions to control the prices, quality and quantity to be produced.
- Non collusive oligopoly where the few sellers determine their prices, quality and quantity without colluding.
Kinked Demand Curve
The interdependence in oligopolistic firms explains the price rigidity among the firms. The theory of kinked demanded curve suggests that firms in oligopoly face two sets of demand curves.
- Price increase
- Price reduction which is slightly inelastic
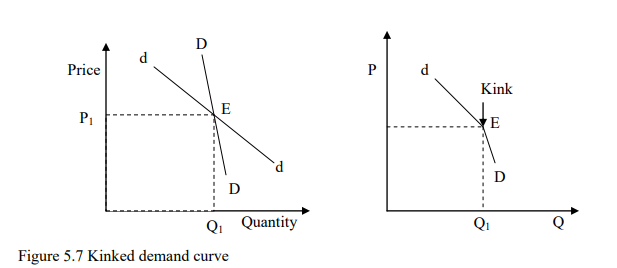
For price increases the firm is an elastic demand curve dd. For price decreases it is on the inelastic demand curve DD. This means the actual demand curve for firms is represented by dED. The demand is said to have a kink at point E associated with the price P1 and
quantity Q1. All firms in the industry are assumed to be in a similar position which implies that if a firm raises its prices and its competitor fails to follow suits then, it will loss large sales of revenue. This firms is on the elastic portion of the demand curve
If one firm reduces prices then, its competitors will have to reduce their price by at least a much or even more to retain the market share. When the price is lower each firm has the same market share which implies that the firms are on the inelastic portion of the demand curve. Collusion will take the form of agreeing the prices for each market share. This is done in order for the oligopolistic firms to maximize their joint profits and reduce uncertainty. A form of open collision is known as a cartel whereby firms produce
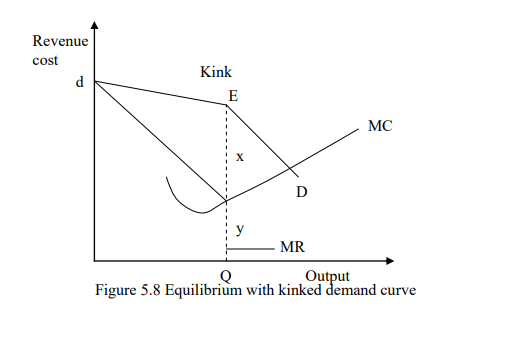
differently but act like determinants of price and output. Figure 5.8 shows the Equilibrium of an oligopolistic firm facing kinked demand curve.
The marginal revenue is discontinuous at the output level where there is a kink in the demand curve. The kink in the demand curve explains the nature of the marginal revenue curve. Where at point E and output Q the marginal revenue curve falls vertically since at
the higher price the marginal revenue curve correspond to less elastic demand curve. The firm maximizes its profit where the marginal cost is equal to marginal revenue. Its is very likely that the marginal cost curve will cut the marginal revenue curve between point X
and Y which corresponds to the discontinuous part of marginal revenue curve.