Logistics
Logistics is the management of the flow of goods and services between the point of origin and the point of consumption in order to meet the requirements of customers. Logistics involves the integration of information, transportation, inventory, warehousing, material handling, and packaging, and occasionally security. Logistics is a channel of the supply chain which adds the value of time and place utility. Today the complexity of production logistics can be modeled, analyzed, visualized and optimized by plant simulation software.
Distribution
Product distribution (or place) is one of the four elements of the marketing mix. An organization or set of organizations (go-betweens) involved in the process of making a product or service available for use or consumption by a consumer or business user.
The distribution channel
Distribution is also a very important component of Logistics & Supply chain management. Distribution in supply chain management refers to the distribution of a good from one business to another. It can be factory to supplier, supplier to retailer, or retailer to end customer. It is defined as a chain of intermediaries; each passing the product down the chain to the next organization, before it finally reaches the consumer or end-user. This process is known as the ‘distribution chain’ or the ‘channel.’ Each of the elements in these chains will have their own specific needs, which the producer must take into account, along with those of the all-important end-user.
COMPONENTS OF LOGISTICS
A business logistics system is made up of three main activities: order processing, inventory management, and freight transportation.
Order processing is concerned with the information flow in the logistics system and includes a number of operations. The beginning of the process consists of a request from a customer for a particular product via an order form. These orders are then transmitted and checked for completeness and accuracy. The availability of the requested product and the customer’s credit status are verified. Finally, products are retrieved from the stock, packed, and delivered along with their shipping documents. Throughout this entire process, the customers have to be kept informed about the status of their orders.
Inventory management is a key issue in logistics systems. Businesses choose to maintain inventories for a variety of reasons, including:
1. Improving service level.
2. Reducing overall logistics costs.
3. Making seasonal items available throughout the year.
4. Overcoming inefficiencies managing the logistics system.
The objective of inventory management is to regulate stock levels for minimizing total operating cost while satisfying customer service requirements.
Freight transportation plays an important role in today’s economy since it enables production and consumption to take place at locations far away from each other. Freight transportation accounts for two-thirds of total logistics costs and has a major impact on the level of customer service. Therefore, transportation planning plays a key role in logistics system management. A manufacturer or distributor can choose among three alternatives to transport its materials: private transportation, contract transportation, and public transportation.
The main modes of transportation used by logistics system management are ship, rail, truck, air, and pipeline. All are combined in numerous ways to obtain door-to-door services. Rail transport is inexpensive especially for long distance shipment and is more energy efficient than the alternatives. Trucks are used mainly for moving semi-finished and finished goods by the truck load or by partial truck load. Air transportation is often used in combination with road transportation to provide door-to-door service. Air transportation is theoretically the fastest mode of transportation but in practice it is slowed down by freight handling at airports.
The major advantages of using a logistics system are:
1. It helps capital reduction.
2. It reduces total cost of transportation.
3. It helps improve service level.
Logistics is a field that extensively utilizes information technology (IT) to perform daily tasks. In today’s world, logistics play a vital role in transportation of goods and will continue to play a major role in the coming decades.
PROCUREMENT PROCEDURES
Procurement is the purchase of goods or merchandise by a business, association, organization, or an individual. This simply means buying supplies from suppliers at the lowest possible price. The best way of doing this is to let the suppliers contend with each other so that the investment costs of the buyer are kept at a minimum.
Procurement more often than not involves a bidding process in which the bidders or vendors quote their prices and the purchasers agree to the lowest possible bid. This is the most proficient and gainful manner of obtaining supplies or services if the quality of the goods meets the buyers’ conditions.
The procedure of procurement usually commences when the purchaser starts to look for bidders in the market. After discovering the suppliers, a request is made for bids, proposals, quotes, and information. However, direct contact with bidders can also be made as an alternative for advertising all the above requests.
After choosing the suitable bidders, a quality check is necessary to verify the quality of the goods. The next step would be negotiation of the terms, conditions, and delivery schedules. Logistics and fees are the next two most important processes that decide the safe delivery and the payoff of the goods.
The procurement process can be divided into two parts, namely indirect procurement and direct procurement. Indirect procurement is that which deals with operational goods and direct procurement deals with the acquisition of goods that are considered raw material for the company’s manufacturing process.
The procurement procedure can differ depending on the merchandise and the uses of the product. Equipment needed for healthcare and other important industries need to be efficient and dependable and the procurement process is carried out carefully in order to shun the purchase of defective apparatus. Another important factor that usually influences the procurement procedure is the quantity in which the product is bought.
The procedure for acquiring goods may differ according to the product, price, availability, and market trends.
STORES AND WAREHOUSE MANGEMENT
Stores Management
A store manager is the person ultimately responsible for the day-to-day operations (or management) of a retail store. All employees working in the store report to the store manager. A store manager reports to a district or general manager.
Roles and responsibilities
Responsibilities of a store manager may include:
- Human Resources, specifically: recruiting, hiring, training and development, performance management, payroll, and schedule workplace scheduling
- Store business operations, including managing profit and loss, facility management, safety and security, loss prevention (also called shrink), and banking
- Product management, including ordering, receiving, price changes, handling damaged products, and returns
- Team Development, facilitating staff learning and development
- Problem solving, handling unusual circumstances
Sales generation
A store manager must meet monthly , quarterly, or annual sales goals, depending on the company’s fiscal cycle. This involves setting individual sales goals (quotas), holding contests for employees, or offering sales promotions. The manager may also receive a monetary incentive (or “bonus”) tied to financial performance over a specific period. This incentive may be based on net sales, profitability, or both. Thus, the store manager may be forced to reduce payroll expenditures by decreasing employees’ hours, or otherwise reducing operating costs.
The General manager must post Material Safety Data Sheets for their employees for any hazardous materials used in the store.
The Store manager is the store’s primary key-holder and may be called to the store before, during, or after business hours in the event of an emergency. They are also responsible for the safety of all customers and employees on store premises. Store managers may be required to hold safety meetings, especially as dictated by union practices in cases where store employees belong to a union.
Division of responsibility
A store manager may have several subordinates who have management-level responsibility. These employees may be called assistant managers, department managers, supervisors, keyholders, shift leads, or leads. A store manager has over-all responsibility for all day to day activity of the store. Managing & controlling staff, and planning are essential points of the store manager.
Hiring, training and development
The store manager is responsible for hiring, training, and in some cases, development, of employees. The manager must ensure staffing levels are adequate to effectively operate the store, and ensure employees receive training necessary for their job responsibilities. Managers may be responsible for developing employees so the company can promote employees from within and develop future leaders, potentially for employment at other locations. The role of store managers with regards to the other employees varies from company to company and each respective company’s operating methods but in general a store manager will be required to deal with and try and solve any issues adversely affecting an employee’s work. This is to done to prevent a drop in productivity and to make sure that the employee seeking help doesn’t end up being a casualty of the neccesary role of firing long term inefficient workers.
Visual merchandising and inventory control
Store managers ensure that visual merchandising is consistent with customers’ expectations of the brand.
In retail locations, store managers are responsible for visual merchandising. Many companies communicate how to merchandise their stores using direction such as planograms to indicate product placement. While managers have a varying degree of autonomy in deviating from corporate direction, it is important to ensure that stores are compliant with the company’s brand image. Managers must ensure that the proper amount of inventory is displayed for customers to purchase, by ensuring that shelves and racks remain stocked and that product is frequently rotated out of storage areas. Managers are also concerned with shrinkage, and must ensure that merchandising techniques and customer service skills minimize the possibility of product being stolen.
Warehouse management system
A warehouse management system, or WMS, is a key part of the supply chain and primarily aims to control the movement and storage of materials within a warehouse and process the associated transactions, including shipping, receiving, putaway and picking. The systems also direct and optimize stock putaway based on real-time information about the status of bin utilization.
Warehouse management systems often utilize Auto ID Data Capture (AIDC) technology, such as barcode scanners, mobile computers, wireless LANs and potentially Radio-frequency identification (RFID) to efficiently monitor the flow of products. Once data has been collected, there is either a batch synchronization with, or a real-time wireless transmission to a central database. The database can then provide useful reports about the status of goods in the warehouse.
The objective of a warehouse management system is to provide a set of computerized procedures to handle the receipt of stock and returns into a warehouse facility, model and manage the logical representation of the physical storage facilities (e.g. racking etc), manage the stock within the facility and enable a seamless link to order processing and logistics management in order to pick, pack and ship product out of the facility.
Warehouse management systems can be stand alone systems, or modules of an ERP system or supply chain execution suite.
The primary purpose of a WMS is to control the movement and storage of materials within a warehouse – you might even describe it as the legs at the end-of-the line which automates the store, traffic and shipping management.
In its simplest form, the WMS can data track products during the production process and act as an interpreter and message buffer between existing ERP and WMS systems. Warehouse Management is not just managing within the boundaries of a warehouse today, it is much wider and goes beyond the physical boundaries. Inventory management,inventory planning, cost management, IT applications & communication technology to be used are all related to warehouse management. The container storage, loading and unloading are also covered by warehouse management today.Warehouse management today is part of SCM and demand management. Even production management is to a great extent dependent on warehouse management. Efficient warehouse management gives a cutting edge to a retail chain distribution company. Warehouse management does not just start with receipt of material but it actually starts with actual initial planning when container design is made for a product. Warehouse design and process design within the warehouse (e.g. Wave Picking) is also part of warehouse management. Warehouse management is part of Logistics and SCM.
Warehouse Management monitors the progress of products through the warehouse. It involves the physical warehouse infrastructure, tracking systems, and communication between product stations.
Warehouse management deals with receipt, storage and movement of goods, normally finished goods, to intermediate storage locations or to final customer. In the multi-echelon model for distribution, there are levels of warehouses, starting with the Central Warehouse(s), regional warehouses services by the central warehouses and retail warehouses at the third level services by the regional warehouses and so on. The objective of warehousing management is to help in optimal cost of timely order fulfillment by managing the resources economically. Warehouse management = “Management of storage of products and services rendered on the products within the four walls of a warehouse”
CHANNELS OF DISTRIBUTION
Product distribution (or place) is one of the four elements of the marketing mix. An organization or set of organizations (go-betweens) involved in the process of making a product or service available for use or consumption by a consumer or business user.
The other three parts of the marketing mix are product, pricing, and promotion.
The distribution channel
Distribution is also a very important component of Logistics & Supply chain management. Distribution in supply chain management refers to the distribution of a good from one business to another. It can be factory to supplier, supplier to retailer, or retailer to end customer. It is defined as a chain of intermediaries, each passing the product down the chain to the next organization, before it finally reaches the consumer or end-user. This process is known as the ‘distribution chain’ or the ‘channel.’ Each of the elements in these chains will have their own specific needs, which the producer must take into account, along with those of the all-important end-user.
Channels
A number of alternate ‘channels’ of distribution may be available:
- Distributor, who sells to retailers,
- Retailer (also called dealer or reseller), who sells to end customers
- Advertisement typically used for consumption goods
Distribution channels may not be restricted to physical products alice from producer to consumer in certain sectors, since both direct and indirect channels may be used. Hotels, for example, may sell their services (typically rooms) directly or through travel agents, tour operators, airlines, tourist boards, centralized reservation systems, etc. process of transfer the products or services from Producer to Customer or end user.
There have also been some innovations in the distribution of services. For example, there has been an increase in franchising and in rental services – the latter offering anything from televisions through tools. There has also been some evidence of service integration, with services linking together, particularly in the travel and tourism sectors. For example, links now exist between airlines, hotels and car rental services. In addition, there has been a significant increase in retail outlets for the service sector. Outlets such as estate agencies and building society offices are crowding out traditional grocers from major shopping areas.
Channel decisions
Channel Sales is nothing but a chain for to market a product through different sources.
- Channel strategy
- Gravity & Gravity
- Push and Pull strategy
- Product (or service)
- Cost
- Consumer location
Managerial concerns
The channel decision is very important. In theory at least, there is a form of trade-off: the cost of using intermediaries to achieve wider distribution is supposedly lower. Indeed, most consumer goods manufacturers could never justify the cost of selling direct to their consumers, except by mail order. Many suppliers seem to assume that once their product has been sold into the channel, into the beginning of the distribution chain, their job is finished. Yet that distribution chain is merely assuming a part of the supplier’s responsibility; and, if they have any aspirations to be market-oriented, their job should really be extended to managing all the processes involved in that chain, until the product or service arrives with the end-user. This may involve a number of decisions on the part of the supplier:
- Channel membership
- Channel motivation
- Monitoring and managing channels
Type of marketing channel
- Intensive distribution – Where the majority of resellers stock the ‘product’ (with convenience products, for example, and particularly the brand leaders in consumer goods markets) price competition may be evident.
- Selective distribution – This is the normal pattern (in both consumer and industrial markets) where ‘suitable’ resellers stock the product.
- Exclusive distribution – Only specially selected resellers or authorized dealers (typically only one per geographical area) are allowed to sell the ‘product’.
Channel motivation
It is difficult enough to motivate direct employees to provide the necessary sales and service support. Motivating the owners and employees of the independent organizations in a distribution chain requires even greater effort. There are many devices for achieving such motivation. Perhaps the most usual is `incentive’: the supplier offers a better margin, to tempt the owners in the channel to push the product rather than its competitors; or a compensation is offered to the distributors’ sales personnel, so that they are tempted to push the product. Julian Dent defines this incentive as a Channel Value Proposition or business case, with which the supplier sells the channel member on the commercial merits of doing business together. He describes this as selling business models not products.
Monitoring and managing channels
In much the same way that the organization’s own sales and distribution activities need to be monitored and managed, so will those of the distribution chain.
In practice, many organizations use a mix of different channels; in particular, they may complement a direct sales force, calling on the larger accounts, with agents, covering the smaller customers and prospects. These channels show marketing strategies of an organization. Effective management of distribution channel requires making and implementing decision in these areas.
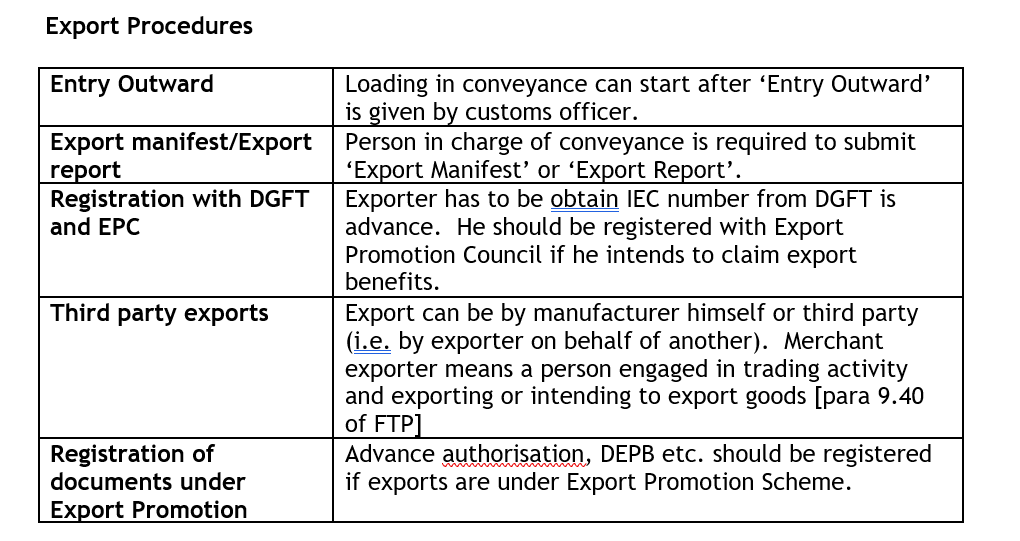
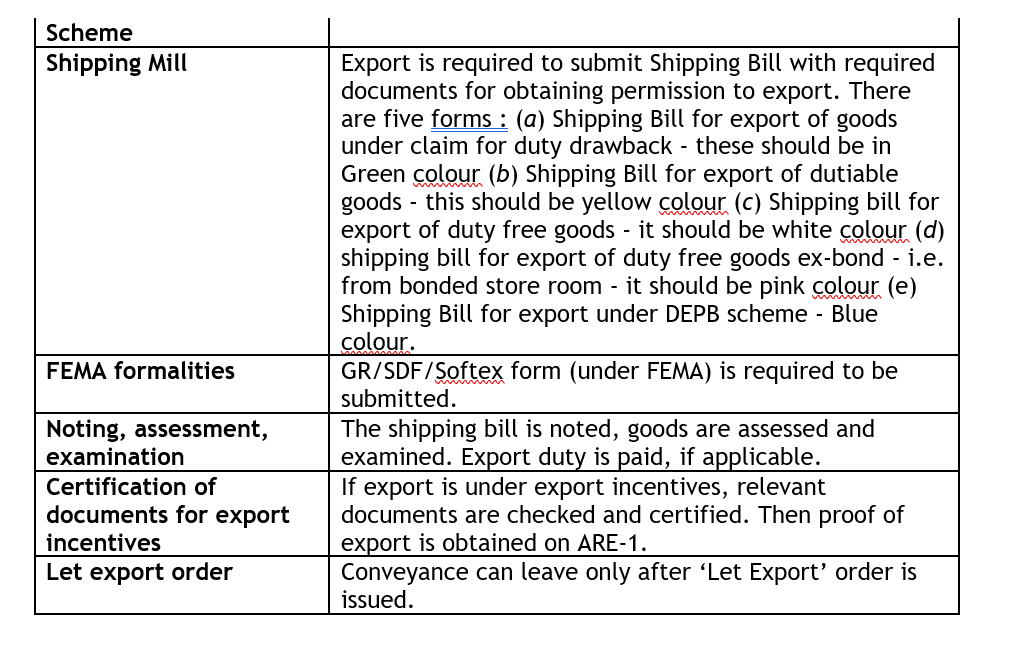
IMPORTS AND EXPORTS PROCEDURES
Kenya’s economy is market-based, with a few state-owned infrastructure enterprises, and maintains a liberalized external trade system. The country is generally perceived as Eastern and central Africa’s hub for Financial, Communication and Transportation services. As at May 2010, economic prospects are positive with 4-5% GDP growth expected, largely because of expansions in tourism, telecommunications, transport, construction and a recovery in agriculture. These improvements are supported by a large pool of English speaking professional workers. There is a high level of computer literacy, especially among the youth. The government, generally perceived as investment friendly, has enacted several regulatory reforms to simplify both foreign and local investment. An increasingly significant portion of Kenya’s foreign inflows is from remittances by non-resident Kenyans who work in the US, Middle East, Europe and Asia. Compared to its neighbors, Kenya has a well developed social and physical infrastructure. It is considered the main alternative location to South Africa, for major corporations seeking entry into the African continent.
Economic History
After independence, Kenya promoted rapid economic growth through public investment, encouragement of smallholder agricultural production, and incentives for private (often foreign) industrial investment. Gross domestic product (GDP) grew at an annual average of 6.6% from 1963 to 1973. Agricultural production grew by 4.7% annually during the same period, stimulated by redistributing estates, diffusing new crop strains, and opening new areas to cultivation. Between 1974 and 1990, however, Kenya’s economic performance declined. Kenya’s inward-looking policy of import substitution and rising oil prices made Kenya’s manufacturing sector uncompetitive. The government began a massive intrusion in the private sector. Lack of export incentives, tight import controls, and foreign exchange controls made the domestic environment for investment even less attractive.
From 1991 to 1993, Kenya had its worst economic performance since independence. Growth in GDP stagnated, and agricultural production shrank at an annual rate of 3.9%. Inflation reached a record 100% in August 1993, and the government’s budget deficit was over 10% of GDP. As a result of these combined problems, bilateral and multilateral donors suspended program aid to Kenya in 1991.
In 1993, the Government of Kenya began a major program of economic reform and liberalization. A new minister of finance and a new governor of the central bank undertook a series of economic measures with the assistance of the World Bank and the International Monetary Fund (IMF). As part of this program, the government eliminated price controls and import licensing, removed foreign exchange controls, privatized a range of publicly owned companies, reduced the number of civil servants, and introduced conservative fiscal and monetary policies. From 1994-96, Kenya’s real GDP growth rate averaged just over 4% a year.
In 1997, however, the economy entered a period of slowing or stagnant growth, due in part to adverse weather conditions and reduced economic activity prior to general elections in December 1997. In July 1997, the Government of Kenya refused to meet commitments made earlier to the IMF on governance reforms. As a result, the IMF suspended lending for three years, and the World Bank also put a $90 million structural adjustment credit on hold.
The Government of Kenya took positive steps on reform, including the 1999 establishment of the Kenyan Anti-Corruption Authority, and measures to improve the transparency of government procurements and reduce the government payroll. In July 2000, the IMF signed a $150 million Poverty Reduction and Growth Facility, and the World Bank followed suit shortly after with a $157 million Economic and Public Sector Reform credit.
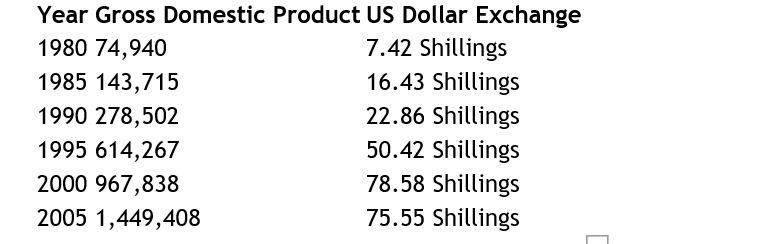
This is a chart of trend of gross domestic product of Kenya at market prices estimated by the International Monetary Fund with figures in millions of Kenyan Shillings.
Small scale businesses are providing a more and more jobs in Kenya. With increased but simplified regulations, they are able to blossom into large, legitimate businesses that can eventually create more jobs and government revenue.
Gross Domestic Product (GDP)
In 2006 Kenya’s GDP was about US$17.39 billion. Per capita GDP averages somewhat more than US$450 annually. Adjusted in purchasing power parity (PPP) terms, per capita GDP in 2006 was about US$1,200. The country’s real GDP growth picked up to 2.3 percent in early 2004 and to nearly 6 percent in 2005 and 2006, compared with a sluggish 1.4 percent in 2003 and throughout President Daniel arap Moi’s last term (1997–2002). Real GDP is expected to continue to improve, largely because of expansions in tourism, telecommunications, transport, and construction and a recovery in agriculture. The Kenya Central Bank forecast for 2007 is between 5 and 6 percent GDP growth. GDP composition by sector, according to 2004 estimates, was as follows: agriculture, 25.7 percent; manufacturing, 14.0 percent; trade, restaurants, and hotels, 13.8 percent; transport and communications, 6.9 percent; government services, 15.6 percent; and other, 24.0 percent.
Kenya’s 2010 Economic Performance and Outlook for 2011: In 2010, Kenya has seen the return of higher growth projected at 4.9 percent, and may now be at a tipping point for robust growth. Five factors are creating a positive momentum: the new constitution, EAC integration, ICT innovations, strong macroeconomic management, and recent investments in infrastructure. Services, the driver of previous years’ growth, have moderated while agriculture and industry are rebounding after two weak years. ICT has been the main driver of Kenya’s economic growth over the last decade, growing on average by 20 percent annually, and propelling the combined transport and communications sector into the economy’s second largest (after agriculture). Since 2000, Kenya’s economy grew at an average of 3.7 percent. Without ICT, growth in 2010 would have been a lackluster 2.8 percent–similar to the population growth rate–and income per capita would have stagnated. Over the last three decades Kenya has experienced only two short episodes when economic growth exceeded five percent and was sustained for at least three consecutive years: 1986-88 and 2004-2007. Economic growth in 2011-12 could range between 5.3 and 6.0 percent if no shocks occur. Public sector investments in infrastructure will help to stimulate this growth. However, the timely implementation of the constitutional reforms would also be necessary to help boost business confidence.
Industries
Agriculture
The agricultural sector continues to dominate Kenya’s economy, although only 15 percent of Kenya’s total land area has sufficient fertility and rainfall to be farmed, and only 7 or 8 percent can be classified as first-class land. In 2006 almost 75 percent of working Kenyans made their living on the land, compared with 80 percent in 1980. About one-half of total agricultural output is non-marketed subsistence production. Agriculture is the second largest contributor to Kenya’s gross domestic product (GDP), after the service sector. In 2005 agriculture, including forestry and fishing, accounted for about 24 percent of GDP, as well as for 18 percent of wage employment and 50 percent of revenue from exports. The principal cash crops are tea, horticultural produce, and coffee; horticultural produce and tea are the main growth sectors and the two most valuable of all of Kenya’s exports. In 2005 horticulture accounted for 23 percent and tea for 22 percent of total export earnings. Coffee has declined in importance with depressed world prices, accounting for just 5 percent of export receipts in 2005. The production of major food staples such as corn is subject to sharp weather-related fluctuations. Production downturns periodically necessitate food aid—for example, in 2004 aid for 1.8 million people⎯because of one of Kenya’s intermittent droughts.
Tea, coffee, sisal, pyrethrum, corn, and wheat are grown in the fertile highlands, one of the most successful agricultural production regions in Africa. Livestock predominates in the semi-arid savanna to the north and east. Coconuts, pineapples, cashew nuts, cotton, sugarcane, sisal, and corn are grown in the lower-lying areas.
Kenya’s Agriculture Performance in 2010: The agriculture sector has been rebounding in 2010 and is expected to grow by 5 percent. This is an important development after two consecutive years of decline, when the sector contracted by a combined 6.7 percent. Favourable weather conditions and specific policy interventions under the government’s economic stimulus program helped turn the sector around. The performance of Kenya’s main agriculture exports in 2010 was strongest for tea which recovered rapidly from 2009 weather conditions. A combination of volume and price increases will see the sector perform even better than in 2008, which had previously been the best year for the sector. Although coffee is benefitting from an increase in global prices, output contracted as coffee production was slow to recover from the prolonged drought in early 2009. Horticulture exports contracted for the third consecutive year. The sector continued to be affected by a muted recovery in Europe, especially the fruits and vegetables. In addition, the volcanic ash crisis in April 2010 disrupted access to the key source markers in Europe.
Forestry and fishing
Resource degradation has reduced output from forestry. In 2004 roundwood removals came to 22,162,000 cubic meters. Fisheries are of local importance around Lake Victoria and have potential on Lake Turkana. Kenya’s total catch reported in 2004 was 128,000 metric tons. However, output from fishing has been declining because of ecological disruption. Pollution, overfishing, and the use of unauthorized fishing equipment have led to falling catches and have endangered local fish species.
Mining and minerals
Kenya has no significant mineral endowment. The mining and quarrying sector makes a negligible contribution to the economy, accounting for less than 1 percent of gross domestic product, the majority contributed by the soda ash operation at Lake Magadi in south-central Kenya. Thanks largely to rising soda ash output, Kenya’s mineral production in 2005 reached more than 1 million tons. One of Kenya’s largest foreign-investment projects in recent years is the planned expansion of Magadi Soda. Apart from soda ash, the chief minerals produced are limestone, gold, salt, and fluorspar.[3]
Industry and manufacturing
Although Kenya is the most industrially developed country in East Africa, manufacturing still accounts for only 14 percent of gross domestic product (GDP). This level of manufacturing GDP represents only a slight increase since independence. Expansion of the sector after independence, initially rapid, has stagnated since the 1980s, hampered by shortages in hydroelectric power, high energy costs, dilapidated transport infrastructure, and the dumping of cheap imports. Industrial activity, concentrated around the three largest urban centers, Nairobi, Mombasa, and Kisumu, is dominated by food-processing industries such as grain milling, beer production, and sugarcane crushing, and the fabrication of consumer goods, e.g., vehicles from kits. Kenya also has an oil refinery that processes imported crude petroleum into petroleum products, mainly for the domestic market. In addition, a substantial and expanding informal sector engages in small-scale manufacturing of household goods, motor-vehicle parts, and farm implements. About half of the investment in the industrial sector is foreign, with the United Kingdom providing half. The United States is the second largest investor.
Energy
The largest share of Kenya’s electricity supply comes from hydroelectric stations at dams along the upper Tana River, as well as the Turkwel Gorge Dam in the west. A petroleum-fired plant on the coast, geothermal facilities at Olkaria (near Nairobi), and electricity imported from Uganda make up the rest of the supply. Kenya’s installed capacity stood at 1,142 megawatts a year between 2001 and 2003. The state-owned Kenya Electricity Generating Company (KenGen), established in 1997 under the name of Kenya Power Company, handles the generation of electricity, while the Kenya Power and Lighting Company (KPLC), which is slated for privatization, handles transmission and distribution. Shortfalls of electricity occur periodically, when drought reduces water flow. In 1997 and 2000, for example, drought prompted severe power rationing, with economically damaging 12-hour blackouts. Frequent outages, as well as high cost, remain serious obstacles to economic activity. Tax and other concessions are planned to encourage investment in hydroelectricity and in geothermal energy, in which Kenya is a pioneer. The government plans to open two new power stations in 2008, Sondu Miriu (hydroelectric) and Olkaria IV (geothermal), but power demand growth is strong, and demand is still expected to outpace supply during periods of drought.
Kenya has yet to find hydrocarbon reserves on its territory, despite several decades of intermittent exploration. Although Australia continues the search off Kenya’s shore, Kenya currently imports all crude petroleum requirements. Petroleum accounts for 20 to 25 percent of the national import bill. Kenya Petroleum Refineries—a 50:50 joint venture between the government and several oil majors—operates the country’s sole oil refinery in Mombasa, which currently meets 60 percent of local demand for petroleum products. In 2004 oil consumption was estimated at 55,000 barrels (8,700 m3) a day. Most of the Mombasa refinery’s production is transported via Kenya’s Mombasa–Nairobi pipeline.
Tourism
Kenya’s services sector, which contributes about 63 percent of GDP, is dominated by tourism. The tourism sector has exhibited steady growth in most years since independence and by the late 1980s had become the country’s principal source of foreign exchange. In the late 1990s, tourism relinquished this position to tea exports, because of a terrorism-related downturn. The downturn followed the 1998 bombing of the U.S Embassy in Nairobi and later negative travel advisories from Western governments. Tourists, the largest number from Germany and the United Kingdom, are attracted mainly to the coastal beaches and the game reserves, notably, the expansive Tsavo National Park (20,808 square kilometers) in the southeast. The government and tourist industry organizations have taken steps to address the security problem and to reverse negative publicity. Such steps include establishing a tourist police and launching marketing campaigns in key tourist origin markets. Tourism has seen a substantial revival over the past several years and is the major contributor to the pick-up in the country’s economic growth.
Tourism is now Kenya’s largest foreign exchange earning sector, followed by flowers, tea, and coffee. In 2006 tourism generated US$803 million, up from US$699 million the previous year.
Financial Services
Kenya is East and Central Africa’s hub for Financial services. The Nairobi Stock Exchange (NSE) is ranked 4th in Africa in terms of Market capitalization.
The Kenya banking system is supervised by the Central Bank of Kenya (CBK). As of late July 2004, the system consisted of 43 commercial banks (down from 48 in 2001), several non-bank financial institutions, including mortgage companies, four savings and loan associations, and several score foreign-exchange bureaus. Two of the four largest banks, the Kenya Commercial Bank (KCB) and the National Bank of Kenya (NBK), are partially government-owned, and the other two are majority foreign-owned (Barclays Bank and Standard Chartered). Most of the many smaller banks are family-owned and -operated.
Labor
In 2006 Kenya’s labor force was estimated to include about 12 million workers, almost 75 percent in agriculture. The number employed outside small-scale agriculture and pastoralism was about 6 million. In 2004 about 15 percent of the labor force was officially classified as unemployed. Other estimates place Kenya’s unemployment much higher, even up to 40 percent.
Government budget
In 2006 Kenya’s revenues totaled US$4.448 billion, while its estimated expenditures totaled US$5.377 billion. Government budget balance as a percentage of gross domestic product⎯a low –5.5 percent in 2004⎯had improved to –2.1 percent in 2006.
Foreign economic relations
Since independence, Kenya, a nonaligned country, has seen both substantial foreign investment and significant amounts of development aid, some from Russia, some from China and others from the West. Between 60 and 70 percent of industry is still owned from abroad. Kenya’s development assistance has come from increasingly diverse sources in recent years with China taking a increasingly higher prominent role than the west. The share of funding provided by the United Kingdom has fallen significantly, while that of multilateral agencies, particularly the World Bank and the European Development Fund, has increased. The most active investors currently are the Chinese.
Kenya is active within regional trade blocs such as the Common Market for Eastern and Southern Africa (COMESA) and the East African Community (EAC), a partnership of Kenya, Uganda, and Tanzania. The aim of the EAC is to create a common market of the three states modeled on the European Union. Among the early steps toward integration is the customs union which has eliminated duties on goods and non-tariff trade barriers among the members.
Kenya’s chief exports are horticultural products and tea. In 2005 the combined value of these commodities was US$1,150 million, about 10 times the value of Kenya’s third most valuable export, coffee. Kenya’s other significant exports are petroleum products, sold to near neighbors, fish, cement, pyrethrum, and sisal. The leading imports are crude petroleum, chemicals, manufactured goods, machinery, and transportation equipment. Africa is Kenya’s largest export market, followed by the European Union. The major destinations for exports are the United Kingdom (UK), Tanzania, Uganda, and the Netherlands. Major suppliers are the UK, United Arab Emirates, Japan, and India. Kenya’s main exports to the United States are garments traded under the terms of the African Growth and Opportunity Act (AGOA). Despite AGOA, Kenya’s apparel industry is struggling to hold its ground against Asian competition and runs a trade deficit with the United States.
Kenya typically has a substantial trade deficit. The trade balance fluctuates widely because Kenya’s main exports are primary commodities subject to the effects of both world prices and weather. In 2005 Kenya’s income from exports was about US$3.2 billion. The payment for imports was about US$5.7 billion, yielding a trade deficit of about US$2.5 billion.
In 2006 Kenya had a current account deficit of US$1.5 billion. This figure was a significant increase over 2005, when the current account had a deficit of US$495 million. In 2006 the current account balance as a percentage of gross domestic product was –4.2.[
In 2006 Kenya’s external debt totaled US$6.7 billion. The debt is forecast to be a manageable 30 percent of gross domestic product in 2007.
Kenyan policies on foreign investment generally have been favorable since independence, with occasional tightening of restrictions to promote the Africanization of enterprises. Foreign investors have been guaranteed ownership and the right to remit dividends, royalties, and capital. In the 1970s, the government disallowed foreign investment unless there was also some government participation in the ownership of an enterprise. Notwithstanding some restrictions, between 60 and 70 percent of industry is still owned from abroad, a significant portion of which can be traced to fraudulent asset transfers by the colonial Britain during transition to independence. This denied Kenyans the opportunity to progress economically – relegating most of them to poverty and creating conditions that would lead to dependency on foreign aid.
Criticism and Challenges
The economy’s heavy dependence on rain-fed agriculture and the tourism sector leaves it vulnerable to cycles of boom and bust. The agricultural sector employs nearly 75 percent of the country’s 38 million people. Half of the sector’s output remains subsistence production.
Kenya’s economic performance has been hampered by numerous interacting factors: heavy dependence on a few agricultural exports that are vulnerable to world price fluctuations, population growth that has outstripped economic growth, prolonged drought that has necessitated power rationing, deteriorating infrastructure, and extreme disparities of wealth that have limited the opportunities of most to develop their skills and knowledge. Poor governance and corruption also have had a negative impact on growth, making it expensive to do business in Kenya. According to Transparency International, Kenya ranks among the world’s half-dozen most corrupt countries. Bribery and fraud cost Kenya as much as US$1 billion a year. Kenyans, 23 percent living on less than US$1 per day, pay some 16 bribes a month—two in every three encounters with public officials. Another large drag on Kenya’s economy is the burden of human immunodeficiency virus/acquired immune deficiency syndrome (HIV/AIDS). Prospects significantly improved under the Kibaki government, whose policy aims include budgetary reforms and debt restraint.
Kenya’s economic policies have been subjected to criticism by western donors – especially when the policies do not ultimately benefit the West. There is debate as to the validity of, and motivations behind, such criticism.