Project Resources
Resources can be defined as the physical means necessary to carry out an activity. This includes skilled human resource in specific discipline, equipment, services, supplies, commodities, materials, budgets or funds.
Project resources for scheduling include the following;
- People/human resources
- Objects
- Tools
- Machines equipment
- Money/finance
- Information
- Space
- Goodwill etc
Categories of Resources in Project Management
Resources in project management can be categorized into three;
- Exhaustible Resources
These are resources which after use are no longer available for use in the project ie. The replenishment of these resources is impossible.
Examples of exhaustible resources in project includes.
- Time
- Fossil fuels e.g. coal, oil, natural gas, mineral deposits.
Note: exhaustible resources are considered in feasibility studies and strategic planning but are mot considered in resource scheduling except time.
- Replenishable Resources
These are resources obtained through purchase. These include materials and components which are re-availed by buying fresh supplies.
Examples of replenishable resources includes’
- Money/funds ie. Can be acquired if become short
- Materials used during construction
- Agriculture crops and their products in the long run
- Re-usable Resources
These are resources which are required for use in a project but which remain available for reuse after each task has been performed. Re-usable resources are like chemical catalyst because they are used to facilitate an activity but remain unchanged. Levels of re-usable resources tend to remain stable over the long term and can be scarce and therefore require careful planning and scheduling.
Examples of re-usable resources include:
- Special skills, talent, experience or knowledge in a project team member
- Facilitating equipment e.g. Crashes can be used severally in different project giving the same results. Industrial plants and other machinery
- Test centers
- Motor vehicles etc.
- Factory
- Offline space
Principles of Resource Scheduling
The resources should be allocated to the activity where they are most needed and activity with least float is given the highest priority. Fundamental priority rules for resources scheduling: the resources scheduling is governed by the choice between two planning options/priorities.
Important Checklist (elements) of effective schedule
- Time scale predicted by plan should be achievable
- Inclusion of all significant tasks
- Placement of tasks in logical sequence with dependencies between them clearly shown.
- Levels of details shown should allow progress check against events or activities at a reasonably frequent interval.
- The plan should communicate i.e. plan should be visually effective
- Clearly identified critical tasks
- Qualified tasks priorities
- People and other resources should be scheduled so that they match the plan.
Methods of specifying resources availability levels on project activities
- Estimating the level of efficiency for each department or resource type This is done by assuming lower efficiency utmost 80% leaving 20% for 2 lodge factors due to resource wastage attributed to
- Absenteeism
- Time spent in cloakroom
- Equipment breakdown etc.
Project should not be scheduled with the intention of using resources during overtime.
Planning for changes in resource availability levels
The extent and timing of planned changes of resources should be available from the organization’s long term budgets and manpower plans.
- Using different calendars for resource scheduling calendar is a record of important tasks to be done each day in a year. In project meeting different calendars include;
- Default calendar of five days per week recognized by computer software – conventional
- Weekend calendar – this special calendar will include resource schedule for days of the weekend ie. Saturday and Sunday
- Shift working calendar – this is where the resources are scheduled for twenty four hours. 24 hours may be divided into two or three shifts.
- Holiday’s calendars – these are calendars where no work is done and resources are not allocated for these day. Treated as reduction of resources stated to be available and is included in 20% sludge factor in determining the resources efficiency.
Scheduling Labour Costs
This involves scheduling estimated expenditure on labour by specifying unit cost rate for each resource as well as estimated cost for each activity.
- The scheduling of labour cost against project activities is important because it set out predicted project cost against the scheduled time scale which provides one of the essential ingredients for cost control and cash flow management.
- Computer programs may be used in the scheduling of labour cost as well as other scheduled. The labour scheduling may be done in two approaches depending on resource constraints.
- Scheduling using normally available staff using default calendar.
- Scheduling considering threshold level i.e. assuming that the available resources may be overstretched.
The role of network in resources scheduling
Network logic shows only those constraints between activities that are related to the logical preferred sequence of working. It demonstrates critical path and activities floats which guide the resource scheduling. This is to say that a network cannot be used by itself to demonstrate the volume of resources needed at any given point in a project time. When drawing a network, resources availability is not a factor of consideration because the start of each activity is usually assumed to be dependent only upon the completion of its preceding activities and not availability of the resources at the right time.
Network diagram is drawn on the basis of logic and experience of the project activities in a sense that it demonstrates preceding and succeeding activities. This gives a guide on how to schedule resources on critical activities.
Network diagram demonstrates which activity should be given preference when allocating resources on the basis of floats and criticality. For example; based on experience and logic, if one plan for several activities to share one kind of resources, then it is impossible to complete those activities on their earliest completion time because it is not practicable for one resource to be used at different places at one time of the project this implies that where the resources are strained the completion time must be delayed naturally because the earliest start time of the succeeding activities must also be delayed. In this case where one is planning, one should not estimate the duration of any activity at a level which demands the employment of more resources on that activity as a matter of logic and experience.
Since network does not demonstrate the volume of the resources needed or available, network construction and time analysis should be the first essential step in the wider process determined by establishment of critical path and floats.
The result of time analysis determine the activity priority, therefore when different activities competes simultaneously for the same resources, priority rule is applied so that the resources are allocated when they are needed the most. The activities with least floats in a network are given priority in resources allocation in order to complete them at their earliest completion time.
Techniques and tools used in scheduling
- Gantt charts
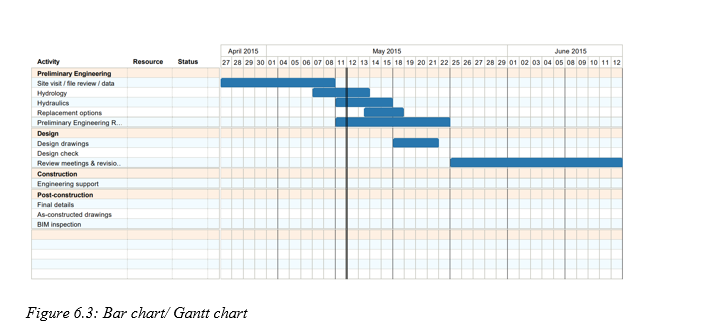
Gantt chart is a scheduling technique in which activities are represented by bars drawn to a time scale against a time base. Gantt chart is a Brain-child of industrial Engineer Henry Gantt 1861-1919. Activities are listed on the extreme left column and the time frame put on the right side indicated in days of the month. Bar charts are drawn where the horizontal axis is directly proportional to time. Each horizontal bar represents a project task, its length scaled according to its expected duration. Each horizontal bar represents a project task, its length scaled according to its expected duration. The name or description of each job is written on the same row usually at the left hand edge of the chart. Gantt chart is a widely used technique in simple project scheduling. A sketch of a Gantt chart is illustrated as shown below.
Table 6.3 A sketch of a Gantt chart

Advantages of Gantt Chart
- Direct correlation with time
- Straight forward relationship with projects involving a limited number of tasks
- Straight forward integration pf subtasks having separate scheduling charts
- Time schedule is flexible and is expanded to show tasks of shorter nature
- Progress against the plan is easily reflected
- Simple to draw and read
- Good for static environment
- Useful for providing overview of project activities
- Widely used
- Provide basis of the graphical interface for most personal computer software
Limitations of Gantt Chart
- Difficult to update manually where there are many changes i.e. can easily become absolute and discredited for it’s difficult in rescheduling.
- Does not equate time with cost
- Does not help in optimizing resource allocation
- Has a problem of interpretation and scaling especially for long duration products
- Not easily used to indicate the independent relationship between tasks
Uses of Bar charts (Gantt chart)
- Planning
- Scheduling resources
That it does not convey the complex interrelationships that may occur between tasks.
In the Gantt chart, there are usually two bars, one for planning and the other one for actual which are illustrated with different colour if a computer software for project management is used.
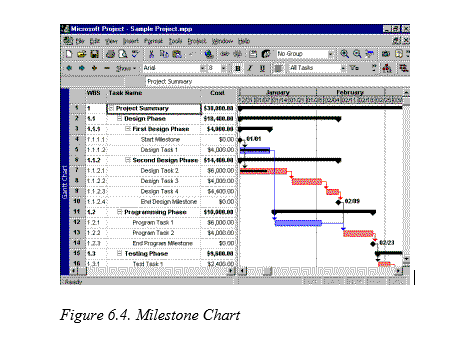
Milestone Chart
A milestone chart is similar to a Gantt chart with that the emphasis placed on task completion (refer to figure below). It embodies the same simplified techniques as does the Gantt chart. However, it does not portray the interrelationships between tasks and hence does not identify the critical path. A milestone is the selected major event chosen to represent the start of a new phase or the completion of major deliverables.
Networks logic diagram in scheduling
Network diagram is a schematic display of logical relationships of the project activities always drawn from left to right to reflect a project chronology. Logic is a collection of activities dependencies that makes up a prject network diagram. Therefore, a logical relationship is a relationship between two project activities. The four possible types of logical relationships which also describe the time constraints in project time scheduling include;
- Finish to start – an activity must finish before another activity can start
- Finish to finish – an activity must finish before activity can finish
- Start to finish – an activity must start before the activity can finish
- Start to start – an activity must start before an activity can start.
Network Analysis
This is a process of identifying early and late start and finish time (dates) for the uncompleted portion of project activities.
Benefits of network diagram on the project
- It enables the interaction of the various activities to be shown graphically and clearly.
- It enables spare time of float to be found where it exists so that advantage can be taken to reduce resources if necessary.
- It can pinpoint potential bottlenecks and trouble spots
- It enables conflicting priorities to be resolved in the most economical manner
- It gives an up to date picture of progress
- It acts as a communication document between all disciplines and parties.
- It shows all parties the intent of the method of construction
- It acts as a focus for discussion at project meetings
- It can be expanded into subnets showing greater detail or contracted to show the chief overall milestones.
- If updated in colour pencil, it can act as a spur between rival gangs of workers.
- It is very rapid and cheap to operate and is a base for earned value analysis (EVA)
- It is quickly modified if circumstances warrant it
- It can be used when formulating claims, as evidence of disruption due to late decisions or delayed drawings and equipment
- Network of past jobs can be used to draft proposal networks for future jobs.
- Network stimulate discussion provided everyone concerned is familiar with them.
- It can assist in formulating a cash-flow chart to minimize additional funding
- They form the basis of all planning and predicting and help management decide how to use its resources to achieve time and cost goals.
- They provide visibility and enable management to control “one of a kind” programs.
- They help management evaluate alternatives by answering such questions as how time delays will influence project completion, where slack exists between elements , and what elements are crucial to meet the completion date.
- They provide a basis for obtaining facts for decision making.
- They utilize a so called network analysis as the basic method to determine manpower, material and capital requirements, as well as to provide a means for checking progress.
- They identify the longest path or critical path.
- They aid in scheduling risk analysis.
Network Analysis
Network analysis is a generic term traced back to development in Europe and extensively used in US defense planning with success in the 1950s. Network, unlike bar chart are not drawn in scale. They simply show all the projects tasks in their logical sequence and just-positions. They can be time scaled or not, but time scaled network is not commonly used.
Strengths of Network Diagrams
Shows critical path networks which provide more powerful notations needed to show all the logical interdependencies between different jobs for example; Brick layering will not be scheduled to start before foundation is ready.
- Allows priorities to be quantified based on the analysis of all the tasks duration estimates.
Those tasks which cannot be delayed without endangering project completion on time are identified as critical and all other tasks ca be ranked according to their degree of criticality.
Note;
Network cannot by themselves be used for network scheduling. However, because of quantifying priorities and highlighting critical jobs, it contributes significantly to resource scheduling as a complementary tool to get chart which is a superior tool for resources scheduling.
Precedence network diagram
This is a network technique in which the network activities are represented by boxes (or nodes). Schedule activities are graphically linked by one or more logical relationships to show the sequence in which activities are to be performed.
Description of precedence diagram
Activities
The activity identity and description is shown in the node.
- Direction
The flow of activities/work in ta precedence diagram always is drawn fom left to right
- Scale
Just like O-A-O diagram, precedence diagrams are not drawn to scale i.e. the line linking boxes and also boxes sizes does not matter.
- Activity identifiers
These are numbers/ codes used in a network to identify the activity and are necessary for computer processing. These codes are put in the node. The code number can range from small serial number to complex alphanumeric codes depending on the size and complexity of the networks and the capacity of the computer software for accommodating long identity numbers. (refer to figure drawing A-0-A)
- Programme Evaluation and Review Technique
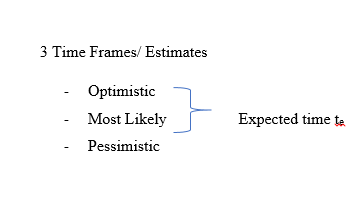
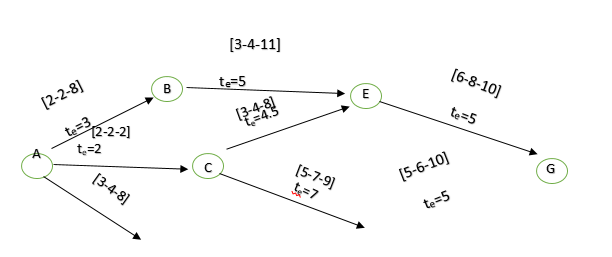
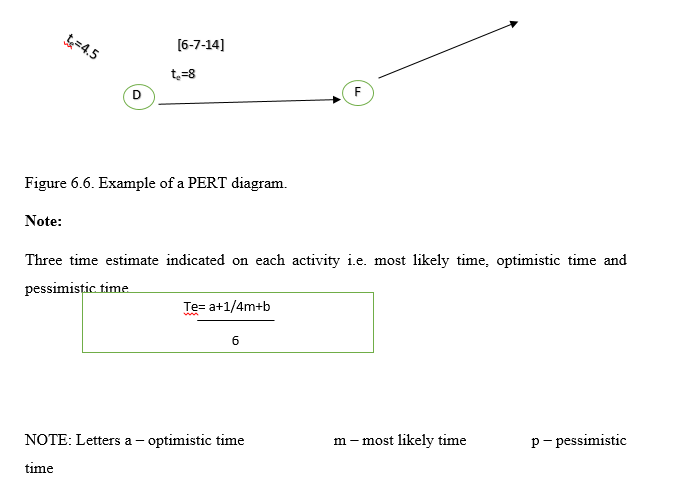
This is an event oriented analysis technique used to estimate project duration when there is a high degree of uncertainty (stochastic environment) where three types of time estimate most likely time, optimistic and pessimistic time are used instead of a single time estimate (not deterministic time).
PERT was initially developed in 1958 and 1959 to meet the needs of the “age of massive engineering” where the techniques of Taylor and Gantt were inapplicable. The special project office of the U.S Navy concerned with performance trends on large military development programs introduced PERT on its Polaris Weapon system in 1958 after the technique had been developed with the air of the management consulting firm of Booze, Allen and Hamilton. Since that time, PERT has spread rapidly almost throughout in all industries. About the same time, the Dupont Company initiated a similar techniqueknown as the Critical Path Method (CPM), which also has spread widely, and is particularly concentrated in the construction and processing industries. In the early 1960s, the basic requirements of PERT/time as established by the Navy were as follows:
- All of the individual tasks to complete a program must be clear enough to be put down in a network, which comprises events and activities; that is; all the activities follows the work breakdown structure.
- Events and activities must be sequenced on the network under a highly logical set of ground rules that allow the determination of critical and sub-critical paths. Networks may have more than one hundred events, but no fewer than ten.
- Time estimates must be made for each activity on a three-way basis. Optimistic, most likely and pessimistic elapsed – time figures are estimated by the person(s) most familiar with the activity.
- Critical times and slack times are computed. The critical path is that sequence of activities and events whose accomplishment will require the greatest time.
The case for and against use of PERT
The big advantage of PERT lies in its extensive planning. Network development and Critical Path Analysis reveal interdependencies and problems that are not obvious with other planning methods. PERT;
- Therefore determines where the greatest effort should be made to keep a project on schedule
- The second advantage of PERT is that one can determine the probability of meeting deadlines by development of alternative plans. If the decision maker is statistically sophisticated, he can examine the standard deviations and the probability of accomplishment data. if there is existence of a minimum of uncertainty, one may use the single – time approach, of course, while retaining the advantage of network analysis.
- A third advantage is the ability to evaluate the effect of changes in the program. For example, PERT can evaluate the effect of a contemplated shift of resources from the less critical activities to the activities identified as probable bottle necks. PERT can also evaluate the effect of a deviation in the actual time required for an activity from what has been predicted.
- Finally, PERT allows a large amount of sophisticated data to be presented in a well-organised diagram from which contractors and clients can make joint decisions.
- PERT, unfortunately, is not without disadvantages. The complexity of PERT adds to the implementation problems. There exist more data requirements for PERT-organised reporting system than for most others =. PERT, therefore, becomes expensive to maintain and is utilized most often on large, complex problems.
Many companies have taken a hard look at the usefulness of PERT on small projects. The result has been the development of PERT/LOBS procedures, which can do the following:
- Cut project costs and time
- Coordinate and expedite planning
- Eliminate idle time
- Provide better scheduling and control of subcontractor activities
- Develop better trouble shooting procedures
- Cut the time required for routine decisions, but allow more time for decision making
Even with this advantage, many companies should ask whether they actually need PERT because incorporating it may be difficult and costly, even with canned software packages. Criticism of PERT includes:
- Time and labour intensive
- Decision-making ability reduced
- Lacks historical data for time cost-estimates
- Assumes unlimited resources
- Required too much detail
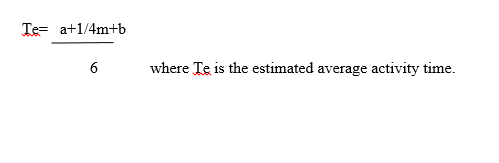
PERT uses probability theory for estimating activity duration. It allows for uncertainty to be incorporated in estimation. It incorporates 3 time estimates.
- The most optimistic time estimate (a)
- The most likely time estimate (m)
- The most pessimistic time estimate (b)
Using these, one is able to determine the expected activity using the formula: