FUNDAMENTAL PRINCIPLES OF
ECONOMICS
UNIT
Key unit competence: By the end of the unit, you should be able to:
(a) Demonstrate a good understanding of the fundamental economic
principles.
(b) Demonstrate the applicability of the fundamental economic
principles in daily life.
2.1: DEFINITION OF THE FUNDAMENTAL PRINCIPLES OF ECONOMICS
Case study
Budgeting
Human beings hardly get satisfied in life. Those who are unemployed
wish one day to be employed. The employed on their part, wish to get a
promotion and a salary increase. Those with small vehicles desire to own
bigger vehicles like Toyota Prados. Those owning bigger vehicles wish they
could own jets. People living in rural areas want to move to urban areas,
while those in urban areas want to own land in rural areas. Countries too
desire to own some assets but they cannot access them.
(a) Identify other scenarios showing that human beings, families or
governments are never satisfied.
(b) Why is this always the case?
(c) Suggest any solutions to the above scenarios.
Human wants are unlimited and the resources to satisfy them are limited.
As a result, the basic principles of Economics explain this concept. These
principles further show the fundamental problems of human beings in their
bid to try and use the scarce resources to satisfy the unlimited wants. These
principles are:
(a) Scarcity
(b) Choice
(c) Opportunity cost
a) Scarcity
This refers to the limited supply or insufficiency of resources in satisfying the
needs of an individual, family or state, in relation to the unlimited wants. Due
to the problem of scarcity, one has to make rational choices by satisfying the
most pressing wants first and then the least pressing ones last.
As a result, there is need to prioritise by making a list of one’s wants in order
of satisfaction. In the list, the most pressing needs are put at the top to be
satisfied first, then the less pressing ones are put last on that list. This list is
known as the scale of preference.
b) Choice
Choice refers to the act of making the right decision at the right time so as to
use limited or scarce resources to satisfy the unlimited wants. For instance,
a student who has a fixed amount of money can opt to buy a textbook to
use in the classroom, rather than buying sports shoes to be wearing over the
weekends.
c) Opportunity cost
This refers to the second best alternative foregone when a choice is made. It
can be illustrated using the opportunity cost curve, which shows the amount
sacrificed on one commodity in order to get more of another.
2.2: PRODUCTION POSSIBILITY FRONTIER (PPF)
Activity 2.1
Utexrwa Industries produce two products: Shirts (Y) and Trousers (X). It
can produce the following quantities using the same level of resources.
Combination Quantity of trouser (X) Quantity of shirts (Y)
X 0 150
A 20 100
B 30 80
C 40 60
D 50 40
Y 60 0
(a) Refer to the table on page 23. Discuss (in groups of five) what the firm
can do to increase on production of Trousers (X).
(b) Derive the production possibility frontier (PPF) by plotting the quantities
of Y on the y-axis and the quantities of X on the x- axis. Later, join the
points.
(c) Carry out research on the assumptions on which the PPF is based and
the importance of the PPF. Make a power point presentation.
A production possibility frontier (PPF) is a locus of points showing the
possible combinations of two commodities that can be produced when all
the resources are fully utilised. It is also called the transformation curve or
the opportunity cost curve.
(a) Assumptions of the PPF
• It assumes that only two commodities are produced.
• It assumes that the level of technology is fixed and constant.
• It assumes that all resources are fully utilised.
• It assumes that similar resources will be used to produce either or both
of the two goods.
(b) Importance of the PPF
• The PPF shows whether there is economic growth or decline in the
country. An outward shift indicates economic growth. An inward shift
indicates economic decline.
• The PPF shows the rate of unemployment by showing the rate at which
resources are employed or utilised. Points along the PPF show full
employment and utilisation of resources. Points inside the PPF show
the unemployment and underutilisation of resources.
• The PPF shows the combination of goods and services that can be
produced in an economy.
• It indicates technological advancement within an economy. When the
level of production increases, the PPF shifts outwards. This indicates
technological advancement.
The hypothetical possibility schedule
| Combination | Quantity of X | Quantity of Y |
| X | 0 | 200 |
| E | 50 | 180 |
| A | 100 | 150 |
| F | 150 | 120 |
| X 1 |
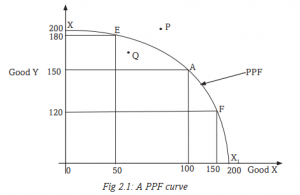
In the above illustration, X and X
1 are the possibilities in which the producer
can produce either 200 units of Good Y only or 200 units of Good X only
with given resources. However, the assumption is that both are produced.
There are therefore various combinations E, A and F that can be produced.
On combination E, 180 units of Good Y are produced and 50 units of Good
X are produced. On combination A, 150 units of Good Y are produced and
100 units of Good X are produced. At combination F, 120 units of Good Y
and 150 units of Good X are produced.
The PPF shows that when more units of Good X are produced, less units
of Good Y are produced. This implies that the producer withdraws some
resources from the production of Good Y and uses them in producing
more units of Good X. This transforms resources producing Good Y into
production of Good X. It is for this reason that the curve is also called a
transformation curve.
As resources are moved from production of Good X to production of Good
Y, the efficiency is lost hence same level of output is not achieved as the
trade off is not proportional. This explains why the PPF curve is convex.
Point Q inside the PPF, indicates that the level of output is attainable but
undesirable. This is because rationality requires that one prefers more to
less. Point P outside the PPF, is not attainable using the available resources.
However, it may be attained should the available resources be increased.
2.3 THE RELATIONSHIP BETWEEN SCARCITY, CHOICE AND
OPPORTUNITY COST
Activity
In groups of five, discuss the relationship between scarcity, choice and
opportunity cost, using the PPF above. Make presentations after the
discussion.
The PPF indicates what is attainable and what is not attainable given the
level of resources. Due to scarcity of resources, a producer cannot produce
the maximum level of output for both the two goods at once. The producer
makes a choice to either produce more of Good X and less of Good Y and
vice- versa. If the producer produces more of Good X he foregoes units of
Good Y (opportunity cost) as shown by the PPF.
2.4 SHIFTS IN THE PPF
Activity
(a) In groups of five, visit the library and carry out research on the shifts in
the PPF.
(b) After undertaking the research, discuss inward and outward shifts of
the PPF.
(c) Explain the reasons why the PPF may shift inwards or outwards.
The PPF may shift inwards or outwards. A shift of the PPF inwards indicates
economic decline while a shift outwards indicates economic growth.
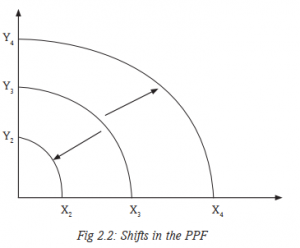
An outward shift from Y
3X3 to Y4X4 indicates economic growth. This may be
due to any of the following reasons:
• Discovery of new natural resources.
• Advancement in technology that leads to production of more goods
and services.
• Expansion of markets that encourage production of more goods and
services.
• Improvement in the skills of labour that results into efficiency in
production.
• Increased investment as a result of improved entrepreneurship skills.
An inward shift from Y
3 X3 to Y2 X2 indicates an economic decline. Similarly,
there is a reduction in the quantity produced of both Goods Y and X. This
may be due to any of the following reasons:
• Lack of new natural resources.
• Decline in the invention and use of technology that leads to production
of poor quality and fewer goods and services.
• No new markets that encourage production of more goods and services.
• Decline in the availability of trained manpower, through retrenchment
of workers. This results into less output and inefficiency in production.
• Decreased investment as a result of poor entrepreneurship skills.
2.4.1 Types of PPF
1. Common PPF: This is a PPF where there is an increase in opportunity
cost as the production of one good is increased.
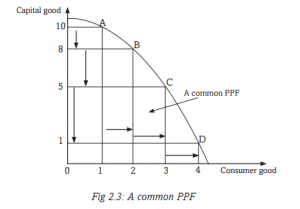
From the above PPF, in order to produce an additional unit of consumer
good, two units of capital goods have to be foregone. But additional unit of
consumer good, will cause three units of capital goods to be foregone and
another additional unit of consumer good will cause four units of capital
good to be foregone. A common PPF is also known as a concave PPF.
2. Inverted PPF: This is a PPF where the opportunity cost is decreasing
with each of one good.
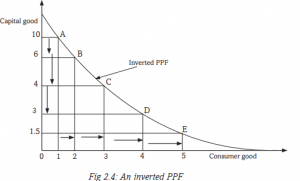
From the above PPF, to produce an additional unit of consumer good, four
units of capital good are foregone. But another additional unit of consumer
good will cause two units of capital good to be foregone. Any further
additional unit of consumer goods will cause one unit of capital goods to
be foregone. Opportunity cost will continue to decrease with any additional
unit of consumer goods being produced. An inverted PPF is also known as
a convex PPF.
3. A straight line PPF: This is a PPF where the opportunity cost is constant
with an increase in the production of one good.
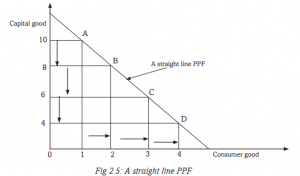
From the above PPF, an increase in production of one unit of consumer goods
causes an opportunity cost of two units of capital goods. Each subsequent
production of one additional unit of consumer goods will have a constant
opportunity cost of two units of capital goods. A straight line PPF is also
known as a constant PPF.
4. Biased PPF: This is a PPF that shifts outwards in favour of one commodity
only. In this case, the PPF shifts outwards more in one direction than the
other. This is caused by improvement in technology and increased factors of
production that are in favour of one commodity.
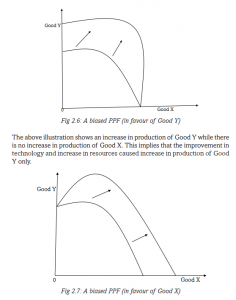
The above illustration shows an increase in production of Good X with no
increase in production of Good Y. This implies that the improvement in
technology and increase in resources was in favour of production of Good X
only, causing an increase in production of Good X.
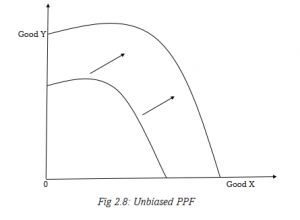
Unbiased PPF: This is the PPF that shifts evenly such that, there is
an increase in production of both goods. This therefore implies that an
improvement in technology and increase in resources favours both goods,
thereby causing an increase in production of both Goods X and Y.
In allocating resources in the production of goods and services, countries
and production firms face a number of fundamental economic questions.
These fundamental economic questions include:
What to produce
Here the firm needs to decide on the nature of the goods to produce. The
firm may decide to produce capital goods or consumer goods.
b) How to produce
The producer has to decide on the methods and techniques to be used in
the production process. The producer may decide to use capital intensive
techniques of production or labour intensive techniques of production. The
technique of production minimises costs while at the same time maximises
the level of output.
c) When to produce
The producer is required to decide whether to produce now or to produce in
future. The producer is normally guided by the demand for the products in
the market. The best time for production is when the demand for the goods
or services is the highest.
d) Where to produce
The producer has to determine on the location of his or her firm or industry.
The location will depend on availability of the market, the source of raw
materials, security and transport and communication networks. All in all, a
thorough assessment of the impact of that firm to the environment must be
carried out and evaluated.
e) For whom to produce
The producer considers the target consumers that will use the goods to be
produced. The produce may be for the young, the rich, the poor, the rural
people or for the urban people.