
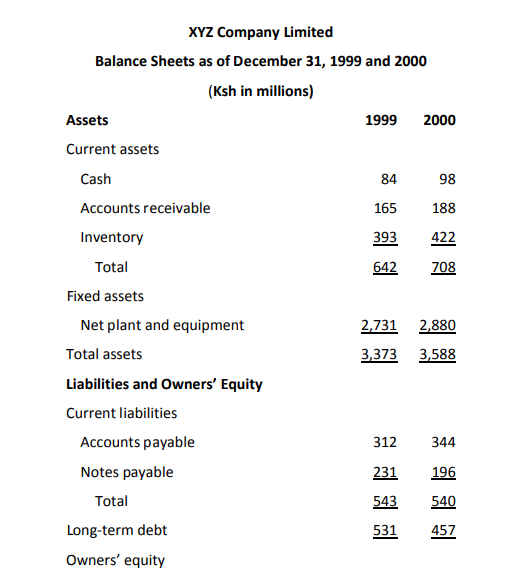
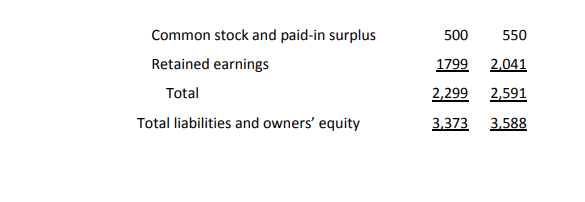
4.0 Financial Analysis
Financial analysis is a process by which an accountant or finance manager or any other interested party identifies the financial strength or position of a company by comparing the relationship between items in the balance sheet and those in the profit and loss account. Thus financial analysis is of paramount importance to all parties with a financial stake in the company as they will use such analysis to gauge the profitability and safety of their stake in the company. These parties can be grouped into the following classes;
- Shareholders who are the real owners of the company on credit
- Creditors who supply goods to the company on credit
- Lenders who supply the company with loan finance
- Directors and management of the company
- Potential investors who may want to invest in the company
- The general public who may include customers
- Competitors
- The government
4.1 Ratio Analysis
Another way of avoiding the problems involved in comparing companies of different sizes financial ratios is used to calculate and compare financial ratios. Such ratios are ways of comparing and investigating the relationships between different pieces of financial information. We cover some of the more common ratios namely;
- Short-term solvency, or liquidity, ratios
- Long-term solvency, or financial leverage ratios
- Asset management or turnover, ratios
- Profitability ratios
- Market value ratios
We will consider each of these in turn. In calculating these ratios for XYZ, we will use the ending balance sheet (2000) figures unless explicitly stated. Also notice that the various ratios are italicized to indicate which numbers come from the income statement and which come from the balance sheet
4.1.1 Short-Term Solvency, or Liquidity, Measures.
These are used to gauge the company’s ability to settle its currents obligations as and when they fall due. Thus they try to ascertain the relationship between the company’s current assets and its current liabilities. As the name suggests, short-term solvency ratios as a group are intended to provide information about a firm’s liquidity, and these ratios are sometimes called liquidity measures. The primary concern is the firm’s ability to pay its bills over the short run without undue stress. Consequently, these ratios focus on current assets and current liabilities. For obvious reasons, liquidity ratios are particularly interesting to short-term creditors. Since
financial managers are constantly working with banks and other short-term lenders, an understanding of these ratios is essential.
1. Current Ratio
This is used to gauge the company’s quantity o its current assets to its current liabilities. The current ratio is defined as:
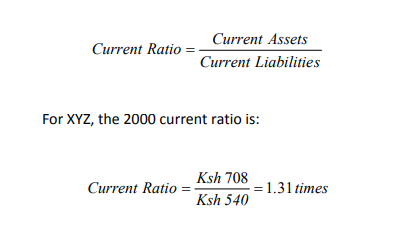
Because current assets and liabilities are, in principle, converted to cash over the following 12 months, the current ratio is a measure of short-term liquidity. The unit of measurement is either Ksh or times. So, we could say XYZ has Ksh1 .31 in current assets for every Ksh1 in current liabilities, or we could say XYZ has its current liabilities covered 1 .31 times over. To a creditor, particularly a short-term creditor such as a supplier, the higher the current ratio, the better. To the firm, a high current ratio indicates liquidity, but it also may indicate an inefficient use of cash and other short-term assets. The above ratio is a test of the company’s quantity of current assets rather than quality. This means that items in the current assets aside should be critically analyzed before they are assumed to cover current liabilities well.
2. Quick (or Acid-Test) Ratio
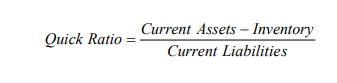
This ratio measures the quality of the company’s current and its current liabilities. An asset is said to be liquid if it is either in cash form or can be converted into cash without any loss in value whatsoever. Inventory is often the least liquid current asset. Relatively large inventories are often a sign of short-term trouble. The firm may have overestimated sales and overbought or overproduced as a
result. In this case, the firm may have a substantial portion of its liquidity tied up in slow-moving inventory. The quick, or acid-test, ratio is computed just like the current ratio, except inventory is omitted:
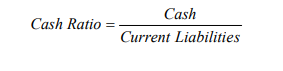
3. Cash Ratio
A very short-term creditor might be interested in the cash ratio:
4.1.2 Long-Term Solvency Measures
Long-term solvency ratios are intended to address the firm’s long-run ability to meet its obligations, or, more generally, its financial leverage. These ratios are sometimes called financial leverage ratios or just leverage ratios. We consider three commonly used measures and some variations.
1. Total Debt Ratio
The total debt ratio takes into account all debts of all maturities to creditors. It can be defined in several ways. The easiest of which is:
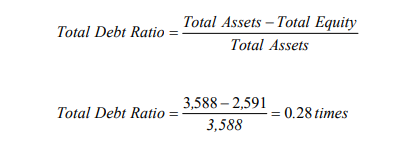
In this case, an analyst might say that XYZ uses 28 percent debt. Whether this is high or low or whether it even makes any difference depends on whether or not capital structure matters. XYZ has Ksh.28 in debt for every Ksh1 in assets. Therefore, there is Ksh.72 in equity (Ksh1 – .28) for every Ksh.28 in debt. With this in mind, we can define two useful variations on the total debt ratio, the debt-equity ratio and the equity multiplier:
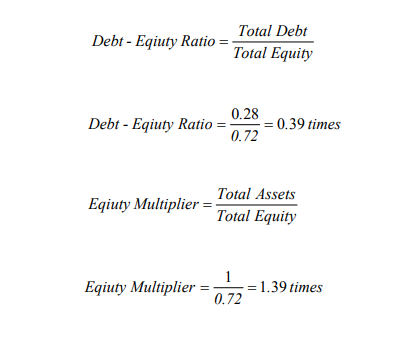
The fact that the equity multiplier is 1 plus the debt-equity ratio is not a coincidence:
Equity multiplier = Total assets/Total equity = Ksh.l/Ksh.72 = 1.39
= (Total equity + Total debt)/Total equity
= I + Debt-equity ratio = 1.39 times
The thing to notice here is that given any one of these three ratios, you can immediately calculate the other two, so they all say exactly the same thing.
2. Times Interest Earned
Another common measure of long-term solvency is the times interest earned (TIE) ratio. Once again, there are several possible (and common) definitions, but we’ll stick with the most traditional:
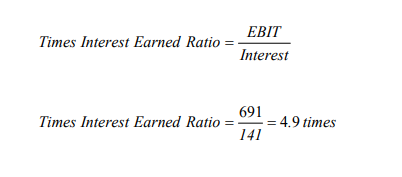
As the name suggests, this ratio measures how well a company has its interest obligations covered, and it is often called the interest coverage ratio. For XYZ, the interest bill is covered 4.9 times over.
3. Cash Coverage
A problem with the TIE ratio is that it is based on EBIT, which is not really a measure of cash available to pay interest. The reason is that depreciation, a non- cash expense, has been deducted out. Since interest is most definitely a cash outflow (to creditors), one way to define the cash coverage ratio is:
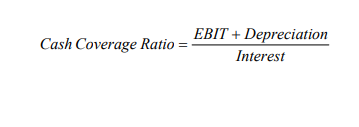
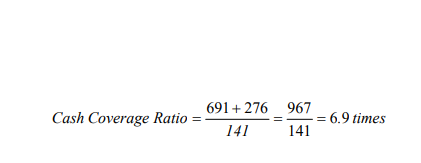
The numerator here, EBIT plus depreciation, is often abbreviated EBDIT (earnings before depreciation, interest, and taxes). It is a basic measure of the firm’s ability to generate cash from operations, and it is frequently used as a measure of cash flow available to meet financial obligations.
4.1.3 Asset Management, or Turnover, Measures
We next turn our attention to the efficiency with which XYZ uses its assets. The measures in this section are sometimes called asset utilization ratios. The specific ratios we discuss can all be interpreted as measures of turnover. What they are intended to describe is how efficiently, or intensively, a firm uses its assets to generate sales. We first look at two important current assets,
inventory and receivables.
1. Inventory Turnover and Days’ Sales in Inventory During the year, XYZ had a cost of goods sold of Ksh1,344. Inventory at the end of the year was Ksh422. With these numbers, inventory turnover can be calculated as:
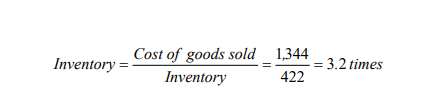
In a sense, XYZ sold off, or turned over, the entire inventory 3.2 times. As long as we are not running out of stock and thereby forgoing sales, the higher this ratio is, the more efficiently we are managing inventory. If we know that we turned our inventory over 3.2 times during the year, then we can immediately figure out how long it took us to turn it over on average. The result is the average days’ sales in inventory:
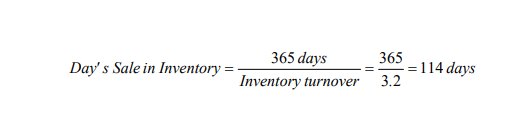
This tells us that, roughly speaking, inventory sits 114 days on average before it is sold. Alternatively, assuming we used the most recent inventory and cost figures, it will take about 114 days to deplete current inventory.
2. Receivables Turnover and Days’ Sales in Receivables Our inventory measures give some indication of how fast we can sell products. We now look at how fast we collect on those sales. The receivables turnover is defined in the same way as inventory turnover:

Loosely speaking, XYZ collected our outstanding credit accounts and reloaned the money 2.3 times during the year. Here we have implicitly assumed that all sales are credit sales. If they were not, then we would simply use total sales in these calculations, not total sales. This ratio makes more sense if we convert it to days, so the days’ sales in receivables is:
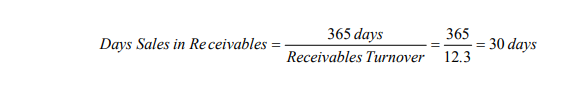
Therefore, on average, XYZ collects credit sales in 30 days. For obvious reasons, this ratio is very frequently called the average collection period (ACP). Also note that if we are using the most recent figures, we can also say that XYZ has 30 days’ worth of sales currently uncollected.
3. Total Asset Turnover
Moving away from specific accounts like inventory or receivables, we can consider an important “big picture” ratio, the total asset turnover ratio. As the name suggests, total asset turnover is:
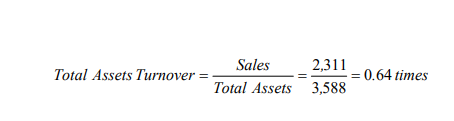
In other words, for every Ksh in assets, we generated Ksh.64 in sales. A closely related ratio, the capital intensity ratio, is simply the reciprocal of (that is, 1 divided by) total asset turnover. It can be interpreted as the Ksh investment in assets needed to generate Ksh1 in sales. High values correspond to capital intensive industries (such as public utilities). For XYZ, total asset turnover is .64, so, if we flip this over, we get that capital intensity is Ksh1/.64 = Ksh1.56. That is, it takes XYZ Ksh1.56 in assets to create Ksh1 in sales.
4.1.4 Profitability Measures
A company operates on funds contributed by its owners and lenders. These parties need sufficient return on their money. For this reason the efficiency of any company is measured by the amount of profits it makes in a given period of time.for purposes of analyzing these rartios the profitability of a company can be related to: its investment in assets and sales generated.
The three measures we discuss in this section are probably the best known and most widely used of all financial ratios. In one form or another, they are intended to measure how efficiently the firm uses its assets and how efficiently the firm manages its operations. The focus in this group is on the bottom line, net income.
1. Profit Margin
This ratio gauges the efficiency with which the company can generate a given level of profits out of its sales activities.
Companies pay a great deal of attention to their profit margin:

This tells us that XYZ, in an accounting sense, generates a little less than 16 cents in profit for every Kshs in sales. All other things being equal, a relatively high profit margin is obviously desirable. This situation corresponds to low expense ratios relative to sales. However, we hasten to add that other things are often not equal. For example, lowering our sales price will usually increase unit volume, but will normally cause profit margins to shrink. Total profit (or, more importantly, operating cash flow) may go up or down; so the fact that margins are smaller isn’t necessarily bad.
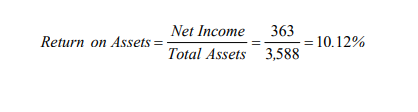
2. Return on Assets
Return on assets (ROA) is a measure of profit per Ksh of assets. It can be defined several ways, but the most common is:
3. Return on Equity
Return on equity (ROE) is a measure of how the stockholders fared during the year. Since benefiting shareholders is our goal, ROE is, in an accounting sense, the true bottom-line measure of performance. It gauges the management’s efficiency in utilizing both creditors and owner’s money. It also indicates the return a company will give to both owners and creditors. ROE is usually measured as:
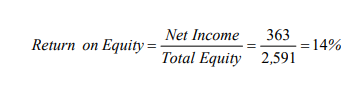
For every Ksh in equity, therefore, XYZ generated 14 cents in profit, but, again, this is only correct in accounting terms. Because ROA and ROE are such commonly cited numbers, it is important to remember they are accounting rates of return. For this reason, these measures should properly he called return on book assets and return on book equity. In addition, ROE is sometimes called return on net worth. Whatever it’s called, it would be inappropriate to compare the result to, for example, an interest rate observed in the financial markets. The fact that ROE exceeds ROA reflects XYZ use of financial leverage.
4.1.5 Market Value Measures
These ratios try to portray the company’s dividend policy and thus its abilities to pay reasonable dividends to its shareholders. The final group of measures is based, in part, on information not necessarily contained in financial statements-the market price per share of the stock. Obviously, these measures can only be calculated directly for publicly traded companies. We assume that XYZ has 33 million shares outstanding and the stock sold for Ksh 88 per share at the end of the year. If we recall that XYZ net income was Ksh 363 million, then we can calculate that its earnings per share were:
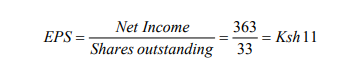
This ratio indicates how much a share will earn if there was no retention. It will indicate the potential return to the shareholders.
1. Price-Earnings Ratio
This indicates how long the company will take to pay back the original cost of investment if there were no retention The first of our market value measures, the price-earnings, or PE, ratio (or multiple), is defined as:
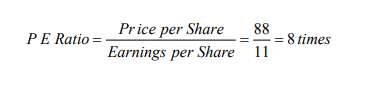
In the vernacular, we would say that XYZ shares sell for eight times earnings, or we might say that XYZ shares have, or “carry,” a PE multiple of 8. Since the PE ratio measures how much investors are willing to pay per Ksh of current earnings, higher PEs are often taken to mean that the firm has significant prospects for future growth. Of course, if a firm had no or almost no earnings, its PE would probably be quite large; so, as always, care is needed in interpreting this ratio.
2. Market-to-Book Ratio
A second commonly quoted measure is the market-to-book ratio.
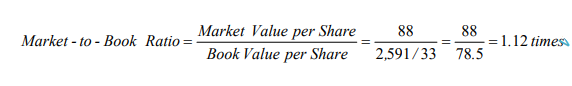
Notice that book value per share is total equity (not just common stock) divided by the number of shares outstanding. Since book value per share is an accounting number, it reflects historical costs. In a loose sense, the market-to-book ratio therefore compares the market value of the firm’s investments to their cost. A value less than I could mean that the firm has not been successful overall in creating value for its stockholders.
Summary
The only meaningful yardstick for evaluating business decisions is whether or not they create economic value .We recognize that accounting numbers are often just pale reflections of economic reality, but they frequently are the best available information. For privately held corporations, not-for-profit businesses, and smaller firms, for example, very little direct market value information exists at all. The accountant’s reporting function is crucial in these circumstances.
Clearly, one important goal of the accountant is to report financial information to the user in a form useful for decision making. Ironically, the information frequently does not come to the user in such a form. This chapter is a first step in filling this gap by providing means of evaluating financial statements.