
TOPIC ONE
OVERVIEW OF FINANCIAL STATEMENT ANALYSIS
MASOMO MSINGI PUBLISHERS APP – Click to download and access all our materials
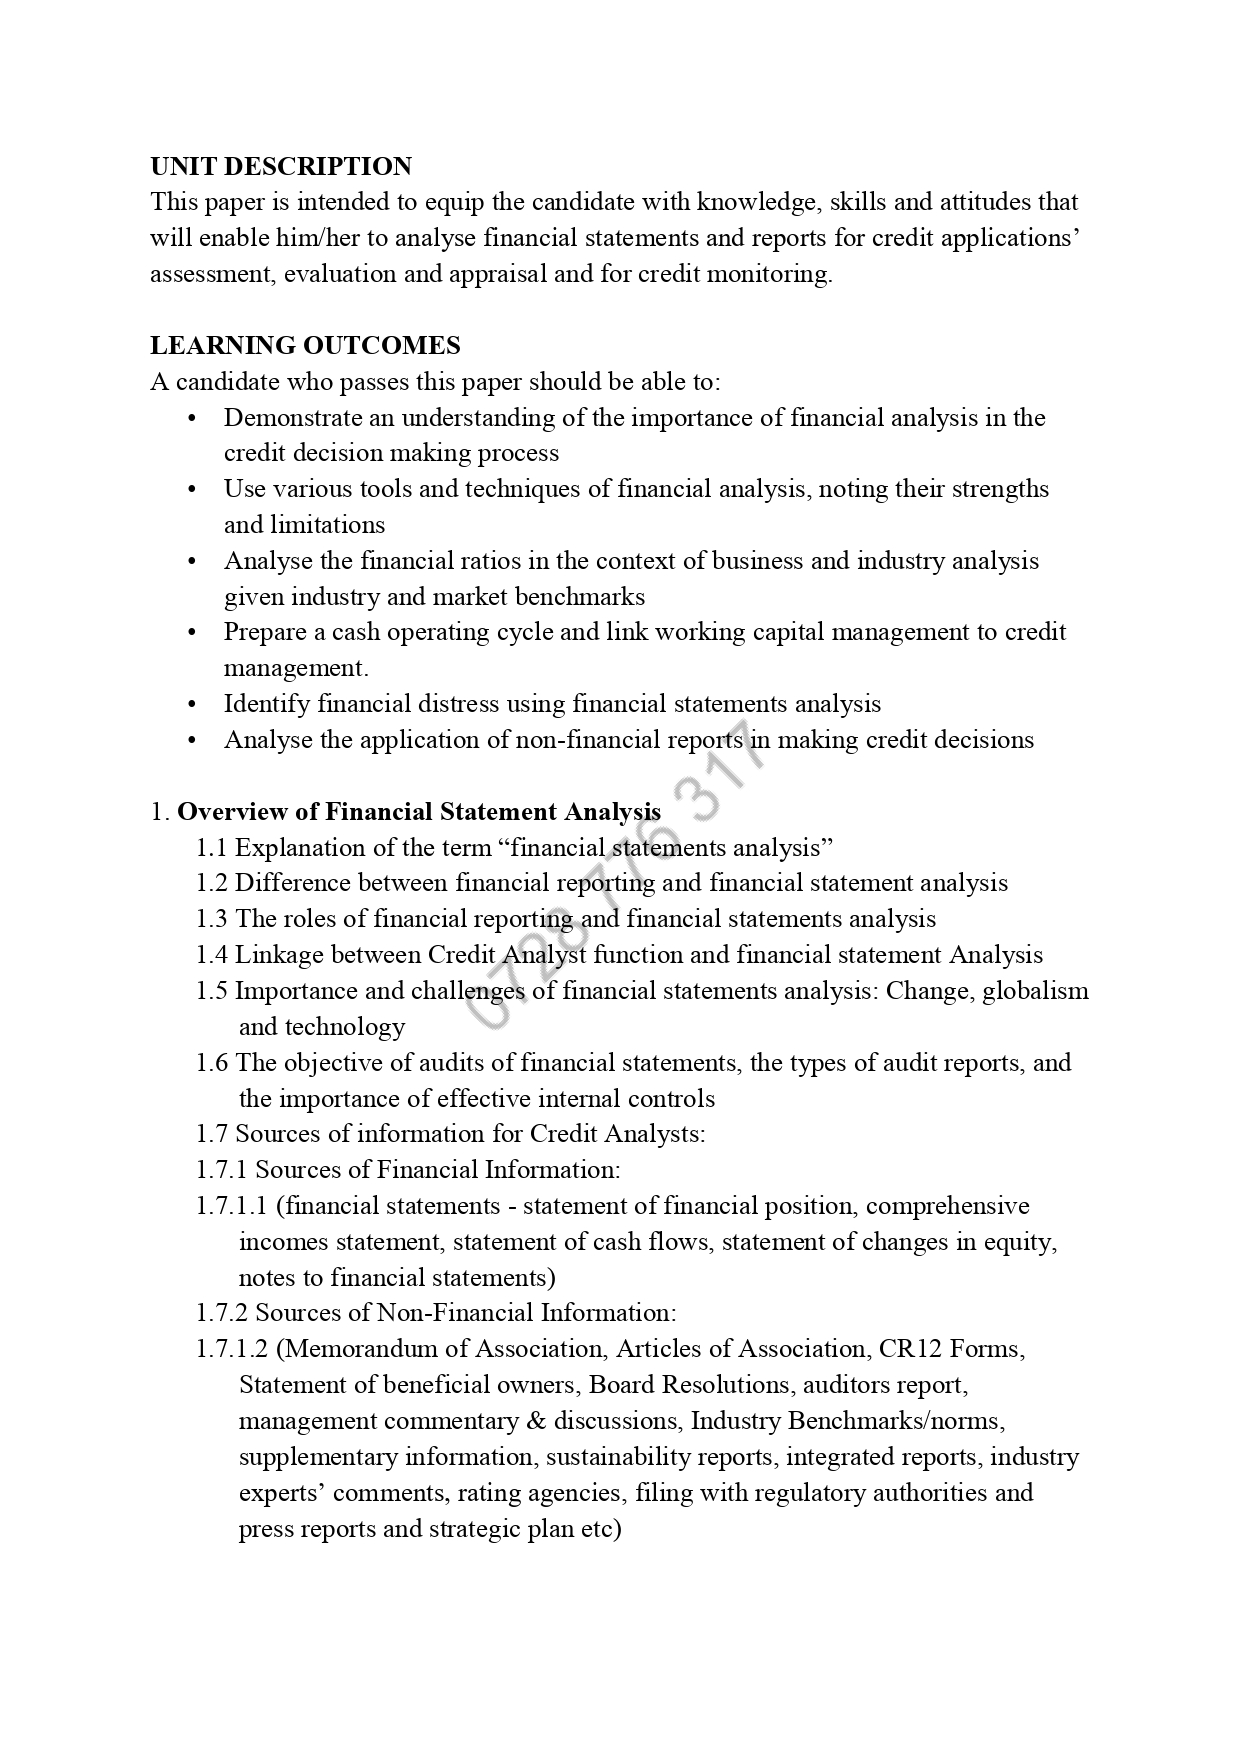
1.1 Explanation of the term “financial statements analysis”
Financial statement analysis is the process of analyzing a company’s financial statements for decision-making purposes. External stakeholders use it to understand the overall health of an organization as well as to evaluate financial performance and business value. Internal constituents use it as a monitoring tool for managing the finances.
Definition: Financial statement analysis is the use of analytical or financial tools to examine and compare financial statements in order to make business decisions. In other words, financial statement analysis is a way for investors and creditors to examine financial statements and see if the business is healthy enough to invest in or loan to.
The financial statements of a company record important financial data on every aspect of a business’s activities. As such they can be evaluated on the basis of past, current, and projected performance.
Several techniques are commonly used as part of financial statement analysis. Three of the most important techniques include horizontal analysis, vertical analysis, and ratio analysis. Horizontal analysis compares data horizontally, by analyzing values of line items across two or more years. Vertical analysis looks at the vertical affects line items have on other parts of the business and also the business’s proportions. Ratio analysis uses important ratio metrics to calculate statistical relationships.
Financial Statements As mentioned, there are three main financial statements that every company creates and monitors: the balance sheet, income statement, and cash flow statement. Companies use these financial statements to manage the operations of their business and also to provide reporting transparency to their stakeholders. All three statements are interconnected and create different views of a company’s activities and performance.
Balance Sheet The balance sheet is a report of a company’s financial worth in terms of book value. It is broken into three parts to include a company’s assets, liabilities, and shareholders’ equity. Short-term assets such as cash and accounts receivable can tell a lot about a company’s operational efficiency. Liabilities include its expense arrangements and the debt capital it is paying off. Shareholder’s equity includes details on equity capital investments and retained earnings from periodic net income. The balance sheet must balance with assets minus liabilities equaling shareholder’s equity. The resulting shareholder’s equity is considered a company’s book value. This value is an important performance metric that increases or decreases with the financial activities of a company. Income Statement The income statement breaks down the revenue a company earns against the expenses involved in its business to provide a bottom line, net income profit or loss. The income statement is broken into three parts which help to analyze business efficiency at three different points. It begins with revenue and the direct costs associated with revenue to identify gross profit. It then moves to operating profit which subtracts indirect expenses such as marketing costs, general costs, and depreciation. Finally it ends with net profit which deducts interest and taxes. Basic analysis of the income statement usually involves the calculation of gross profit margin, operating profit margin, and net profit margin which each divide profit by revenue. Profit margin helps to show where company costs are low or high at different points of the operations. Cash Flow Statement The cash flow statement provides an overview of the company’s cash flows from operating activities, investing activities, and financing activities. Net income is carried over to the cash flow statement where it is included as the top line item for operating activities. Like its title, investing activities include cash flows involved with firmwide investments. The financing activities section includes cash flow from both debt and equity financing. The bottom line shows how much cash a company has available. Below is a breakdown of some of the most common ratio metrics: Balance sheet: asset turnover, quick ratio, receivables turnover, days to sales, debt to assets, and debt to equity
Income statement: gross profit margin, operating profit margin, net profit margin, tax ratio efficiency, and interest coverage Cash Flow: Cash and earnings before interest, taxes, depreciation, and amortization (EBITDA). These metrics may be shown on a per share basis. What is an example of financial statement analysis? An analyst may first look at a number of ratios on a company’s income statement to determine how efficiently it generates profits and shareholder value. For instance, gross profit margin will show the difference between revenues and the cost of goods sold. If the company has a higher gross profit margin than its competitors, this may indicate a positive sign for the company. At the same time, the analyst may observe that the gross profit margin has been increasing over nine fiscal periods, applying a horizontal analysis to the company operating trends.
1.2 Difference between financial reporting and financial statement analysis
Financial report means any report about monitory matters. In other words a financial report is about the transactions that have financial effects. To run a business financial reports play important role as relevant financial information is transmitted to relevant users inside and outside the entity to help them in making decisions.
Some financial statements are prepared on regular basis at equal intervals and some are prepared as and when needed. Some financial reports are meant only for management and some are communicated to people outside the entity as well. Financial statement analysis is the process of analyzing a company’s financial statements for decision-making purposes. External stakeholders use it to understand the overall health of an organization as well as to evaluate financial performance and business value. Internal constituents use it as a monitoring tool for managing the finances. Several techniques are commonly used as part of financial statement analysis. Three of the most important techniques include horizontal analysis, vertical analysis, and ratio analysis. Horizontal analysis compares data horizontally, by analyzing values of line items across two or more years. Vertical analysis looks at the vertical affects line items have on other parts of the business and also the business’s proportions. Ratio analysis uses important ratio metrics to calculate statistical relationships.
Financial Reporting Financial Statement Analysis
It is the disclosure of financial results and related information to management and external stakeholders (e.g., investors, customers, regulators) about how a company is performing over a specific period of time.
It is the process of evaluating businesses, projects, budgets, and other finance-related transactions to determine their performance and suitability.
What are the different types of financial statement analysis? Most often, analysts will use three main techniques for analyzing a company’s financial statements. First, horizontal analysis involves comparing historical data. Usually, the purpose of horizontal analysis is to detect growth trends across different time periods. Second, vertical analysis compares items on a financial statement in relation to each other. For instance, an expense item could be expressed as a percentage of company sales. Finally, ratio analysis, a central part of fundamental equity analysis, compares line-item data. P/E ratios, earnings per share, or dividend yield are examples of ratio analysis.
1.3 The roles of financial reporting and financial statements analysis
Financial reports offer a wealth of insight that can streamline your business’s fiscal activities. There are three main factors among others namely: • It is required by law for tax purposes. • Financial reporting and analysis give investors, creditors, and other businesses an idea of the financial integrity and creditworthiness of your company. • Financial reporting software provides crucial information that you can use to make better business decisions – for example, whether you should open a new branch or not. For Taxes That said, taxes are arguably the biggest reason for the importance of financial statement analysis – basically, you have to do it! The government utilizes such reports to ensure that you’re paying your fair share of taxes. If financial reports weren’t legally required, most companies would probably use management dashboards instead (at least for internal decision-making purposes). 2) For other companies, investors, shareholders, etc.
If you’re considering investing money in a company, it only makes sense that you’ll want to know how well that company is doing – according to a standardized litmus test; not measurements that a company has fabricated to make themselves look good. This is where the importance of financial statements come into play for investors. This also applies to credit vendors and banks who are considering lending money to a company. In these situations, you will need to gain an accurate understanding of how likely you are to be paid back so that you can charge interest accordingly. The importance of financial analysis and statements also applies to stakeholders. If you own equity in a firm or are an activist investor who owns a major equity position, then having full disclosure of all assets, liabilities, use of cash, revenues, and associated company costs is essential. You will also want to understand if the company is doing something it shouldn’t (such as in the case of Enron). 3) For internal decision-making As mentioned, financial reports are not the best tools for making all internal business decisions. However, they can serve as the ‘bedrock’ for other reports (such as management reports) that CAN and SHOULD be used to make decisions. It’s crucial that financial reports are as accurate as possible – otherwise, any management reports (and ensuing decisions) based on them will be sitting on a shaky foundation. This is where companies can run into trouble, using legacy methods (such as one massive spreadsheet that multiple users have access to) rather than reaping the benefits of financial reporting by utilizing financial dashboards instead. 4) For improved internal vision Financial analysis and reporting are accurate, cohesive, and widely accessible means of sharing critical financial information throughout your organization. If your financial insights or data is fragmented, things can quickly fall apart. In a nutshell, this alone answers the question, what is financial reporting and analysis? Financial analysis and reporting help to answer a host of vital questions on all aspects of your company’s financial activities, giving both internal and external stakeholders an accurate, comprehensive snapshot of the strategic as well as operational metrics they need to make decisions and take informed action. 5) For raising capital and performing audits Financial reporting and analysis assists organizations, regardless of industry, in raising capital both domestically and overseas in a well-managed, fluent way – an essential component to ongoing commercial success in today’s competitive digital world.
SAMPLE WORK
Complete copy of CCP Financial Statement Analysis For Credit Managers is available in SOFT copy (Reading using our MASOMO MSINGI PUBLISHERS APP) and in HARD copy
Phone: 0728 776 317
Email: info@masomomsingi.com
Also, financial analysis and reporting facilitate statutory audits. The statutory auditors are required to audit the financial statements of an organization to express their opinion. Reporting tools or software will give this official concise, accurate, and compliant information – which, of course, is vital. 6) For managing financial ratios Ratios are essential to a business’s fiscal management initiatives – and there are many to consider. In this context, ratios are a representation of the fine juggling act businesses must perform to ensure the entire operation runs with maximum efficiency. Financial ratios also help investors break down the colossal sets of financial data accrued by businesses. A ratio gives your data form and direction, facilitating valuable comparisons on different reporting periods. Displayed visually, modern financial graphs and dashboards provide a wealth of invaluable performance-based information at a single glance, offering essential tools for accurate benchmarking and real-time decision-making. 7) For accurate projections & predictive strategies When considering the importance of financial statements to stakeholders, it’s worth mentioning the predictive power of financial analysis. By making projections based on concrete visual data, it’s possible to develop strategies that benefit financial health while nipping any potential issues in the bud. Personal financial management provider Mint.com, for example, used predictive analytics to grow its user-base and increase its bottom line. Analyzing a mix of consumer data and key financial performance metrics, the company was able to streamline its processes while offering its customers an end goal, and working backward. By providing a predictive goal or aspiration, the business worked in reverse (both internally and externally), developing accurate solutions or strategies that offered the best return on investment (ROI) along the way. 8) For lowering risk and preventing fraudulent activities Expanding on our previous point, the depth of data and predictive capabilities that the financial BI dashboard software offer can mitigate financial risk, significantly. Working with the right mix of metrics, you will begin to see any potential dips in performance or negative patterns unfold intuitively, which means you can take critical actions that prevent potentially devastating monetary calamities.
Armed with dynamic, visual, and interactive KPIs, not only can you mitigate financial risk and protect your company from glaring inefficiencies, but you will be able to make smarter investments and decisions. Here are some of the KPIs that you should focus on for financial protection, and growth: Summary: Financial statement analysis is important because it is useful for helping answer lots of questions (and raising more questions about an entity: – is it solvent? – how much is it worth? – is it likely to remain a going concern? – how likely is it to be able to repay a loan? – how much would it raise if liquidated? – what are its expected future cashflows? – what risks does it face? – how competent are its accountants and auditors? – how would various answers change if various external factors such as exchange rates changed? – how much can a taxing authority/ corrupt regulator/ greedy powerful entity screw it without destroy it? – does it pay too much for something/ people? – do I want to buy its shares? – do I want it as a client/ employer/ supplier? – how much can I probably bargain down its prices.
1.4 LINKAGE BETWEEN CREDIT ANALYST FUNCTION AND FINANCIAL STATEMENT ANALYSIS
A credit analyst role involves assessing the creditworthiness of an individual or company to determine the likelihood that they will honor their financial obligations. Credit analysts evaluate a borrower’s past financial and credit history to determine their financial health and their ability to repay credit advanced to them by a lender. Typically, credit analysts are employed by credit rating agencies, credit card-issuing companies, commercial and investment banks, and investment companies.
When evaluating a borrower’s financial health, the credit analyst gathers important financial information and evaluates it using financial ratios. They can also compare the ratios with industry benchmarks to decide if a borrower’s cash flow is sufficient to repay the loan.
The credit analyst will then recommend the credit limit for a new customer based on the company’s lending policies, but the final decision on whether or not to grant credit will be made by the underwriter who relies on the analyst’s intelligence to make his decision.
1.5 IMPORTANCE AND CHALLENGES OF FINANCIAL STATEMENTS ANALYSIS: CHANGE, GLOBALISM AND TECHNOLOGY
Problems in Financial Statement Analysis
Financial statement analysis can be a very useful tool for understanding a firm’s
performance and conditions. However, there are certain problems and issues encountered in such analysis which call for care, circumspection, and Judgment.
1.Lack of an Underlying Theory:
The basic problem in financial statement analysis is that there is no theory that tells us which numbers to look at and how to interpret them. In the absence of an underlying theory financial statement analysis appears to be ad hoc informal and subjective. From a negative viewpoint, the most striking aspect of ratio analysis is the absence of an explicit theoretical structure.
2.Conglomerate Firms:
Many firms, particularly the large ones, have operations spanning a wide range of industries. Given the diversity of their product lines, it is difficult to find suitable benchmarks for evaluating their financial performance and condition. Hence, it appears that meaningful benchmarks may be available only for firms which have a well defined industry classification.
3.Window Dressing:
Firms may resort to window dressing to project a favorable financial picture. For example, a firm may prepare its balance sheet at a point when its inventory level is very low. As a result, it may appear that the firm has a very comfortable liquidity position and a high
turnover of inventories. When window dressing of this kind is suspected, the financial analyst should look at the average level of inventory over a period of time and not the level of inventory at just one point of time.
4.Variations in Accounting Policies:
Business firms have some latitude in the accounting expenses, foreign exchange transactions, installment sales, preliminary and pre-operative expenses, provision of reserves, and revaluation of assets. Due to diversity of accounting policies found in practice, comparative financial statement analysis may be vitiated.
5.Interpretation of Results:
Though industry average and other yardsticks are commonly used in financial ratios, it is somewhat difficult to judge whether a certain ratio is good or bad. A high current ratio, for example may indicate a strong liquidity position (something good) or excessive inventories (something bad). Likewise a high turnover of fixed asset may mean efficient utilization of plant and machinery or continued flogging of more or less fully depreciated worn, out and inefficient plant and machinery.
6.Correlation among ratios:
Notwithstanding the previous observation, financial ratios of a firm often show a high degree of correlation. This is because several ratios have some common element (sales for example, is used in various turnover ratios) and several items tend to move in harmony
because of some common underlying factor. In view of ratio correlations, it is redundant and often confusing to employ a large number of ratios in financial statement analysis.
Hence it is necessary to choose a small group of ratios from a large set of ratios. Such a selection requires a good understanding of the meaning and limitations of various ratios and an insight into the economies of the business.
Financial statement analysis can benefit organizations in numerous ways.
1. It provides internal and external stakeholders with the opportunity to make informed decisions regarding investing. 2.Financial statement analysis also provides lending institutions with an unbiased view of a business’s financial health, which is helpful for making lending decisions.
3.And as top executives and others in management rely on accounting to provide an accurate depiction of the effects of their decisions, financial statement analysis helps with matters of corporate governance as well.
4. Analysis of financial statements provides information about the financial position & performance of the company.
5. It helps the management in planning & deciding the future policies of the company.
6.Analysis helps in finding out the earning capacity & operating performance of the company.
1.6THE OBJECTIVE OF AUDITS OF FINANCIAL STATEMENTS, THE TYPES OF AUDIT REPORTS, AND THE IMPORTANCE OF EFFECTIVE INTERNAL CONTROLS
What is the main objective of an audit? What is an Audit? An official inspection of an organization’s accounts, typically by an independent body. The objective of an audit is to form an independent opinion on the financial statements of the audited entity. The opinion includes whether the financial statements show a true and fair view, and have been properly prepared in accordance with accounting standards.
The main aim of an audit of financial statements is to enable an auditor to express an opinion as to whether the financial statements are prepared, in all material respects, in accordance with International Financial Reporting Standards or another identified financial reporting framework.
Primary Objectives of Auditing • Examining the system of internal check. • Checking arithmetical accuracy of books of accounts, verifying posting, casting, balancing, etc. • Verifying the authenticity and validity of transactions. • Checking the proper distinction between capital and revenue nature of transactions
Types of Audit Reports An audit report is an appraisal of a small business’s complete financial status. Completed by an independent accounting professional, this document covers a company’s assets and liabilities, and presents the auditor’s educated assessment of the firm’s financial position and future. Audit reports are required by law if a company is publicly traded or in an industry regulated by the Securities and Exchange Commission (SEC). Companies seeking funding, as well as those looking to improve internal controls, also find this information valuable.
1.UNQUALIFIED OPINION
Often called a clean opinion, an unqualified opinion is an audit report that is issued when an auditor determines that each of the financial records provided by the small business is free of any misrepresentations. In addition, an unqualified opinion indicates that the financial records have been maintained in accordance with the standards known as Generally Accepted Accounting Principles (GAAP). This is the best type of report a business can receive.
An unqualified audit opinion indicates that auditors could find no significant violations or misstatements in a company’s financial information. An alternate name for this report is a clean opinion, which is a comparison to a patient’s clean bill of health. Auditors typically write this report referencing the company’s ability to record financial information according to generally accepted accounting principles (GAAP). The report also may include a brief summary of how the audit was conducted and what information was reviewed.
2.QUALIFIED OPINION
A qualified audit opinion letter indicates that auditors found issues in a company’s financial information. These issues prevent the auditors from issuing a clean opinion on the company’s operations. Qualified audit opinions often have one of two specific qualifications. The first qualification represents a single deviation from GAAP. This indicates the business has improperly applied GAAP, and the company’s financial statements do not conform to standard accounting principles. Another qualification is limitation of scope. Limitation of scope indicates that auditors cannot review one or more areas related to the company’s financial statement. This qualification relates only to the financial information not reviewed by auditors. A qualified opinion, however, will include an additional paragraph that highlights the reason why the audit report is not unqualified.
3.ADVERSE OPINION
An adverse opinion letter is one of two significantly negative audit reports. An adverse opinion indicates the auditor found significant material misstatements relating to financial information. These misstatements typically mean financial statements do not conform to GAAP and the information is inaccurate or unreliable. Banks and lenders typically avoid companies that have adverse audit opinions. Financial information with significant flaws does not present an accurate representation of the company’s financial health.
4.DISCLAIMER OF OPINION
A disclaimer audit opinion letter is the worst audit report a company can receive. Auditors issue the disclaimer letter to indicate they cannot form an opinion regarding the company’s financial statements. Auditors also use the disclaimer when they refuse to issue an opinion on the company’s financial statements. A disclaimer opinion is often the result when an auditor lacks independence from his client. A lack of independence can occur when auditors provide management advisory services in conjunction with an audit. This prevents the auditor from giving a clear, third-party opinion on the company’s financial information. On some occasions, an auditor is unable to complete an accurate audit report. This may occur for a variety of reasons, such as an absence of appropriate financial records. When this happens, the auditor issues a disclaimer of opinion, stating that an opinion of the firm’s financial status could not be determined.
Importance of effective internal controls Good internal controls are essential to assuring the accomplishment of goals and objectives. They provide reliable financial reporting for management decisions. … Good internal controls help ensure efficient and effective operations that accomplish the goals of the unit and still protect employees and assets.
Good internal controls help ensure efficient and effective operations that accomplish the goals of the unit and still protect employees and assets.
1.7 SOURCES OF INFORMATION FOR CREDIT ANALYSTS: SOURCES OF FINANCIAL INFORMATION:
(Financial statements – statement of financial position, Balance Sheet The balance sheet is a summary of what the business owns (its assets) and what it owes (its liabilities) and the difference between the two (net worth, also called owner’s equity). Assets are categorized into two kinds, current and non-current. Current assets are those that are cash or can readily be converted to cash within the next year.
They can include cash and checking account balances, growing crops or market livestock, and monies owed to the business. Non-current assets include intermediate assets and long-term assets. Intermediate assets will include breeding livestock, farm machinery and equipment and titled vehicles.
Liabilities are also categorized as current and non-current. Current liabilities cover a period over the next year. They include interest on debts which is accumulating and is due to be paid in the next year, principal payments on term debts which will be due in the next year and taxes to be due in the next year. Intermediate liabilities cover the same period as intermediate assets and include debt on farm machinery, breeding livestock and equipment which is to be paid off in the next two to five years.
Long term liabilities are debts to be paid over a period of more than five years such as that on land and buildings. Any taxes which might be due if the assets were to be sold must be included as deferred liabilities. The total assets and total liabilities are calculated. The net worth of the business is the difference between the total assets and the total liabilities and represents the balance of the assets and the liabilities.
Comprehensive incomes statement, Statement of comprehensive income deals with the two of the five elements of financial information namely income and expense. Studying these two variables together let you peek into entity’s financial performance in the past period that can either be monthly, quarterly, semi-annually or annually depending on how often entity publishes financial statements. As per IAS 1 entity’s financial performance can be presented in a single Statement of Comprehensive Income or in two separate statements namely Income statement and Statement of Other Comprehensive Income. Entity is free to choose whether to report in a single statement or two as IAS 1 prescribes no conditions in this regard.
To assess financial performance the idea is simple. Current stakeholders and prospective investors are interested in knowing if entity is making excess revenue (income) above expenses. Mathematically it can be shown as follows: Profit = [Revenue – Cost of Sales] + Other income – Expenses
