

MAASAI MARA UNIVERSITY
REGULAR UNIVERSITY EXAMINATIONS
2018/2019 ACADEMIC YEAR
FOURTH YEAR FIRST SEMESTER
SCHOOL OF BUSINESS AND ECONOMICS
BACHELOR OF SCIENCE IN ECONOMICS
AND STATISTICS
COURSE CODE: ECS 4103
COURSE TITLE: APPLIED STATISTICS
DATE: 10TH DECEMBER 2018 TIME: 0830 – 1030 HOURS
INSTRUCTIONS TO CANDIDATES
Answer Question ONE and any other THREE questions
This paper consists of TWO printed pages. Please turn over.
ECS 4103 – Applied Statistics
Question One
(a) Explain the significance of statistics in production (6marks)
(b) Consider the data below which shows the quantity of sugar in millions of
tones (Y) per year and the value of out of dollars per ton, (X)
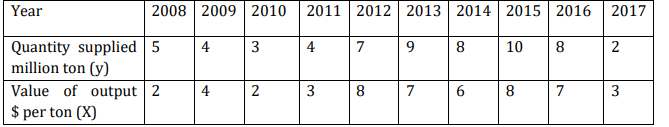
i. Using this data estimate the regression equation of Y on X (7marks)
ii. Test the hypothesis that the regression coefficient is significant at 5%
level (7marks)
iii. What percentage of the variation in Y is explained by variation in X
(5marks)
Question Two
From the sample below:
a) Calculate the variance of the estimates (8marks)
b) Test the significance of b1 and b2 at 5% level of significance. (7marks)
Question Three
(a) Given a sample with a mean µ = 100 and variance δ = 81, and a random
sample of n = 25 is obtained. What is the probability that the sample mean lies
between 98 and 101? (5marks)
(b) Given a population with a mean of 400 and a variance of 16. If a sample of
35 is obtained,
ECS 4103 – Applied Statistics
i. What is the probability that sample mean will be more than 412.
(5marks)
ii. What is the probability that sample mean will be less than or equal to
389 (5marks)
Question Four
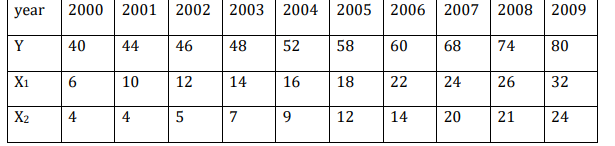
The table below gives real per capita income in thousands of dollars Y with
the percentage of labour force in agriculture X1 and average years of schooling
of the population over 25 years of age X2 for 10 developed countries in 2018.
n 1 2 3 4 5 6 7 8 9 10
Y 6 8 8 7 7 12 9 8 9 10
X1 9 10 8 7 10 4 5 5 6 8
X2 8 13 11 10 12 16 10 10 12 14
a) Find the partial correlation coefficient between Y and X1 (7marks)
b) Find the partial correlation coefficient between Y and X2 (7marks)
c) Which of the two exogenous variables contribute more to the
explanatory power of the model? (1mark)
Question Five
(a) A researcher wishes to estimate the mean weekly wage of the several
thousands of workers employed in a firm within plus or minus Sh 20 and with
a 99% degree of confidence. From past experience, the researcher knows that
the weekly wages of these workers are normally distributed with a standard
deviation of Sh 40. What is the minimum sample size required. (5marks)
(b) Given the following
Income 138 152 104 112 114 154 116 110 134 106 114 128
Expenditure 18 24 12 20 18 20 14 16 24 12 22 16
Calculate the income elasticity of expenditure (10marks)