

UNIVERSITY EXAMINATIONS: 2018/2019
EXAMINATION FOR THE DEGREE OF BACHELOR OF BUSINESS
INFORMATION TECHNOLOGY
BUSS305 STATISTICAL DECISION MAKING
FULL TIME / PART TIME / DISTANCE LEARNING
DATE: APRIL, 2019 TIME: 2 HOURS
INSTRUCTIONS: Answer Question One & ANY OTHER TWO questions.
QUESTION ONE (30 MARKS)
(a) Differentiate between the following.
(i) Statistic and parameter
(ii) Type I and Type II errors (4 Marks)
(b) In a sample of 400 people,172 were males. Estimate the population proportion at 95% level
of confidence. (5 Marks)
(c) (i) ) Briefly explain the procedure generally followed in testing hypothesis. (6 Marks)
(ii)The mean lifetime of a sample of 400 light light tubes produced by a company is found to be
2,570 hours with a standard deviation of 80 hours. Test the hypothesis that the mean life time of
the tubes produced by the company is 2,600 hours at 95% level of confidence.
(5 Marks)
(d)The populations mean production of credit cards in a particular communication company is 65
units per hour. In a particular day the following data about the number of units produced was
collected.
63 64 69 71 70 69 63 70 65 66
Assuming a t-distribution, determine the value of t for the sample collected. (4 Marks)
(f) List THREE advantages of simulation (3 Marks)
(g) Explain why statistical estimation theory is important in business decision making.
(3 Marks)
QUESTION TWO (20 MARKS)
(a) Explain the importance of statistics in Management Decision Making. [8 Marks]
(b) . An investor is considering three alternatives-a certificate of deposit, a low risk stock fund, and
a high risk stock fund- for a $20,000 investment. The investor considers three possible states of
nature
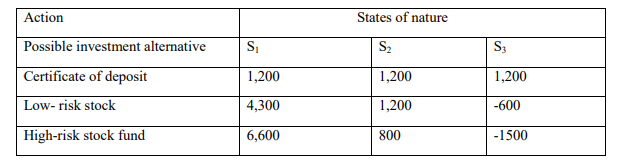
(i) Which action is selected by the investor if he is a risk seeker? [2Marks]
(ii) Which action is selected by the investor if he is a risk averter? [2Marks]
(iii) Which criteria is selected by the minim ax regret criterion? [5Marks]
(iv) Draw the decision tree for the investor’s problem. [3Marks]
QUESTION THREE (20 MARKS)
(a) Discuss the significance of hypothesis testing in business. [6 Marks]
(b) Give three areas when chi-square test can be applied. [6 Marks]
(c) A random sample of 400 households is classified by two characteristics: whether they own a
colour television and by what type of house holder (i.e owner occupier, private tenant ,council
tenant).The results of the investigations are as shown below
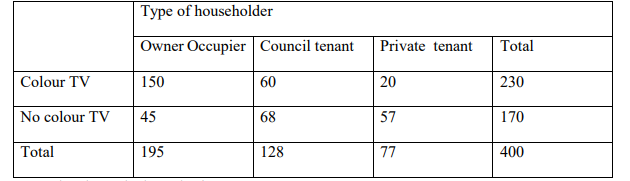
Ho: The two classifications are independent (i.e no relationship between classes of householder and colour TV ownership)
H1:The classifications are not independent. [8Marks]
QUESTION FOUR (20MARKS)
(c) Using appropriate examples differentiate the following;
(i) Purposive/judgmental and snowball sampling. (4Marks)
(ii) Convenience and quota sampling (4Marks)
(d) A large hospital wants to estimate the average length of time previous patients have
remained in hospital. To accomplish this objective a random sample of 100 patient’s
records is obtained from all the previous records. From the data the following statistics
were obtained.
Sample mean =7.84
Variance=88.85
Find the 95%confidence interval for the mean length of time all previous patients
remained in the hospital. (6Marks)
(e) Jamii ltd has two factories in different parts of the country. Their resources, including the
labour force skills are regarded as identical and both factories were built at the same time.
A random sample of output data during a given period has been taken from each factory
and converted to standard hours of output per employee. The data given below:
Factory 1 42 50 43 39 41 49 52 41 46 48
Factory 2 39 45 36 42 52 37 43 41 40 39
You are given that for factory 1 mean=45.1 and variance =20.10 and that for factory 2
mean=41.4 and variance=21.16.
Test the hypothesis that the mean of standard hours for employees in the two factories is
the same and interpret the outcome. (6Marks)
QUESTION FIVE (20 MARKS)
(a) Define the following terms as used in business decision making.
(i) Multiple regression
(ii) Least squares method (4Marks)
(b) Explain any three applications of regression analysis in business today. (6Marks)
(c) By collecting data on volume and cost and using the least squares method to develop an estimated
regression equation relating volume and cost, an accountant can estimate the cost associated with
a particular manufacturing volume. Consider the following sample of production volumes and
total cost data for a manufacturing operation.
Production Volume(units) Total cost($)
400 4000
450 5000
550 5400
600 5900
700 6400
750 7000
(i) Use the data to develop an estimated regression equation that could be used to predict
the cost for a given production volume. (7 Marks)
(ii) What is the variable cost per unit produced? (1 Mark)
(iii) The company’s production schedule shows 500 units must be produced next month.
What is the estimated total cost for this operation? (2 Marks)