
 UNIVERSITY EXAMINATIONS: 2020/2021
EXAMINATION FOR THE DEGREES OF
BACHELOR OF SCIENCE IN SOFTWARE DEVELOPMENT
BSD 3101: PRINCIPLES OF DATA SCIENCE
FULL TIME
ORDINARY EXAMINATION
DATE: DECEMBER, 2021 TIME: 2 HOURS
INSTRUCTIONS
1. This paper consists of 4 Questions.
2. Answer QUESTION ONE and any OTHER TWO Questions.
QUESTION ONE-COMPULSORY [20MARKS]
a). With practical examples, distinguish between supervised statistical learning and
unsupervised statistical learning as used in data science. [4marks]
b). Explain the difference between organized data and unorganized data as used in data
science.
[2marks]
c). Table Q1c) shows a typical interest rate data set.
i). Sketch and explain the Scatterplot for interest rate dataset. [3marks]
ii). Using the data, set explain the concepts of data quality and feature selection as used in
data science. [3marks]
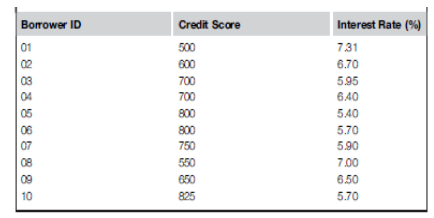
Table Q1c). A Typical a dataset.
d). KCA University is carrying out a study to determine the course completion rate among
students in the Faculty of Computing and Information technology. You have been
presented with the admission data, course enrolment data and graduation data for a period
of 4 years. You are required to carry out a detailed data analysis using Rapid Miner Studio
Educational software (recommended version) whose main processing blocks are as shown
in Fig. Q1d).
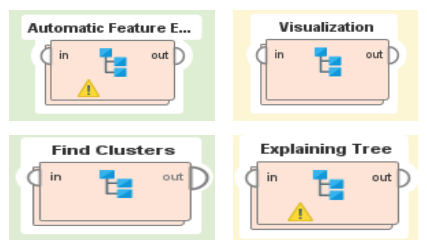
Fig. Q1d. Key Processes in Rapid Miner Studio Educational software
i). Explain the role that you will assign each of the processes blocks represented in Fig.
Q1d. [4marks]
ii). Draw a block diagram and explain how you will apply the explaining Tree in this case.
[4marks]
QUESTION TWO [15MARKS]
a). State two types of problems that can be tackled using supervised learning. [1mark]
b). Suppose that in statistical learning, we observe a quantitative response Y and p different
predictors, ?1, ?2, . . . , ??. Assume that there is some relationship between Y and ? =
(?1, ?2, . . . , ??), which can be written in the very general form:
? = ?(?) + ? (2.1)
where ? is some fixed but unknown function of ?1, ?2, . . . , ?? and ? is a random error
term which is independent of X and has mean zero.
Consider advertising data set consisting of the sales of a product in 200 different markets,
along with advertising budgets for the product in each of those markets for three different
media: TV, radio, and newspaper. The data are displayed in Figure Q2a). The plot displays
sales, in thousands of units, as a function of TV, radio, and newspaper budgets, in
thousands of dollars, for 200 different markets.
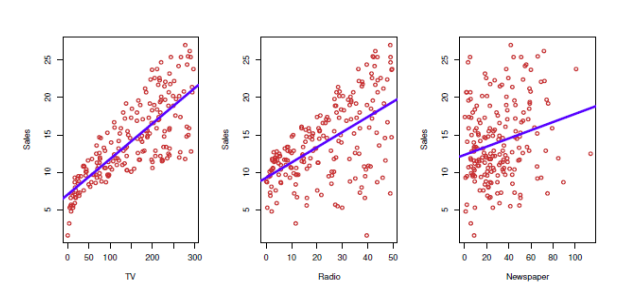
Figure Q2. The Advertising data set.
i). Use equation (2.1) and Figure Q2 to interpret this data. [4marks]
ii). State and explain two main reasons why we may wish to estimate f. [4marks]
iii). Outline two quantities that are responsible for the accuracy of ?̂ as a prediction for Y.
[2marks]
iv). Identify and briefly explain the two statistical learning methods for estimating f.
[4marks]
QUESTION THREE [15MARKS]
a). Distinguish between Exploratory data analysis (EDA) and Data mining. [2marks]
b). Define Data wrangling and outline two main Data wrangling tasks. [3marks]
c). Discuss the following data science tasks, bringing out clearly the description, the relevant
algorithms and examples. [4marks]
i). Classification
ii). Regression
d). Consider the credit data set plots of Fig. Q3d).
i). Use this data set to explain how linear model selection will be achieved by using
the Best Subset Selection method. [3marks]
ii). State the relationship for Mallow’s Cp which can be used to compute the estimate
of the Mean Squared Error (MSE) in the credit data set. [1mark]
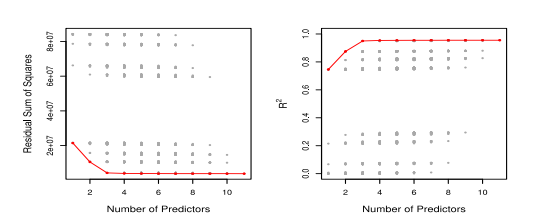
Fig. Q3d
e). Explain how data shrinkage (Regularization) is achieved using the Ridge Regression
method. [3marks]
QUESTION FOUR [15MARKS]
a). With examples, explain two methods of acquiring data in data science. [2marks]
b). Identify, with examples, the two main types of data storage. [2marks]
c). Consider the weather data set of Table Q4c).
i). Using the data write down a set of five rules representing five outcomes and based on
these rules, construct the decision tree diagram. [5marks]
ii). Show and explain how you will use the following data visualization methods to
display the data: [6marks]
1. Histogram
2. Distribution plot
3. Scatter plot
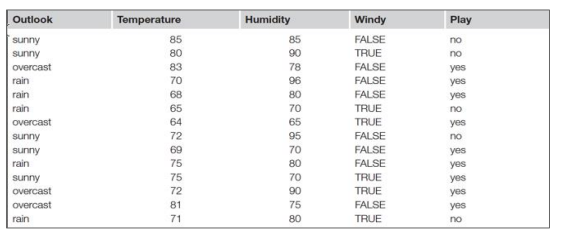
Table Q4c. Weather Data