

MAASAI MARA UNIVERSITY
REGULAR UNIVERSITY EXAMINATIONS 2013/2014 ACADEMIC YEAR
SECOND YEAR SECOND SEMESTER
SCHOOL OF BUSINESS AND ECONOMICS
BACHELOR OF BUSINESS MANAGEMENT
COURSE CODE: BHR 200
COURSE TITLE: STATISTICS
DATE:22ND APRIL 2014 TIME: 9.00AM – 12.00PM
INSTRUCTIONS TO CANDIDATES
Question ONE is compulsory
Answer any other THREE questions
This paper consists of 2 printed pages. Please turn over.
QUEATION ONE
1.Industrial engineers periodically conduct work measurement analyses to determine the time required to produce a single unit of output. At a large processing plant, the number of total work –hours required per day to perform a certain firm was recorded for days. The data are shown below.
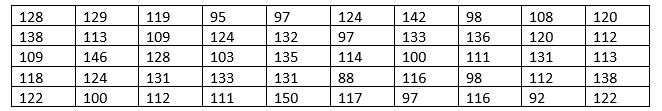
a) Compute (8marks)
(i) Mean (ii ) median (iii) mode
b) Find: (I) range (ii) variance (iii) standard deviation (8 marks)
c) Construct the intervals (i) x ± s (ii )x ± 2s
iii)X ± 3s (4marks)
d) Find the 70th percentile for the data and interpret its value. (5marks)
QUESTION TWO
a) The weekly wages of 30 workers in Tuskys supermarket as follows.
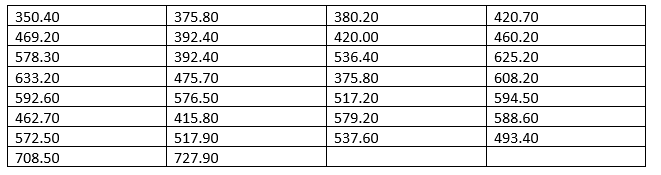
I. Form frequency distribution taking the first class as 300-400. (5marks)
II. Calculate Karl Pearson’s coeffient of skew-ness (4marks)
III. Find the quartiles. (3marks)
b) Explain the properties a good measure of variation. (3marks)
QUESTION THREE
a) Differentiate between diagrams and graphs. (4marks)
b) The following zero order coefficients of correlation are given as follows.
r12=0.9 r13=0.4 r23=0.6
Calculate ; i)r12.3 ii)r13.02 iii)R1.23 iv)R2.13 (6marks)
c) Explain the problems that arise in the collection of data. (5marks)
QUESTION FOUR
a) Explain the sources of errors in the application of chi-square test. (5marks)
b) Two random samples were drawn from the normal populations and their values are given as follows.
X 66 67 75 76 82 84 88 90 92
Y 64 66 74 78 82 85 87 92 93 97
I. Test whether the two population have the same variance at the 5% level of significance (10marks)
QUESTION FIVE
a) Discuss main sources of secondary data (5marks)
b) Explain the precautions taken in drafting a questionnaire. (5marks)
c) Explain factors considered in determining sample size. (5marks)