MAASAI MARA UNIVERSITY
REGULAR UNIVERSITY EXAMINATIONS 2013/2014 ACADEMIC YEAR
SECOND YEAR FIRST SEMESTER
SCHOOL OF BUSINESS AND ECONOMICS
BACHELOR OF ARTS IN ECONOMICS
COURSE CODE: ARE 205
COURSE TITLE: INTRODUCTION TO ECONOMETRICS I
DATE:17TH APRIL 2014 TIME: 9.00AM – 12.00PM
INSTRUCTIONS TO CANDIDATES
Question ONE is compulsory
Answer any other TWO questions
QUESTION 1:
(a) East African industries ltd has embarked on serious marketing campaign to attract clients from competitors. The following table represents its data on sales (Y) in tens thousands of customers, radio advertising expenditures (X1) and newspaper advertising expenditure(X2) for the last 4 years.

All expenditures are expressed in thousands of shillings.
(i) Derive a multiple regression line that relates sales to advertising expenditures and interpret your results. (9mks)
(ii) What proportion of the total variation in the sales is explained by prices and wages? (5mks)
(iii) Construct the ANOVA table for this data. (6mks)
(b) The relationship between demand for imports(Y), personal consumption expenditure(X1) and ratio of imports to domestic prices(X2) for a given country for the last 19 years is estimated to be as follows:

(i) Evaluate the above estimated function on the basis of available economic and statistical criteria. (3mks)
(ii) Forecast the demand for imports if consumption expenditure and ratio of imports to domestic prices are projected to increase by 10% by the year 2015. (3mks)
(iii) Test the hypothesis that consumption expenditure and prices have a joint significant influence on demand for imports and comment on your results. Use a 99% confidence level. (4mks)
QUESTION 2
(a)With the use of appropriate examples, discuss three main goals of econometrics that you are familiar with. (9mks)
(b)Why is model specification, considered as the most important stage of any econometrics research, yet the weakest point of most econometrics application? (6mks)
(c)Discuss the role of economic theory in econometric research. (5mks)
QUESTION 3
(a) The ranking of profits and costs for 5 different companies for the year 2012 is presented below:
Profits 20 50 30 70 80
Costs 30 40 40 80 90
(i) How strong is the linear correlation between profits and costs? Explain your answer. (7mks)
(ii) Compute the rank correlation coefficient and comment on your answer/results. (6mks)
b) Clearly discuss the properties of a good econometric model. (7mks)
QUESTION 4
(a) With appropriate examples explain what you understand by the term multicollinearity. (2mks)
(b) Discuss the main consequences of multicollinearity in an econometric relationship. (8mks)
(c) OLS estimators are “BLUE”. With the use of appropriate examples, discuss clearly what you understand by this statement. (10mks)
QUESTION 5
Using the data provided below, solve the following problems
Y : 0, 2, 1, 3, 1, 3, 4, 2, 1, 2
X : 0, 1, 2, 1, 0, 3, 4, 2, 2, 1
(a) Fit a regression line of the form Y= α + βX + ε and interpret your results. (6mks)
(b) Calculate the elasticity of y with respect to X when X = 4 and interpret your results. (4mks)
(c) Calculate the residual value of Y when X = 4. (6mks)
(d) Calculate ESS and RSS for this data. (4mks)
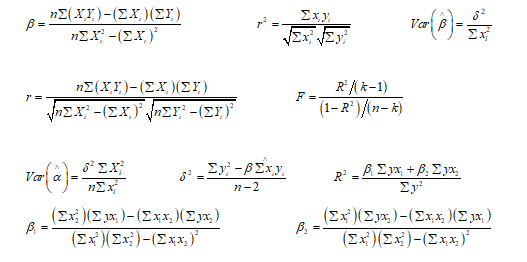
SOME SELECTED ECONOMETRIC FORMULAE (OPTIONAL)
